CHAPTER 11
Rate of Consolidation
QUESTIONS AND PRACTICE PROBLEMS
Section 11.1 Terzaghi’s Theory of Consolidation
11.1 A 12.0-m thick clay stratum with double drainage is to be subjected to a Δσz of 75 kPa.
The coefficient of consolidation in this soil in 3.5 x 10⁻³ m
2/d. Using Equation 11.17,
compute the hydrostatic, excess, and total pure water pressure at a point 2.7 m above the
bottom of this stratum 10 years after placement of the load.
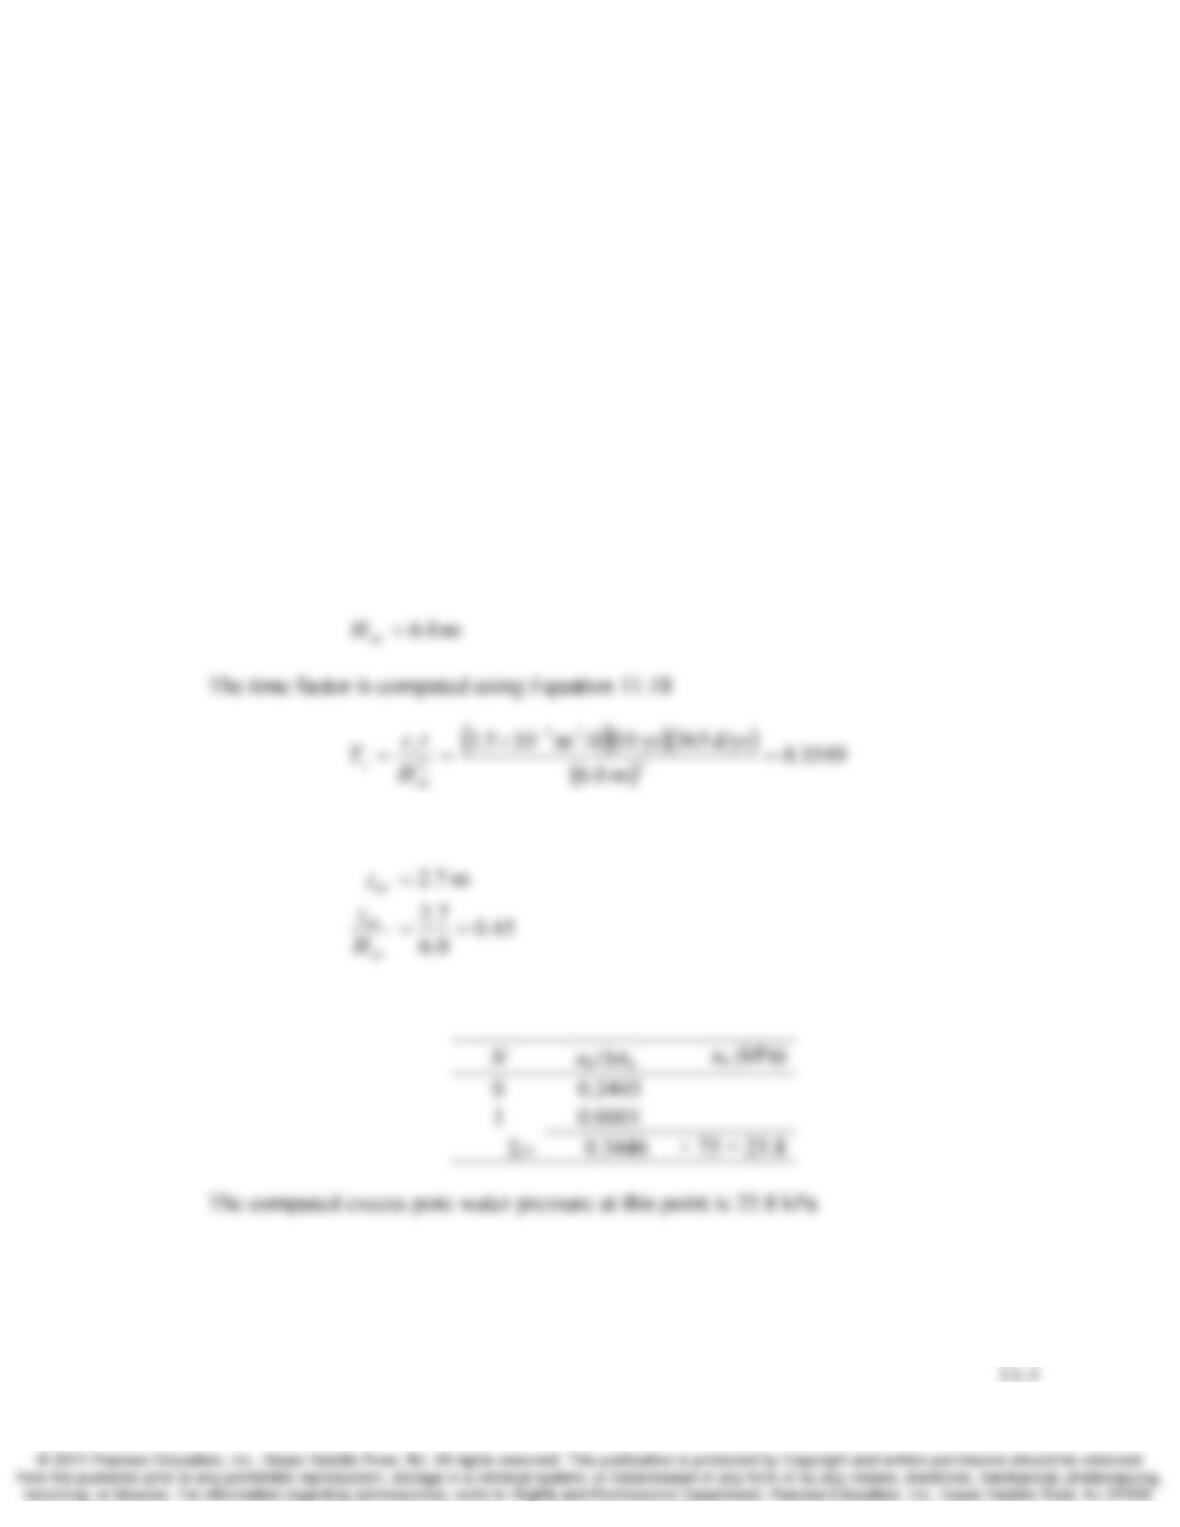
Solution
Since the layer is doubly drained, the maximum drainage path is
And, at the point of interest
Using Equation 11.17 to compute the excess pore water pressure at the point of interest
11-2 Rate of Consolidation Chap. 11
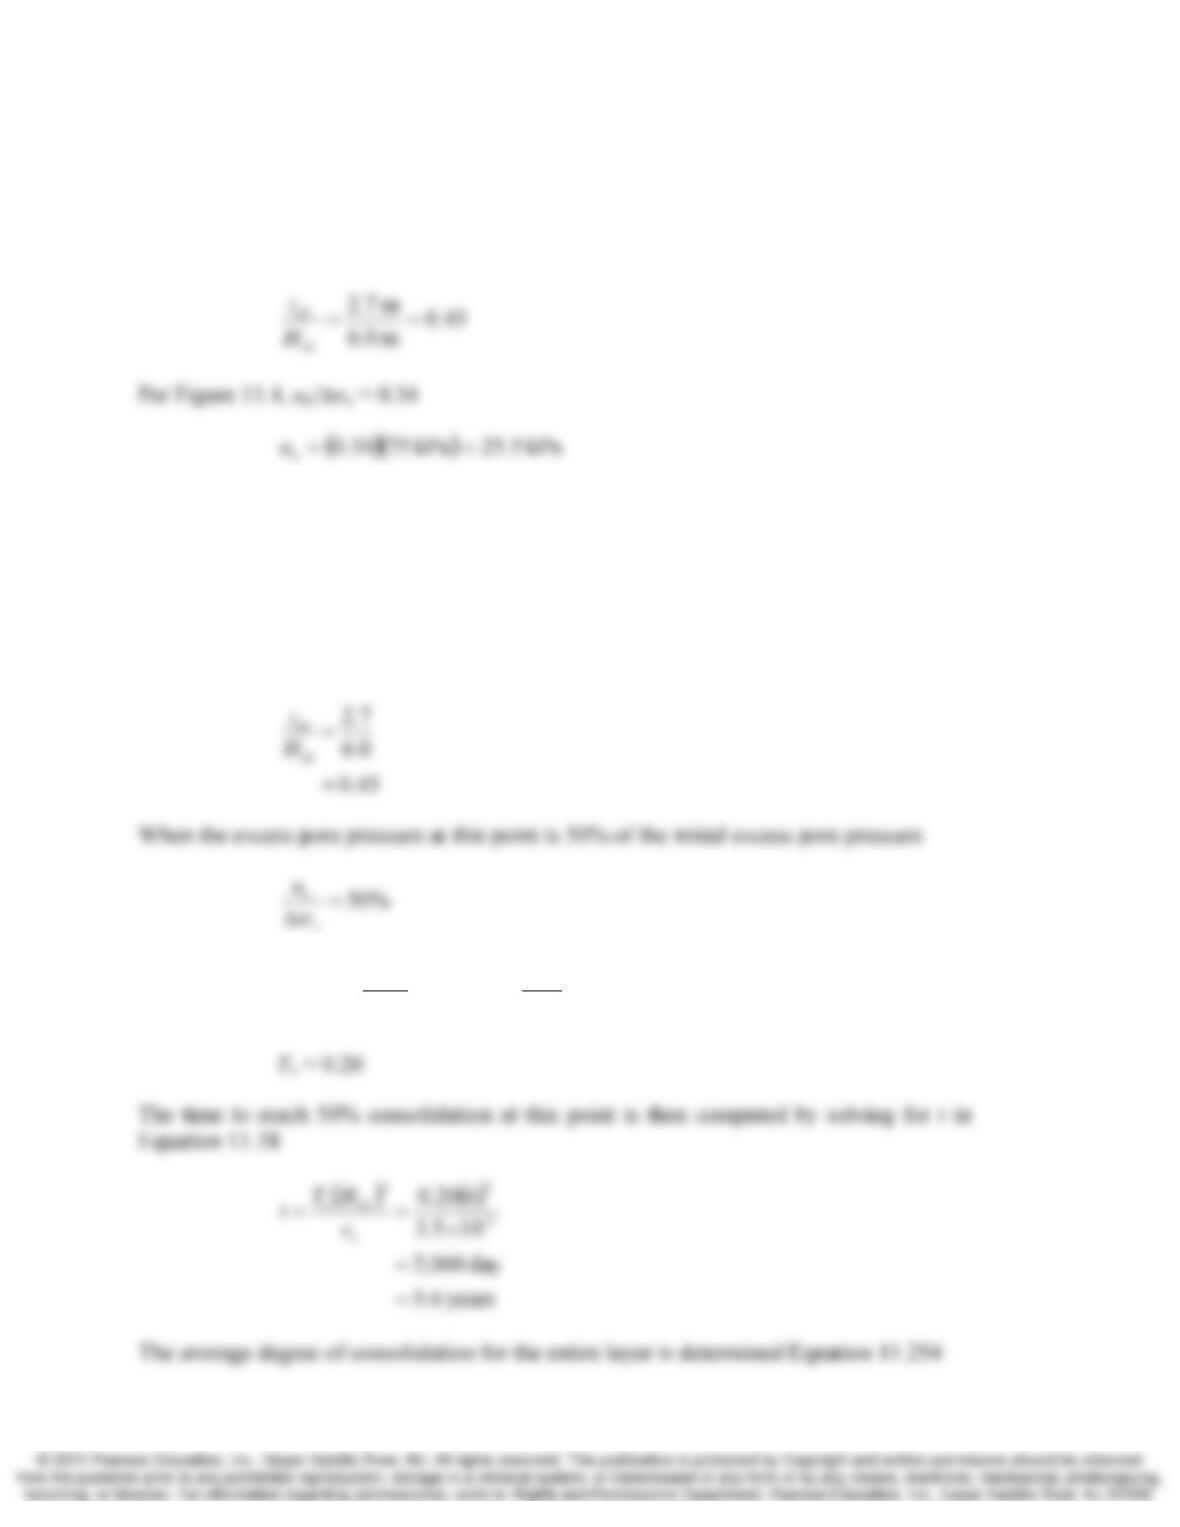
11.2 Solve Question 11.1 using figure 11.4.
Solution
11.3 For the soil profile and loading conditions described in Problem 11.1, how long will it
take for the excess pore pressure to reach one half the initial excess pore pressure. Will
the average degree of consolidation for the entire clay layer be less than, equal to, or
greater than 50% at this time? Explain.
Solution
At a point 2.7 m above the bottom of the stratum
From Figure 11.4, with %50=
Δz
e
u
σ
and 0.45 =
dr
dr
H
z
Chap. 11 Rate of Consolidation 11-3
11.4 Repeat Problem 11.1 but assume the clay stratum is drained only at the top. Compare the
pore pressures computed for this case of single drainage with the pore pressures
computed for the case of double drainage in Problem 11.1.
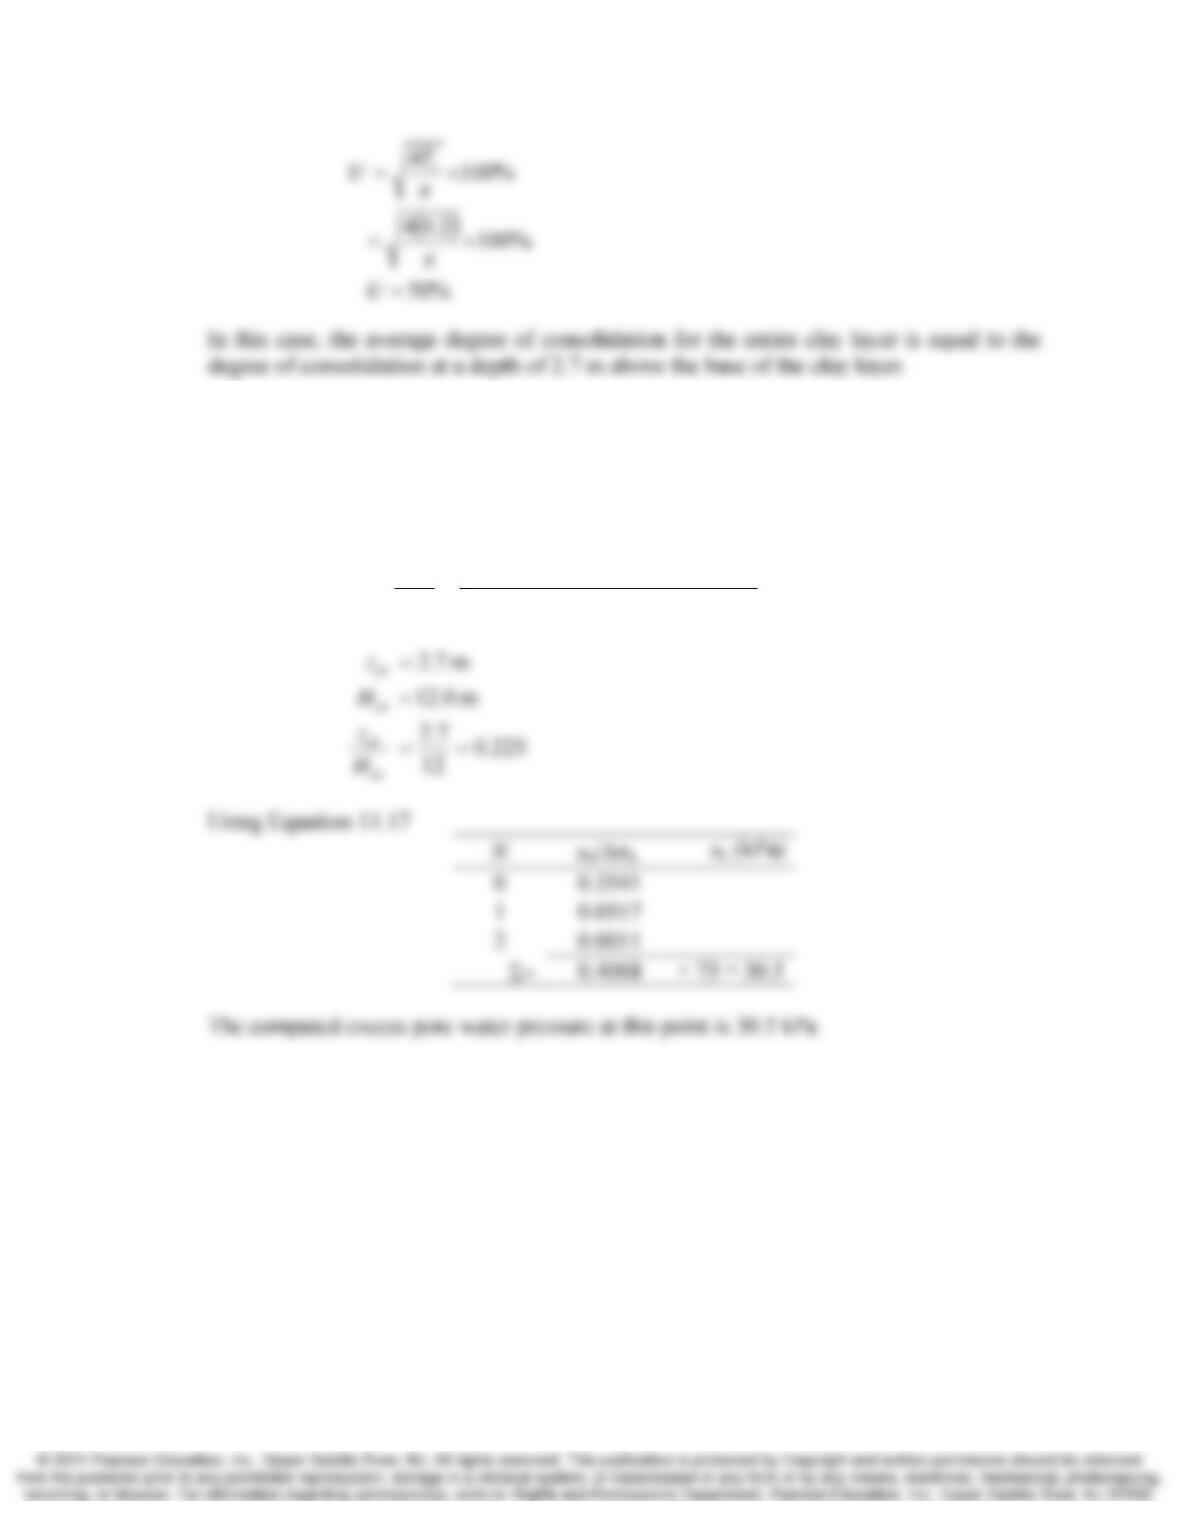
Solution
()
(
)
(
)
()
0.0887
m 12.0
d/yr 365yr 10/dm103.5
2
23
2=
×
==
−
dr
v
vH
tc
T
11-4 Rate of Consolidation Chap. 11
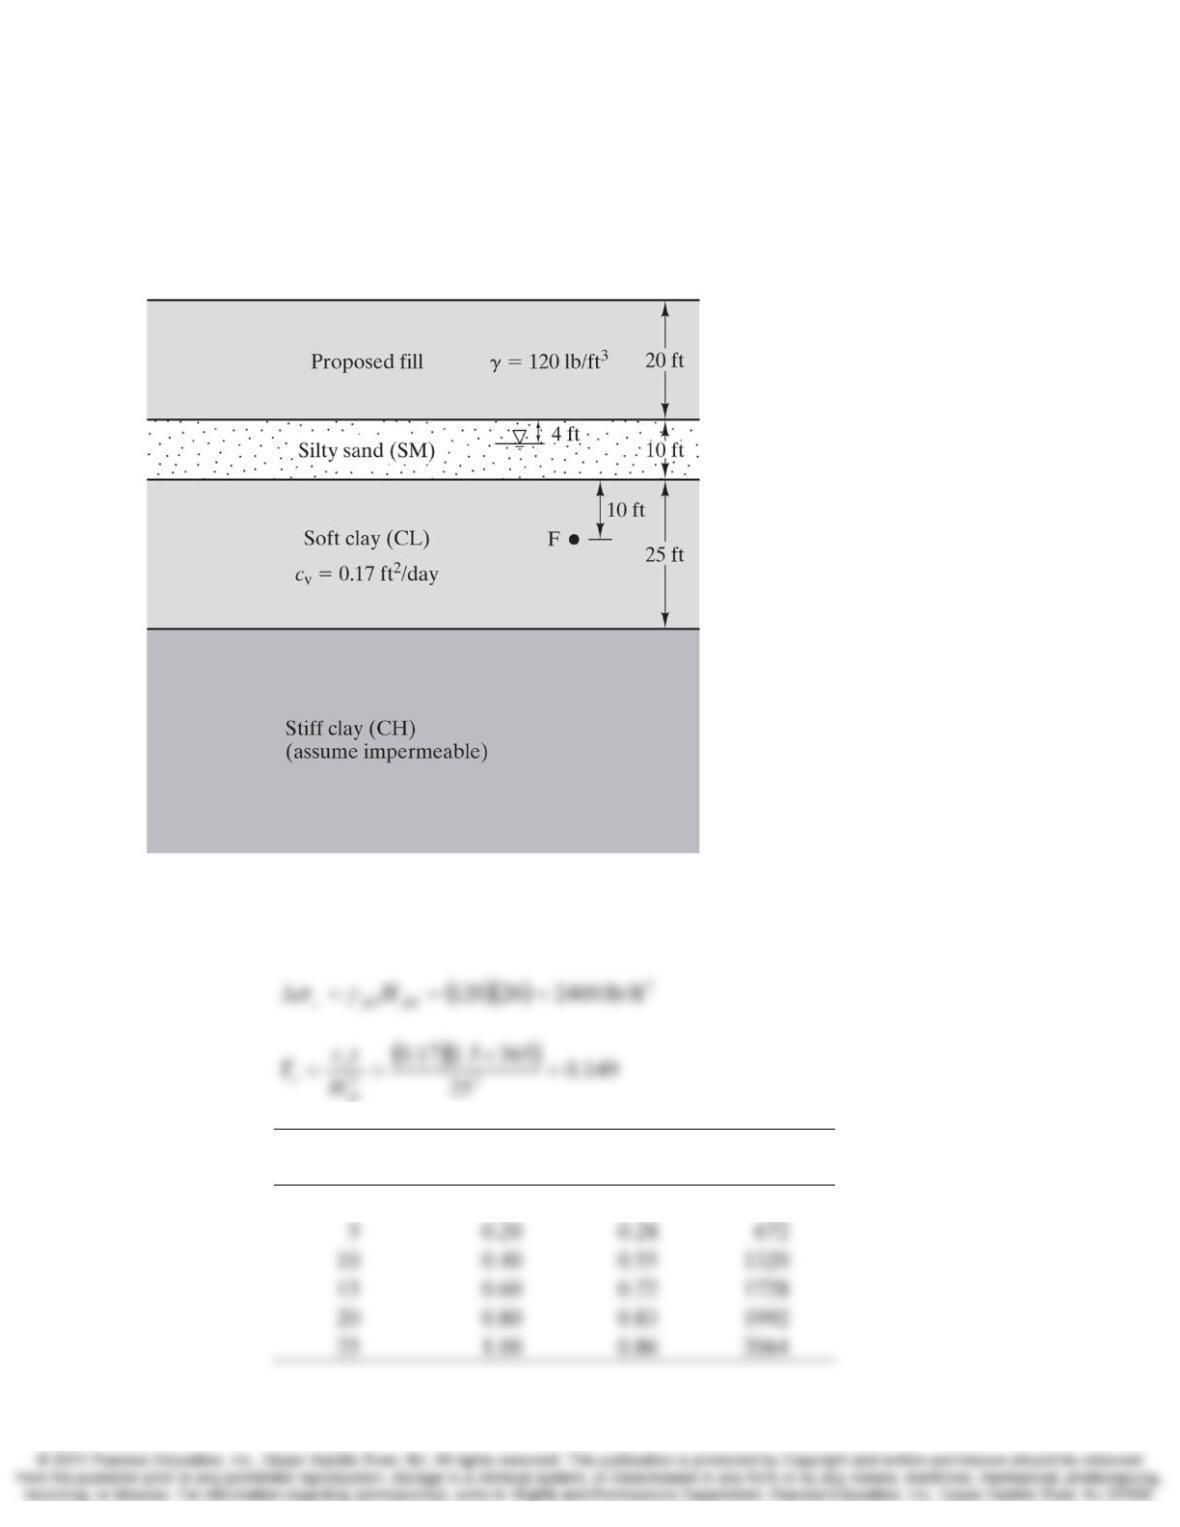
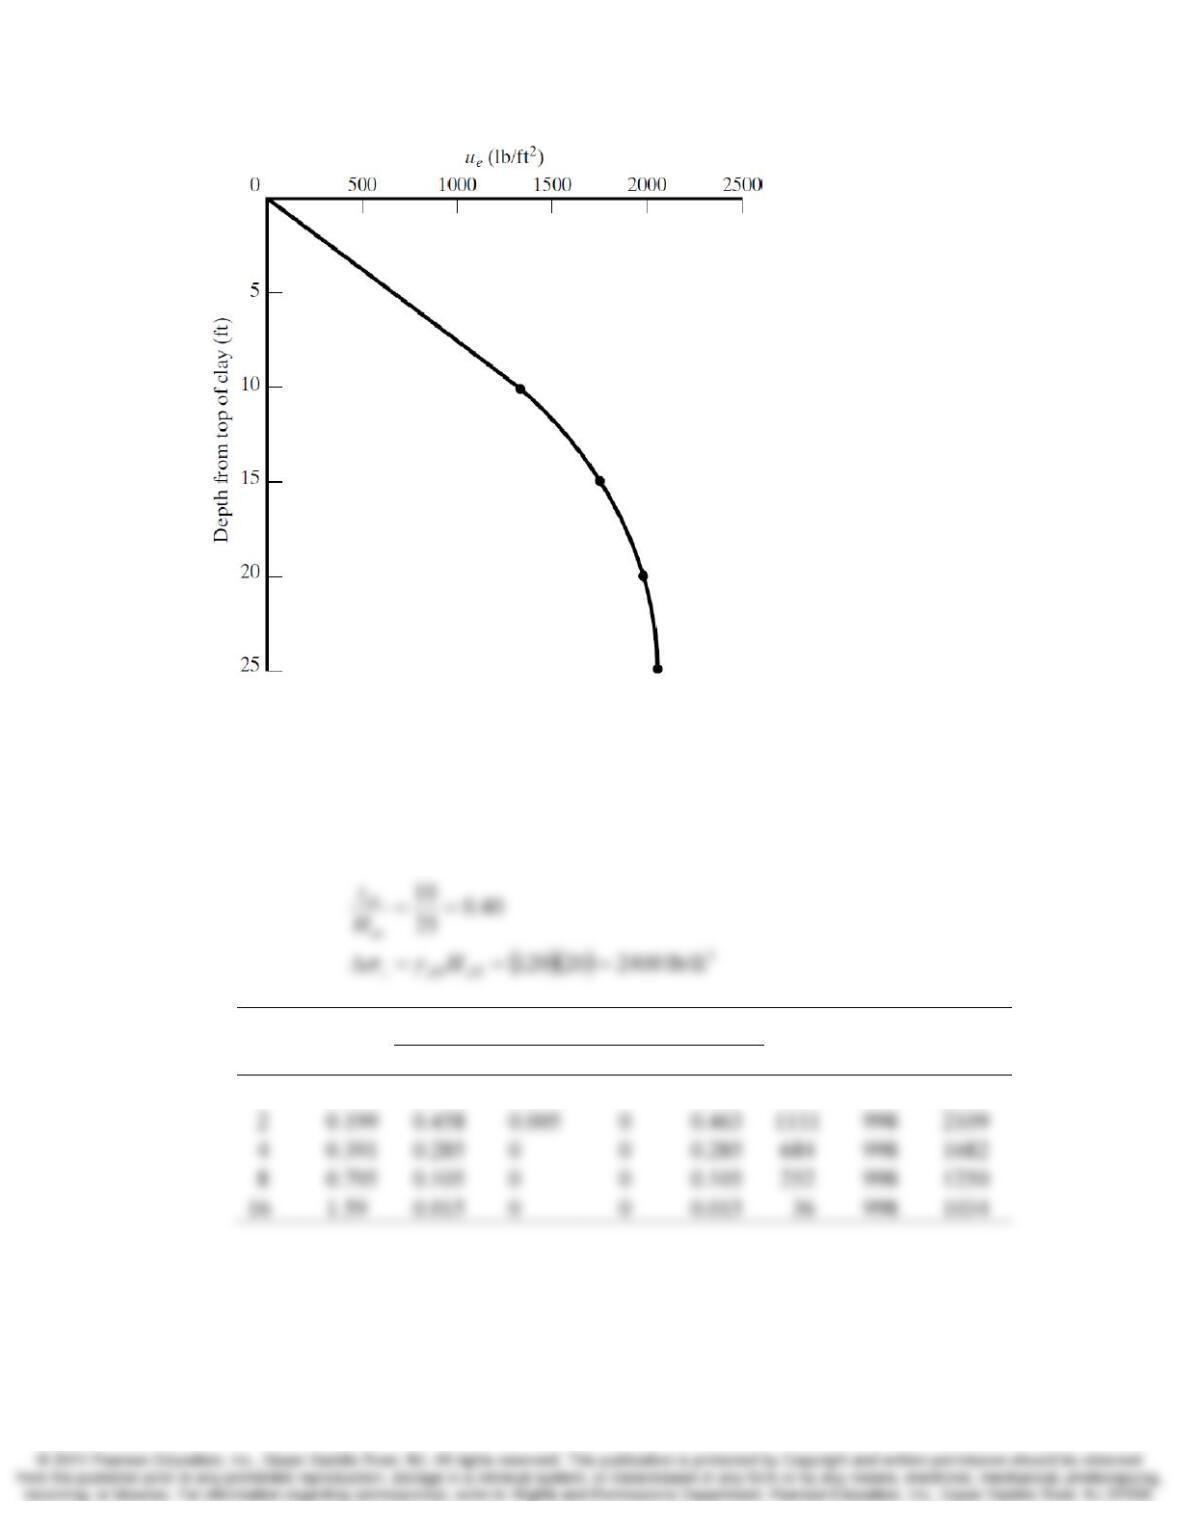
11.5 A 20-ft thick fill with a unit weight of 120lb/ft3 is to be placed on the soil profile shown
in Figure 11.29. Assuming the fill is placed instantaneously, use the curves in Figure 11.4
to develop a plot of ue versus depth at t=1.5 years. Plot depth on the vertical axis,
increasing downward, and consider depths from the original ground surface to the bottom
of the CL stratum.
Figure 11.29 Soil profile for Problems 11.5–11.7 and 11.10.
Solution
Depth From
Top of Clay (ft) zd
r
/Hd
r
ue/
Δ
σz
Figure 12.4 ue (lb/ft2)
0 0.00 0 0
Chap. 11 Rate of Consolidation 11-5
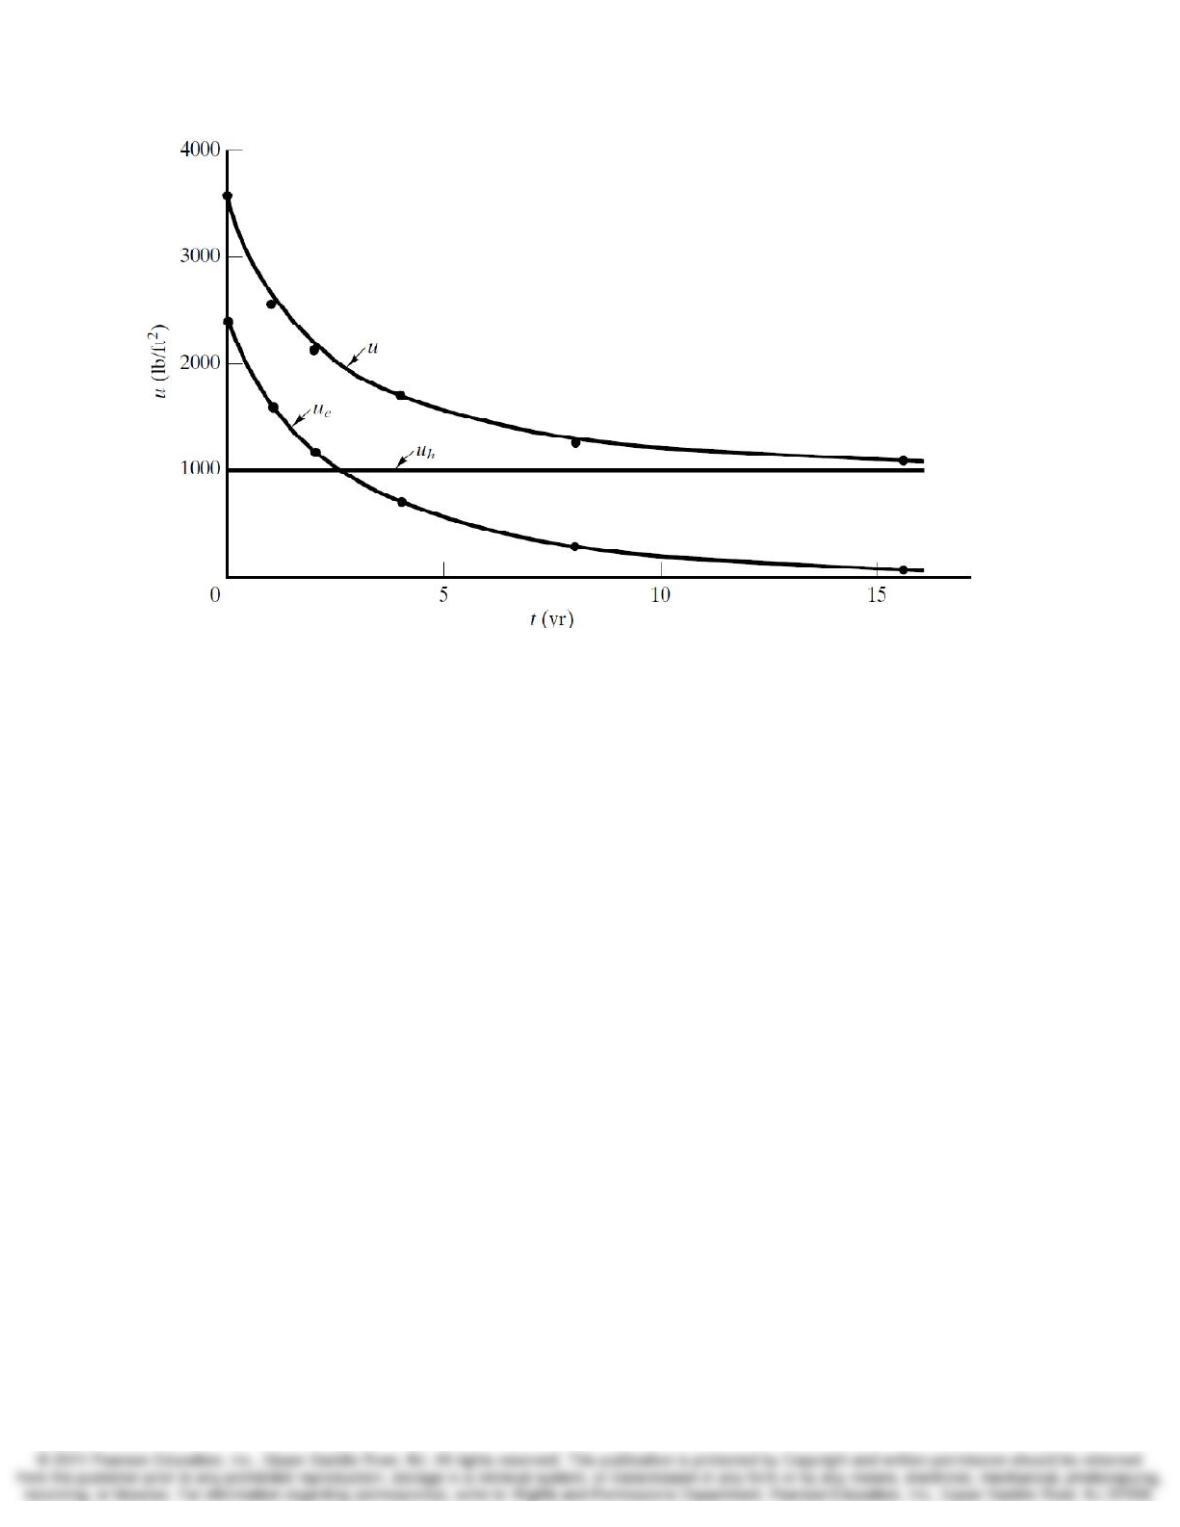
11.6 Use equation 11.17 to compute the hydrostatic, excess, and total pore water pressures at
Point F in Figure 11.29 at t = 1, 2, 4, 8, and 16 years after placement of the fill. Then use
this data to develop a plot of uh, ue, and u at this point versus time. All three curves
should be on the same diagram, with time on the horizontal axis.
Solution
t
(yrs) Tv
Σ From Equation 11.17 ue
(lb/ft2)
uh
(lb/ft2)
u
(lb/ft2)
N=0 N=1 N=2 Σ
1 0.099 0.586 0.045 0 0.631 1514 998 2512
11-6 Rate of Consolidation Chap. 11
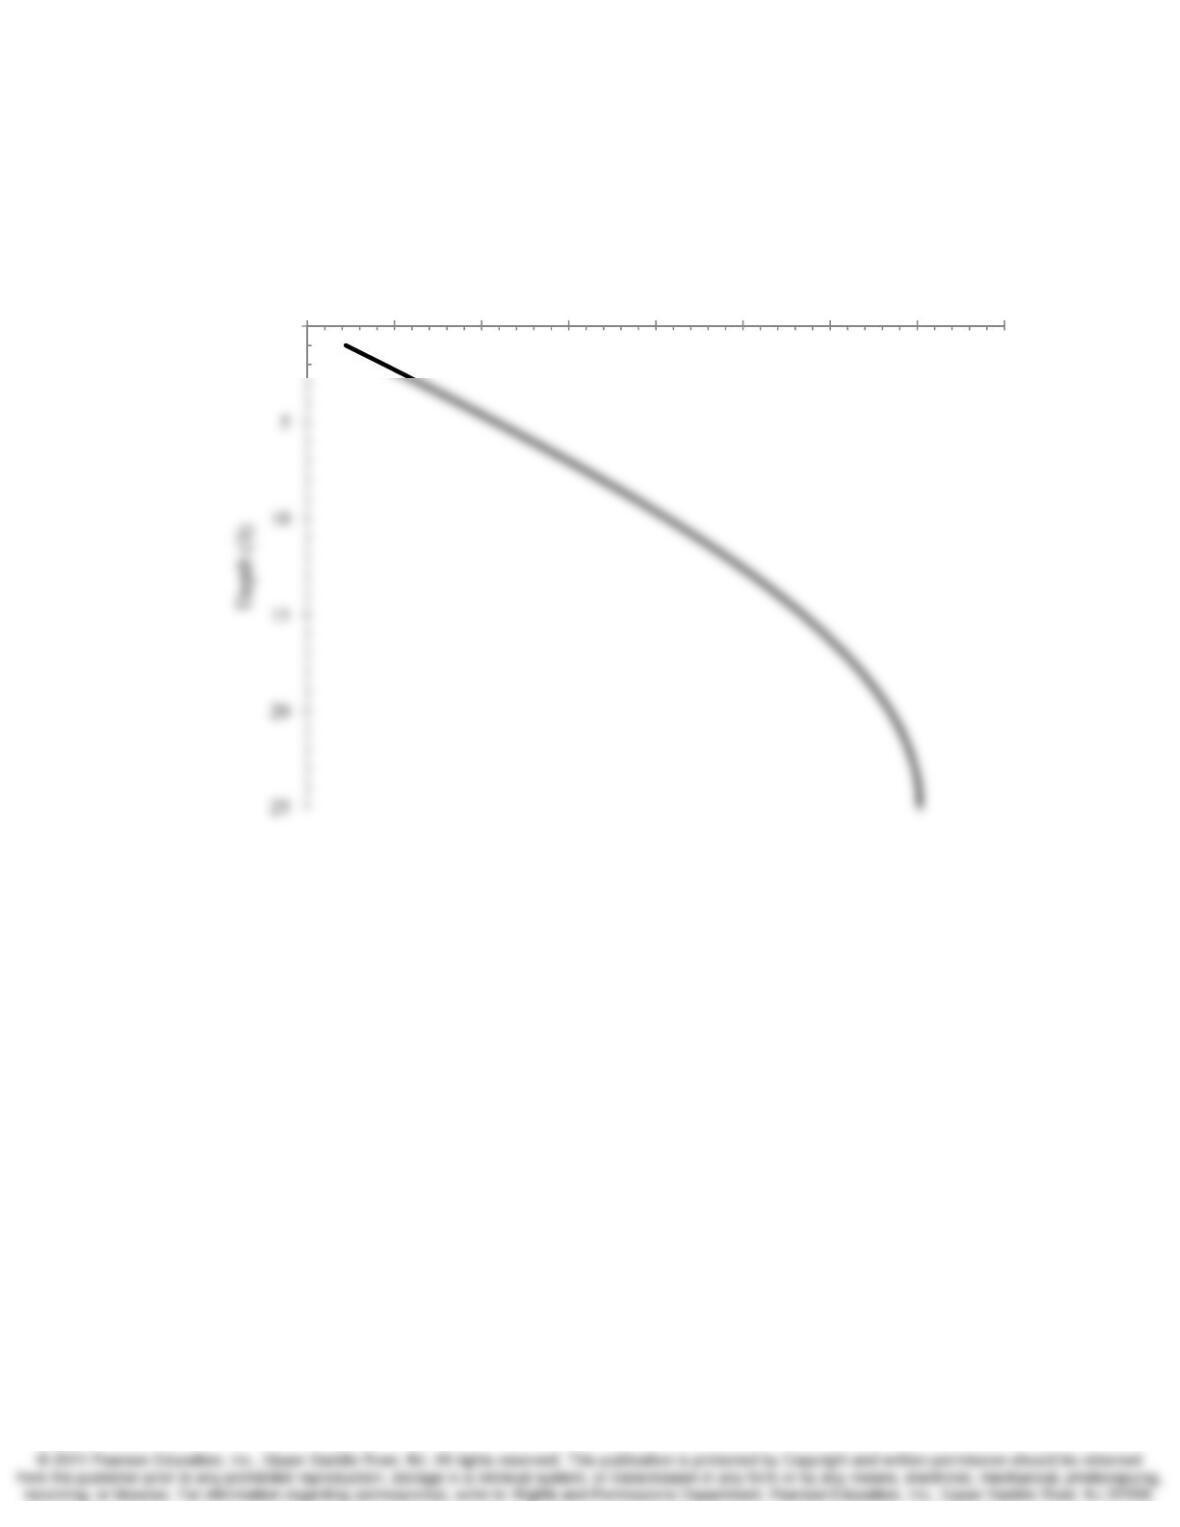
11.7 Using the soil profile in Figure 11.29, develop a spreadsheet that solves Equation 11.17 at
1.0 ft depth intervals through the entire soft clay stratum. Use summations for N. Then
use this spreadsheet to develop a curve of excess pore water pressure versus depth at t = 6
years after construction. Submit a printout of the spreadsheet, and a plot of the excess
pore water pressure curve.
Note for those who may wish to develop spreadsheet or other software for more
general solutions: the natural exponent term in Equation 11.17 may cause difficulties for
some programming languages when they attempt to take e to a large negative power.
However, these difficulties appear to occur only when N has risen to values beyond those
necessary for the summation. Therefore, avoid such difficulties by terminating the
summation whenever the exponent term generates an error, or when the increment of N
produces a negligible change in the summation.
Chap. 11 Rate of Consolidation 11-7
Solution
See the spreadsheet Problem_11-07.xlsx for one solution.
Section 11.2 Consolidation Settlement versus Time Computations
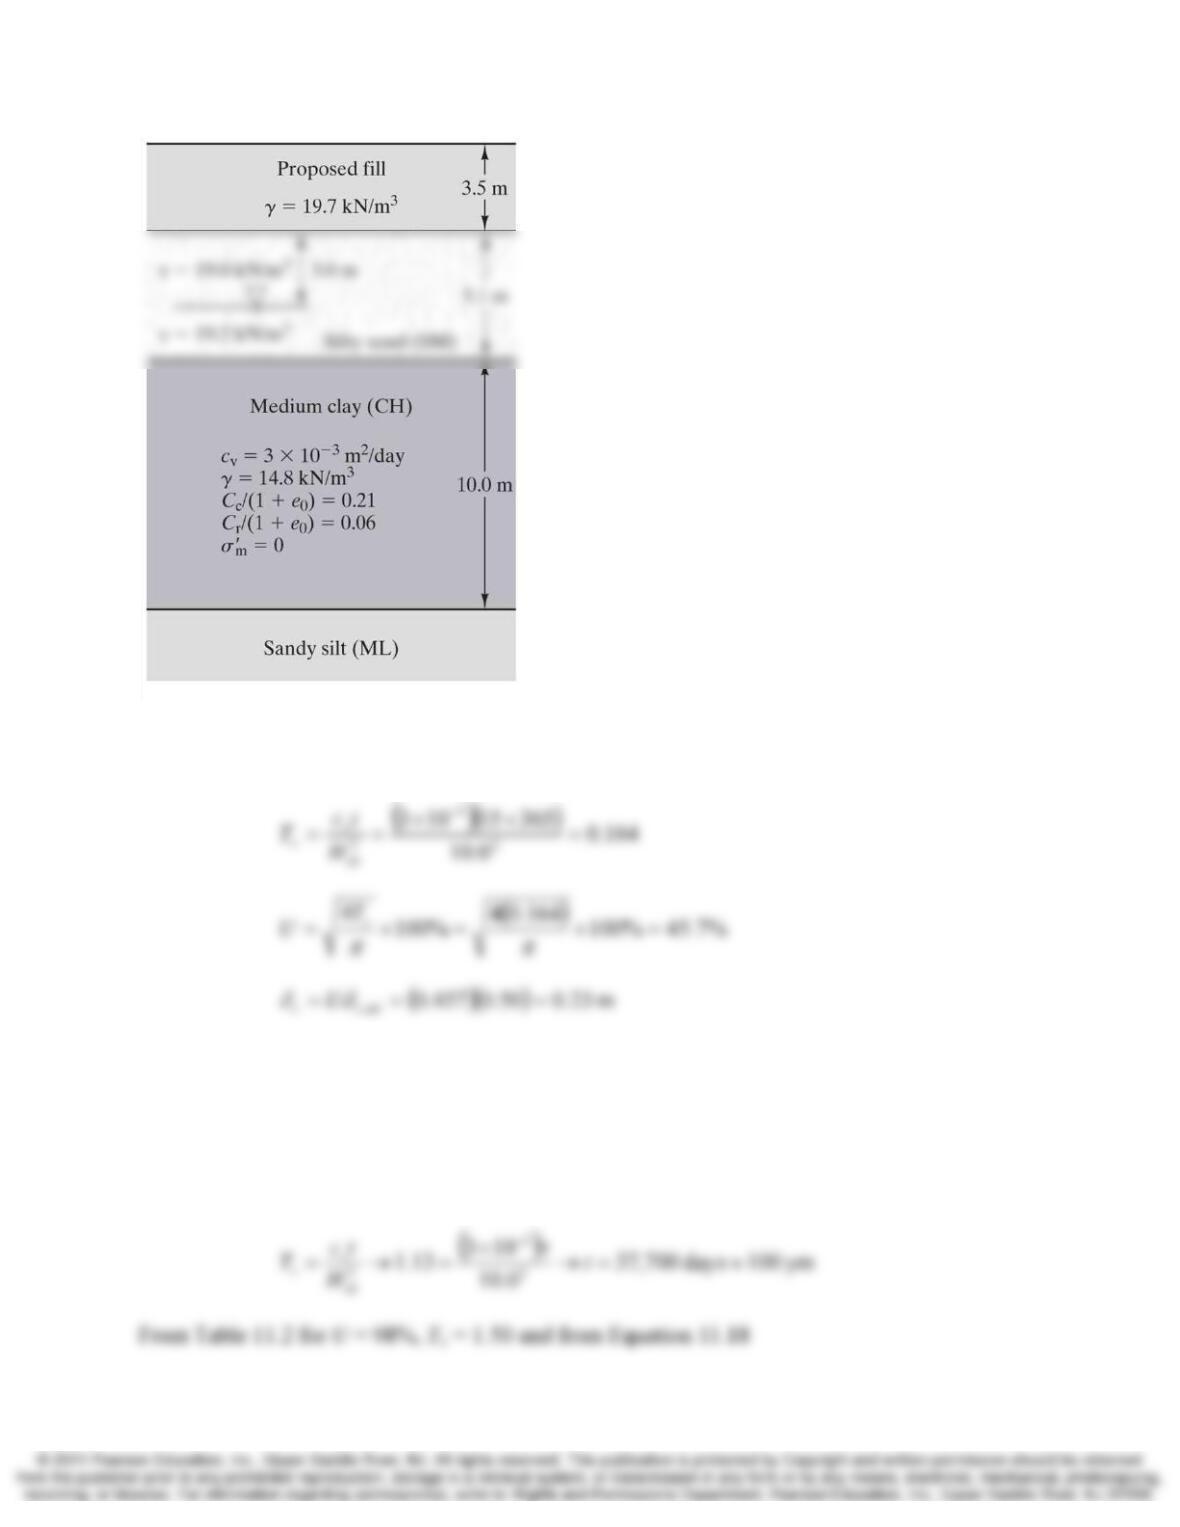
11.8 Consider the proposed fill and soil profile shown in Figure 11.5, except replace the sandy
silt strata with an impervious bedrock. Using the simplified solution, compute the
consolidation settlement at t = 15 years after placement of the fill. The ultimate
consolidation settlement is 0.50 m. Do not apply any correction for the construction
period.
0
0 100 200 300 400 500 600 700 800
ue(lb/ft2)
11-8 Rate of Consolidation Chap. 11
Figure 11.5 Soil profile
Solution
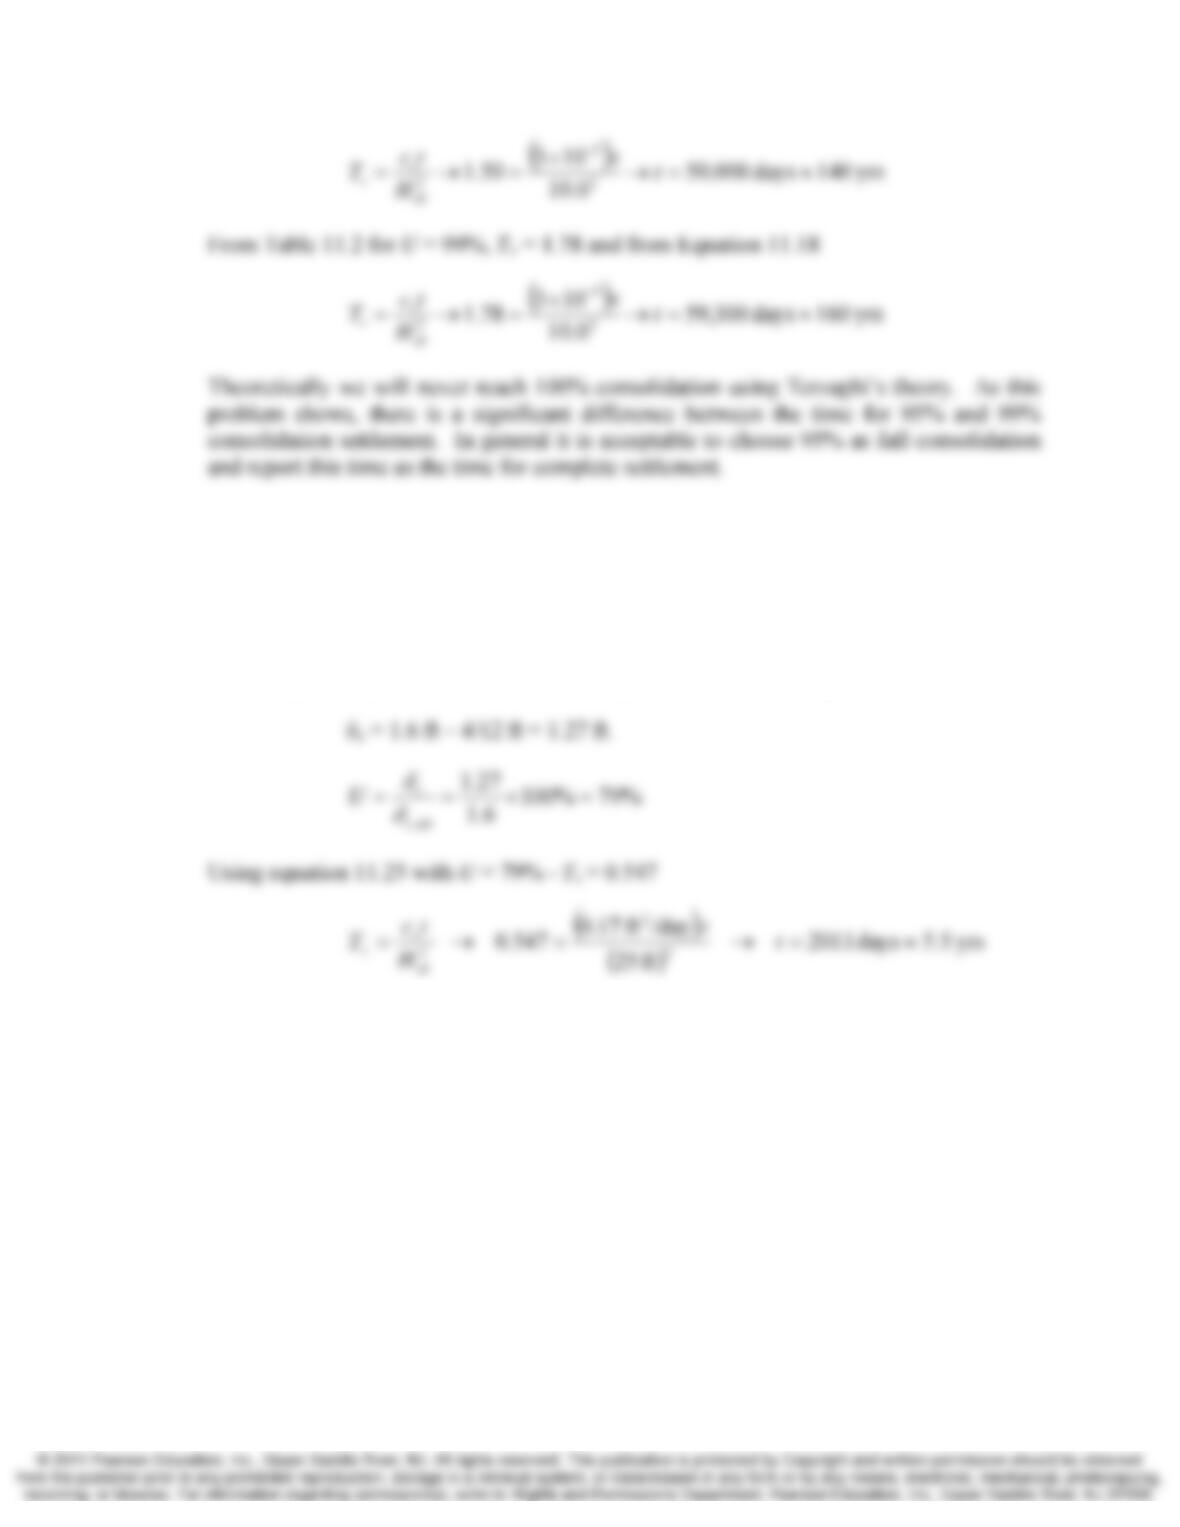
11.9 For the situation described in Problem 11.8, how long will it take to reach 95%, 98%, and
99% of the ultimate consolidation settlement? Use the simplified method. The owner has
asked you “How long will the settlement take?” How would you reply?
Solution
From Table 11.2 for U = 95%, Tv = 1.13 and from Equation 11.18
Chap. 11 Rate of Consolidation 11-9
11.10 For the proposed fill shown in figure 11.29, assume the ultimate consolidation settlement
is 1.6 ft. The owner wants to build a structure on top of the fill. The structure can
withstand a total settlement of 4 in. How long must the owner wait after placement of the
fill before building the structure on top of the fill? Use the simplified method.
Solution
According to the problem statement, building construction may begin when
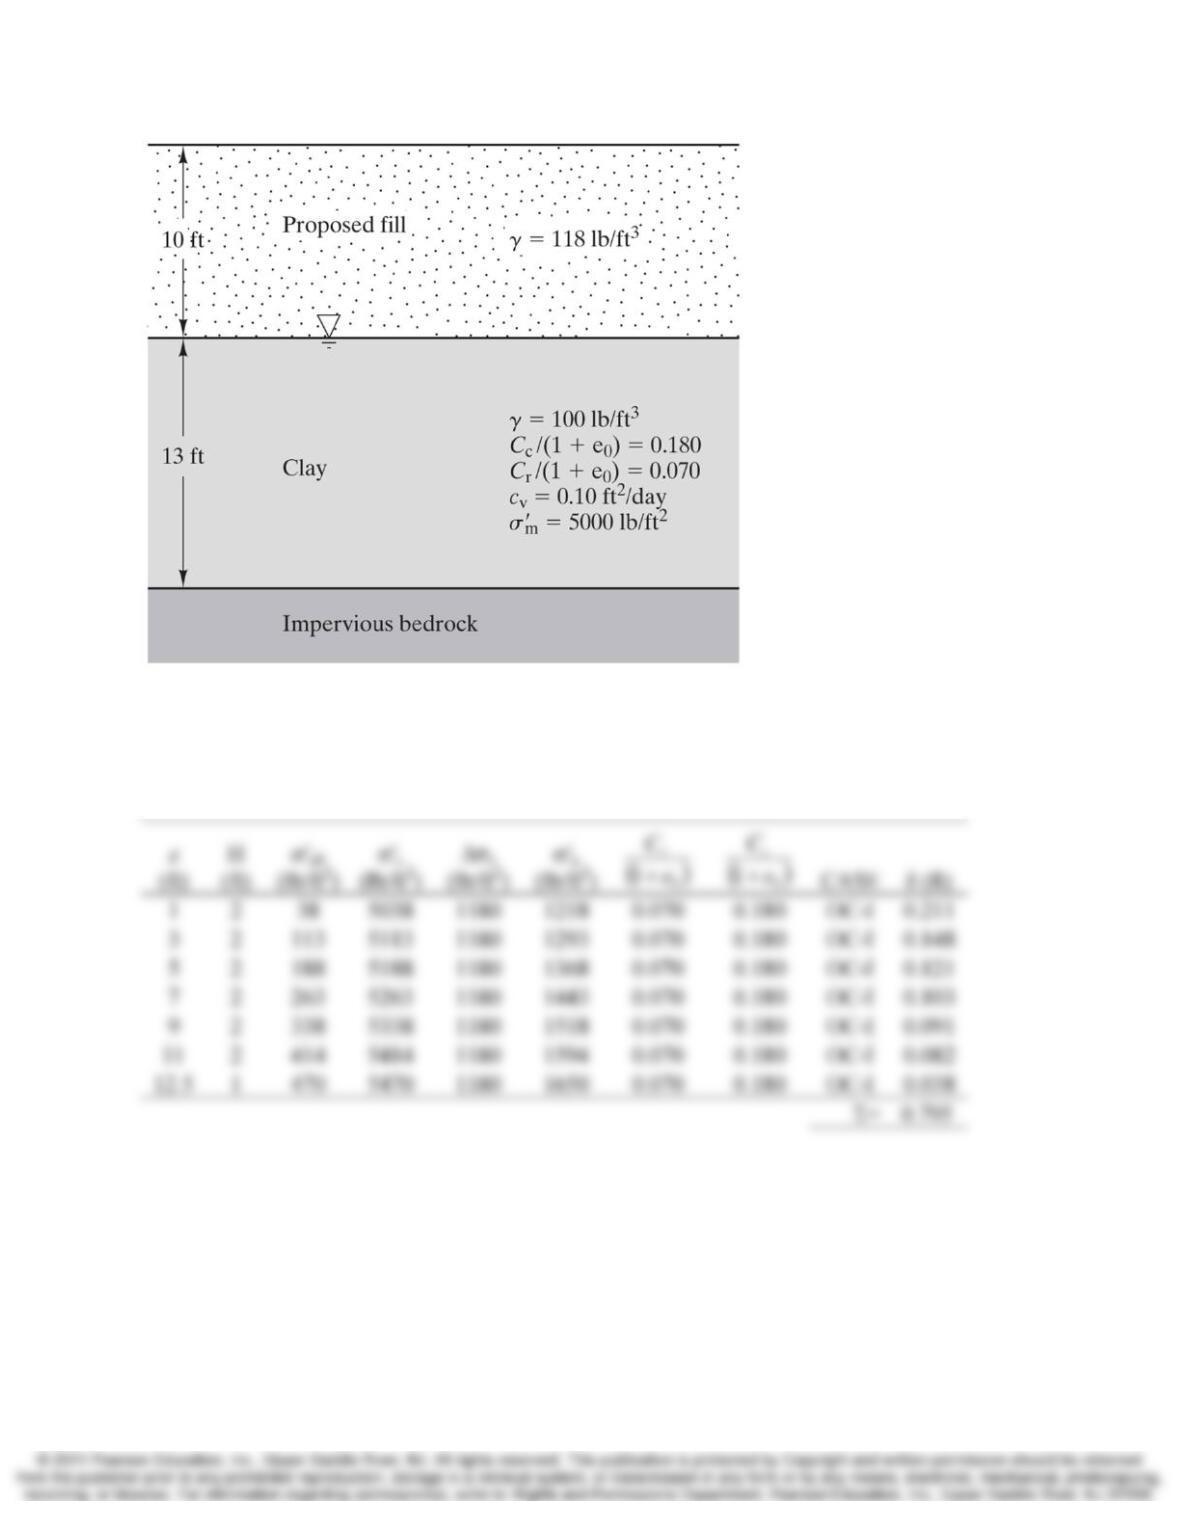
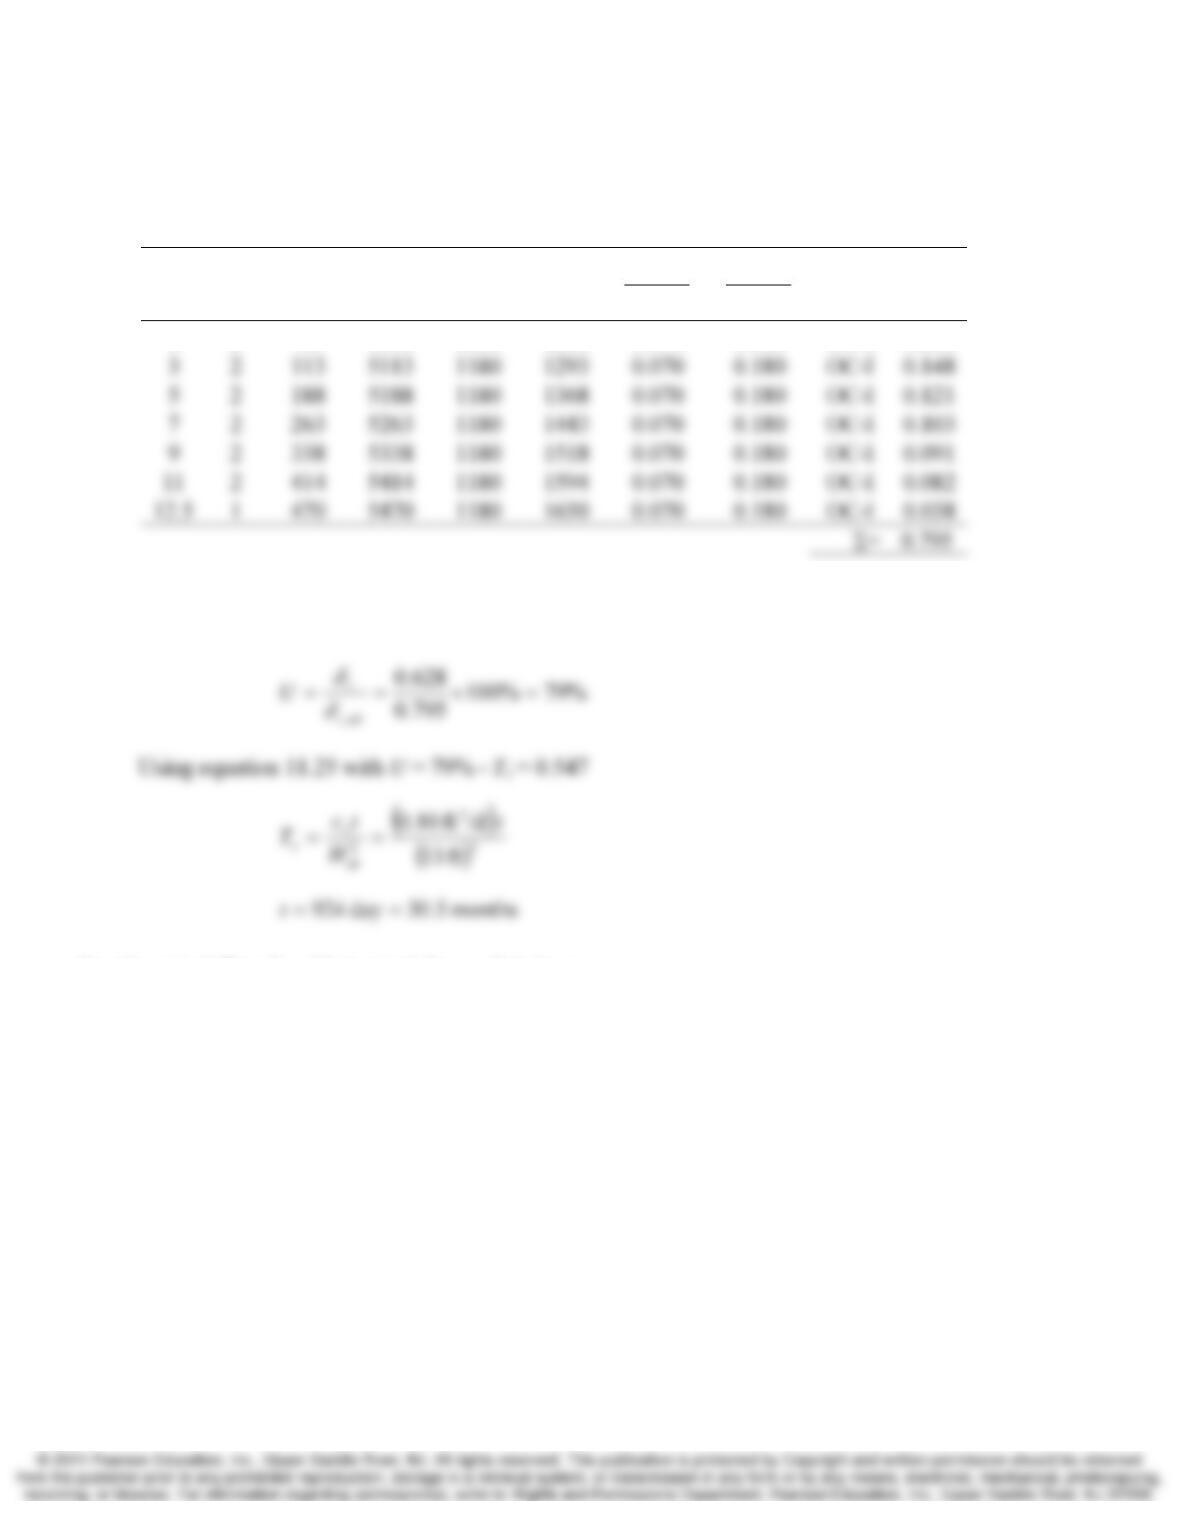
11.11 A fill is to be placed on the soil profile shown in Figure 11.30. The groundwater table is
level with the original ground surface. Use the simplified method to develop a plot of
consolidation settlement versus time. Continue the plot until U > 99%. Do not apply any
correction for the construction period.
Note: As consolidation settlement occurs, some of the fill will become submerged
beneath the groundwater table. The resulting buoyant force will reduce σ´zf and thus
reduce the consolidation settlement. However, this effect is small for this problem and
may be ignored.
11-10 Rate of Consolidation Chap. 11
Figure 11.30 Soil profile for Problems 11.11 and 11.12.
Solution
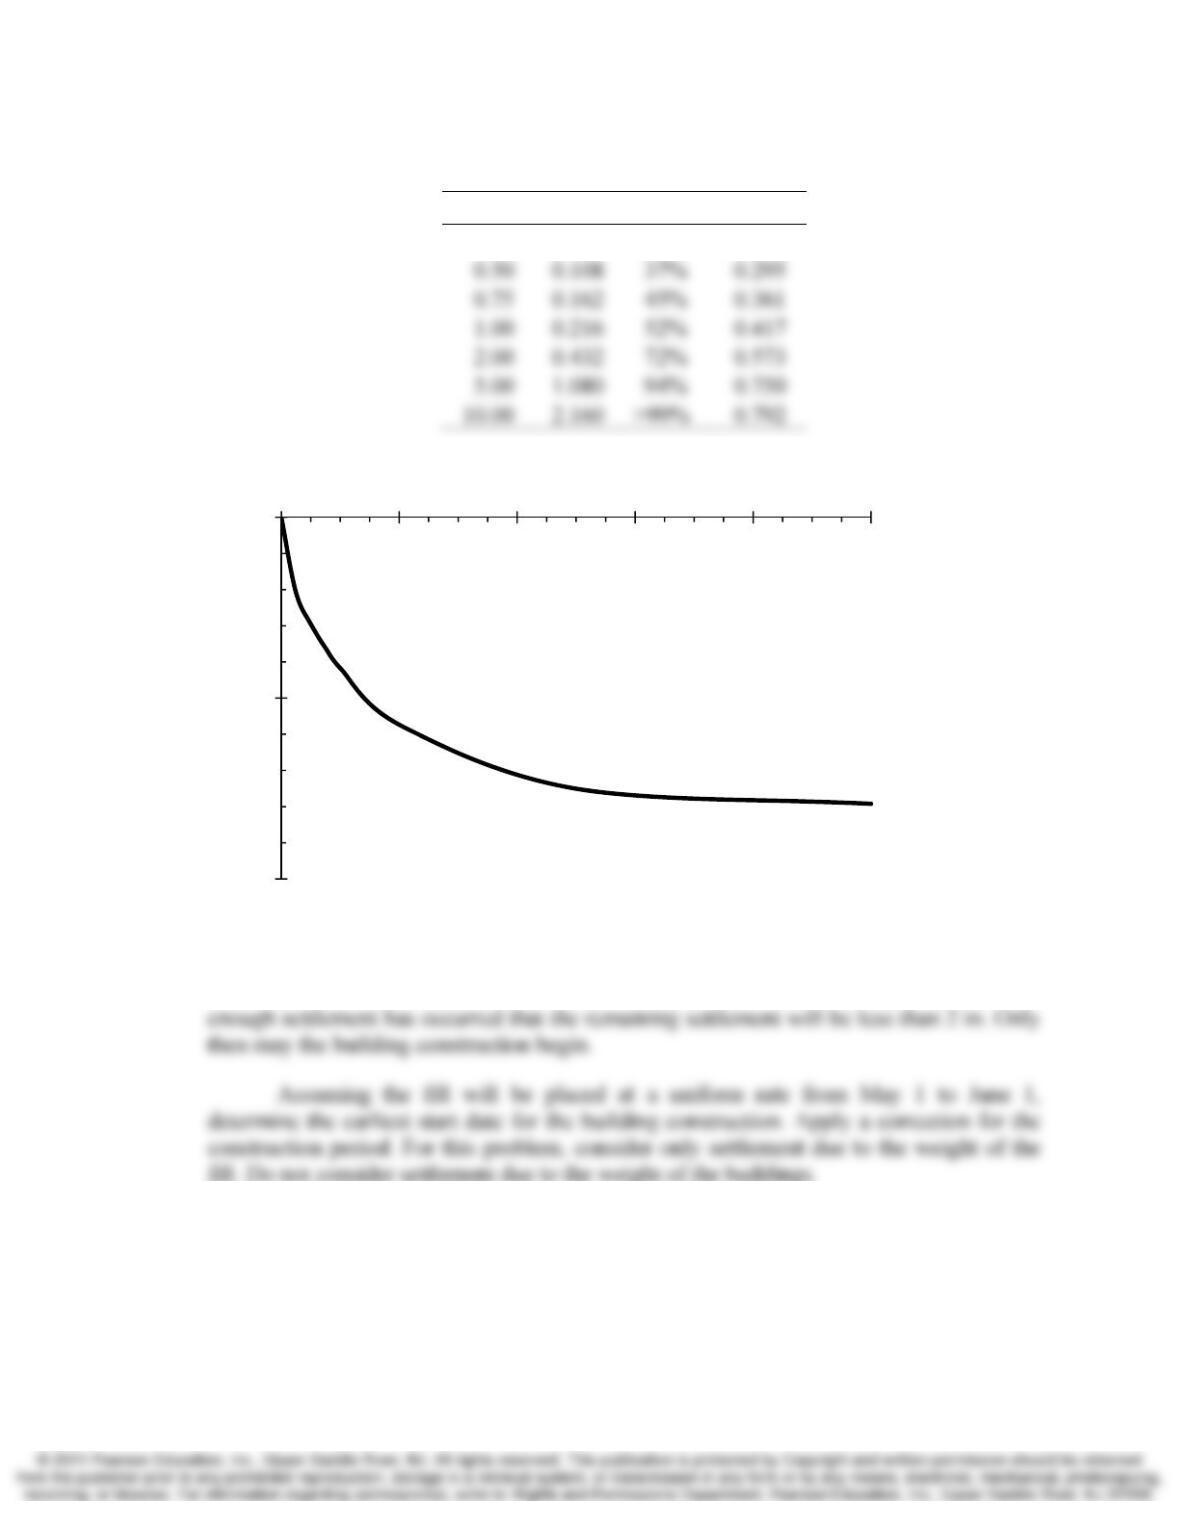
Calculate ultimate consolidation using Equation 11.22
Chap. 11 Rate of Consolidation 11-11
Calculate consolidation settlement using the simplified method
t (yrs) T
v U δc (ft)
0.25 0.054 26% 0.209
11.12 A shopping center is to be built on the fill described in Problem 11.11. The proposed
buildings and other facilities can tolerate a settlement due to the weight of the fill of no
more than 2 in. Therefore, once the fill has been placed, it will be necessary to wait until
0.00
0.50
1.00
0246810
11-12 Rate of Consolidation Chap. 11
Solution
Calculate ultimate consolidation using Equation 11.22
z
(ft)
H
(ft)
σ‘z0
(lb/ft2)
σ‘c
(lb/ft2)
Δσz
(lb/ft2)
σ‘z
(lb/ft2)
()
0
1e
Cr
+
()
0
1e
Cc
+
CASE δ (ft)
1 2 38 5038 1180 1218 0.070 0.180 OC-I 0.211
Per settlement analyses, δc,ult = 0.795 ft. According to the problem statement, building
construction may begin when δc = 0.795 – 2/12 = 0.628 ft.
Section 11.3 The Coefficient of Consolidation
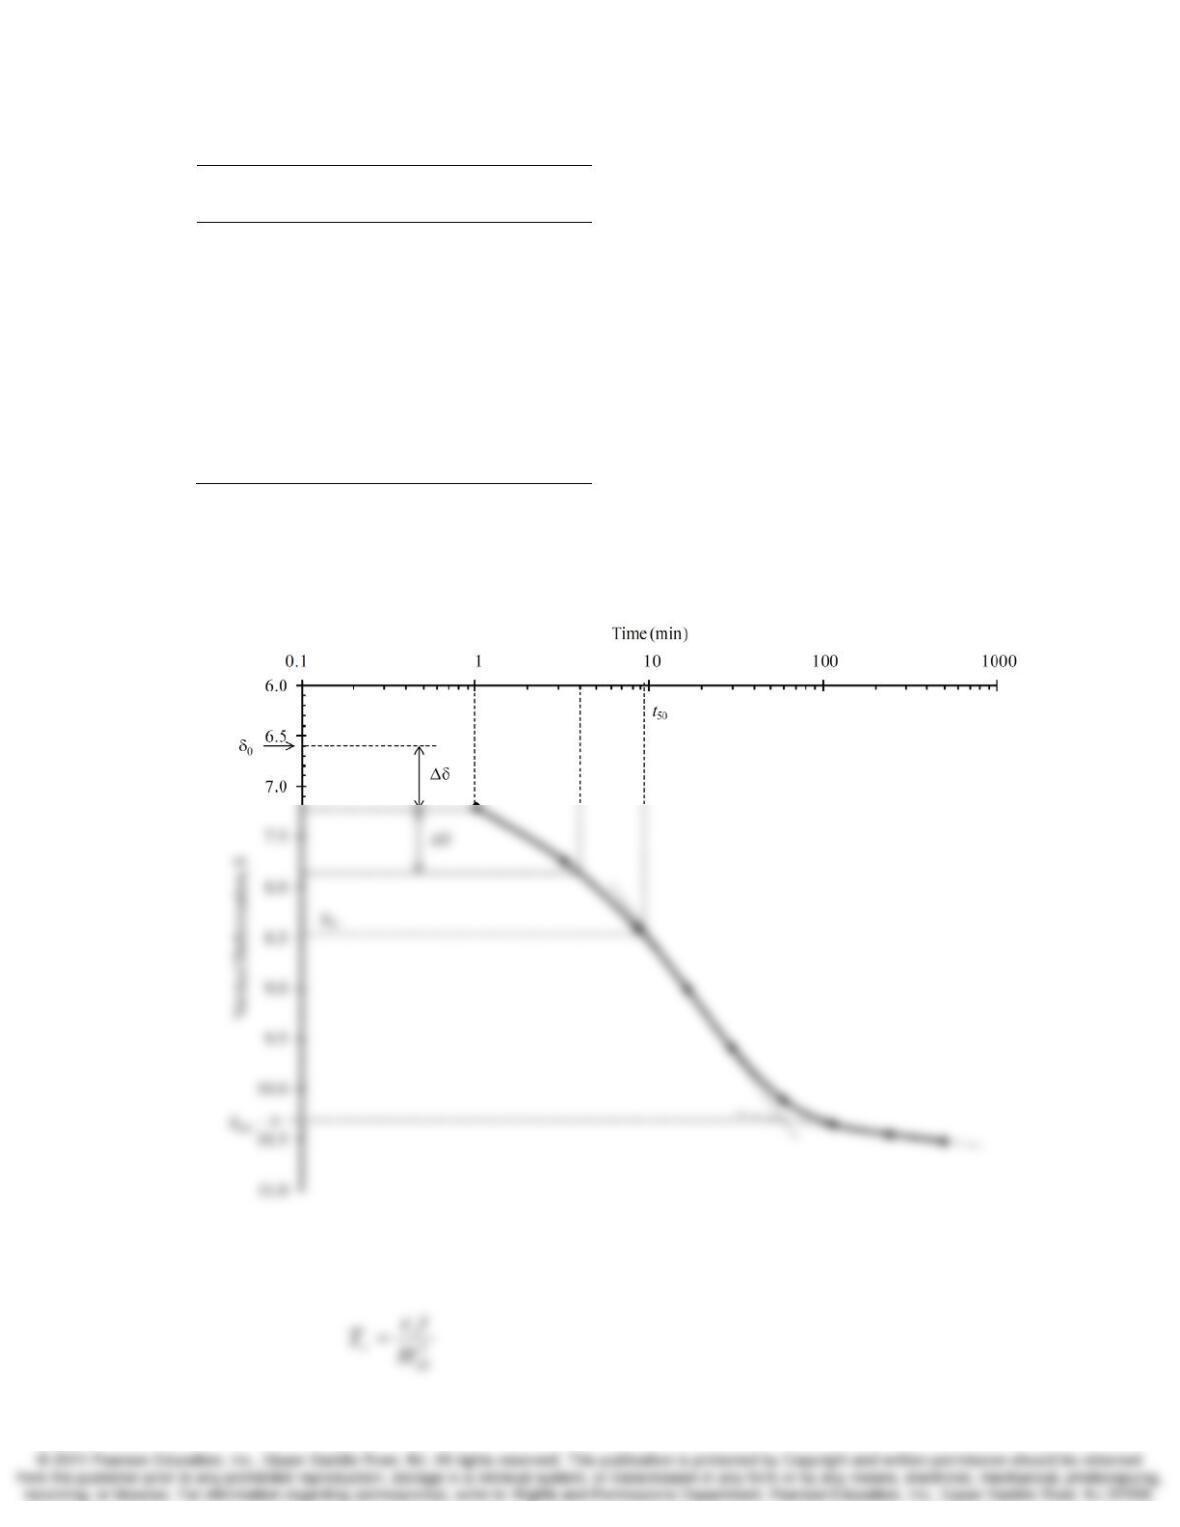
11.13 The data shown in the table below were obtained from a laboratory consolidation test on
a normally consolidated undisturbed MH soil with a liquid limit of 65. The sample was
62 mm in diameter, 25 mm tall and was tested under a double drainage condition.
Compute cv using the log-time fitting method. Then, compare your result with a typical
value of cv for this soil and determine if your value seems reasonable.
Chap. 11 Rate of Consolidation 11-13
Time Since Loading
(HH:MM:SS)
Dial Reading
(mm)
00:01:01 7.21
00:03:16 7.74
00:08:35 8.40
00:16:39 9.01
00:30:15 9.60
00:59:17 10.11
01:54:29 10.35
04:02:30 10.45
08:20:00 10.52
Solution
According to the plot, t50 = 9 min = 0.00625 day
11-14 Rate of Consolidation Chap. 11
65.
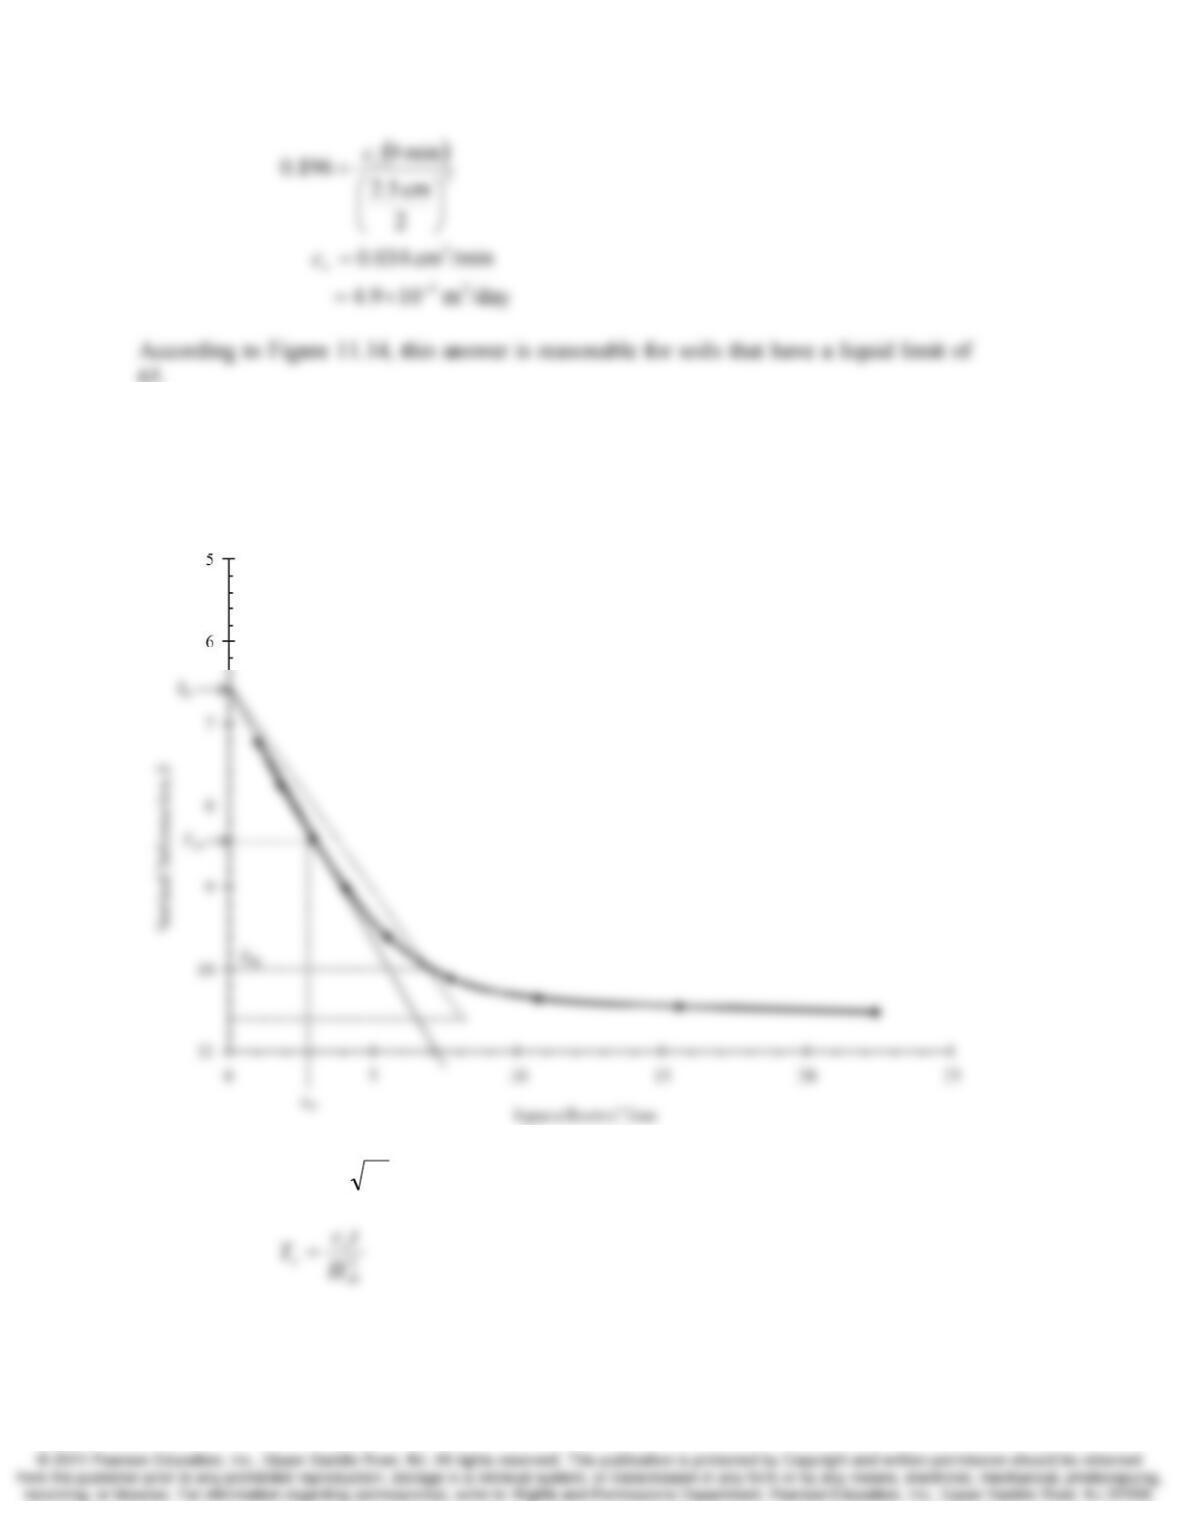
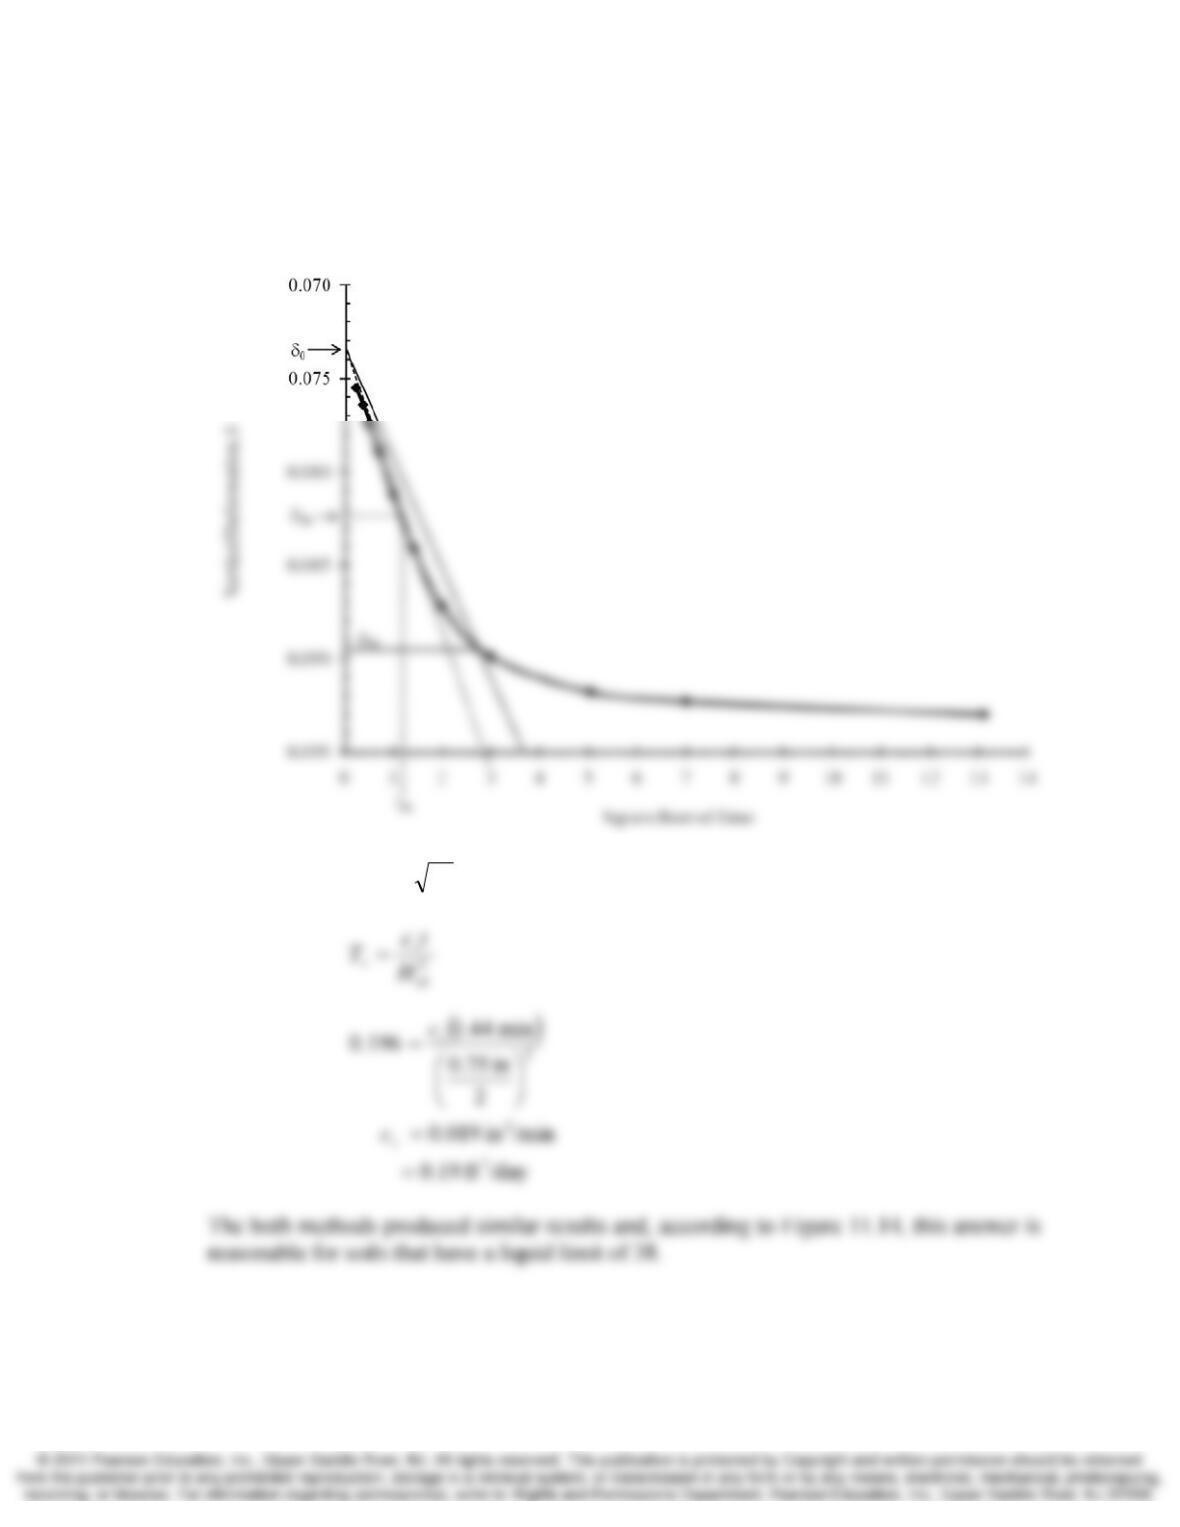
11.14 Repeat Problem 11.13 using the square root of time fitting method. Compare the results
to those found using log-time method.
Solution
According to the plot, min 84.78.2 5050 =→= tt
Chap. 11 Rate of Consolidation 11-15
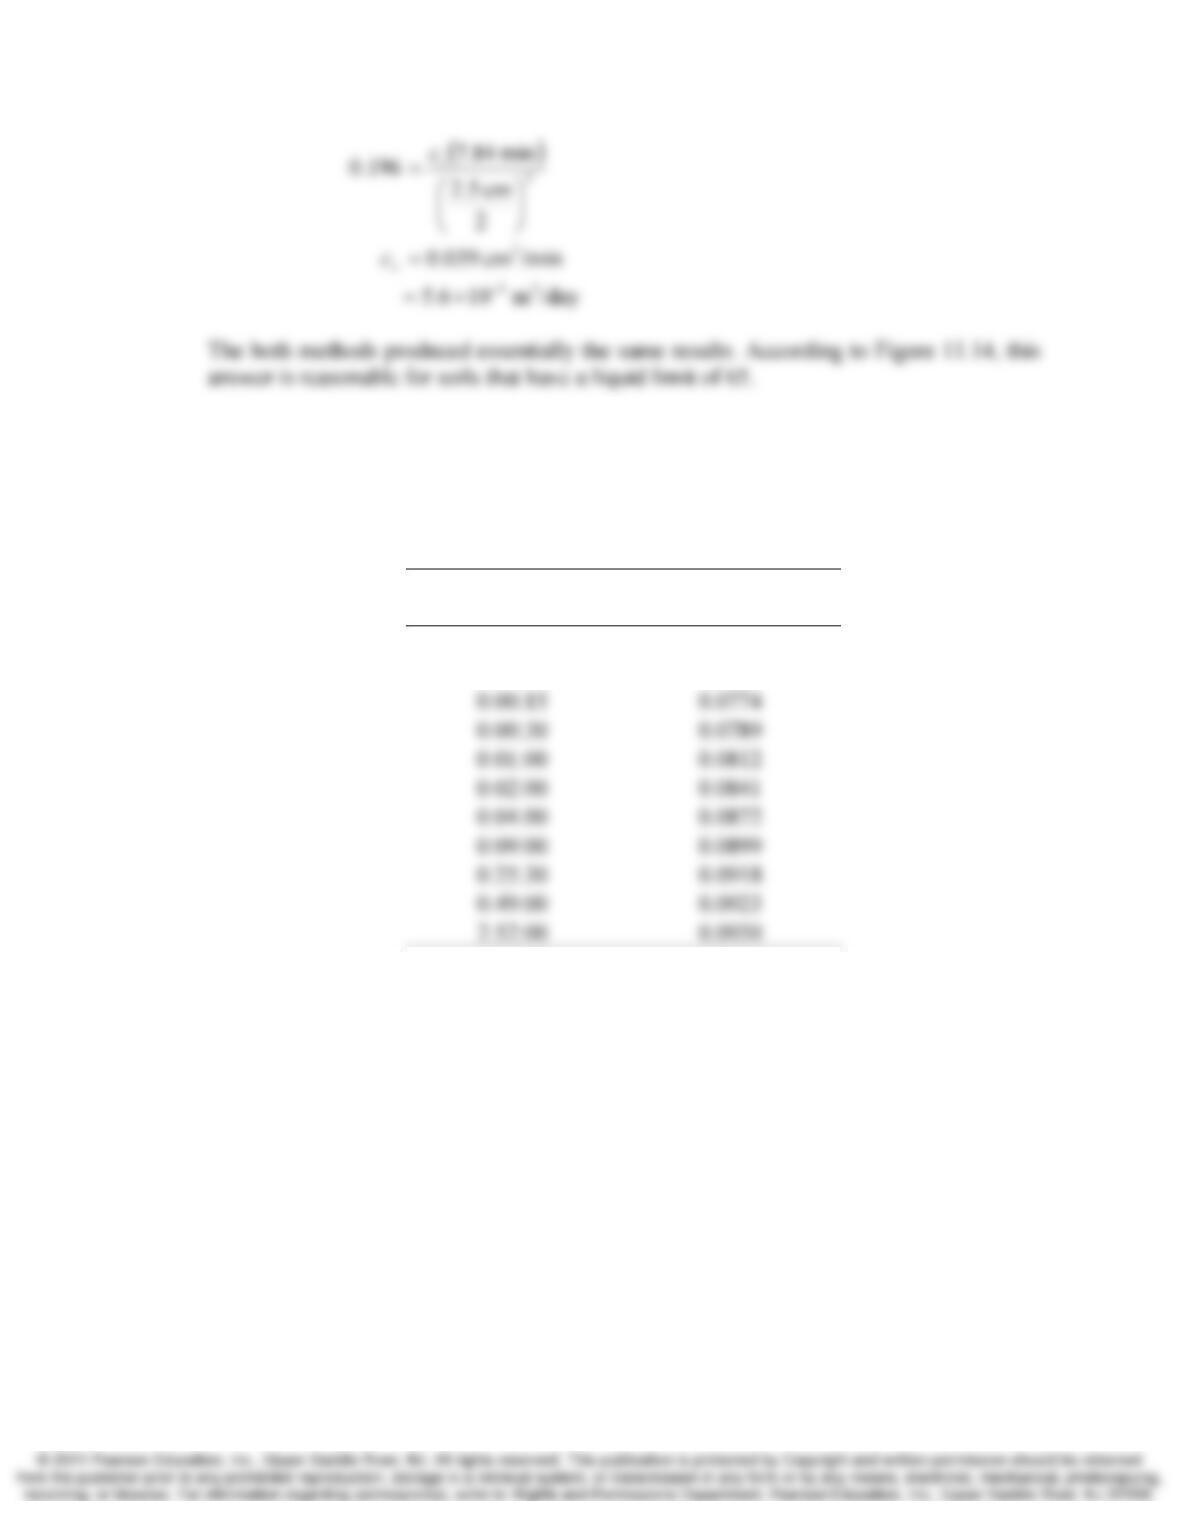
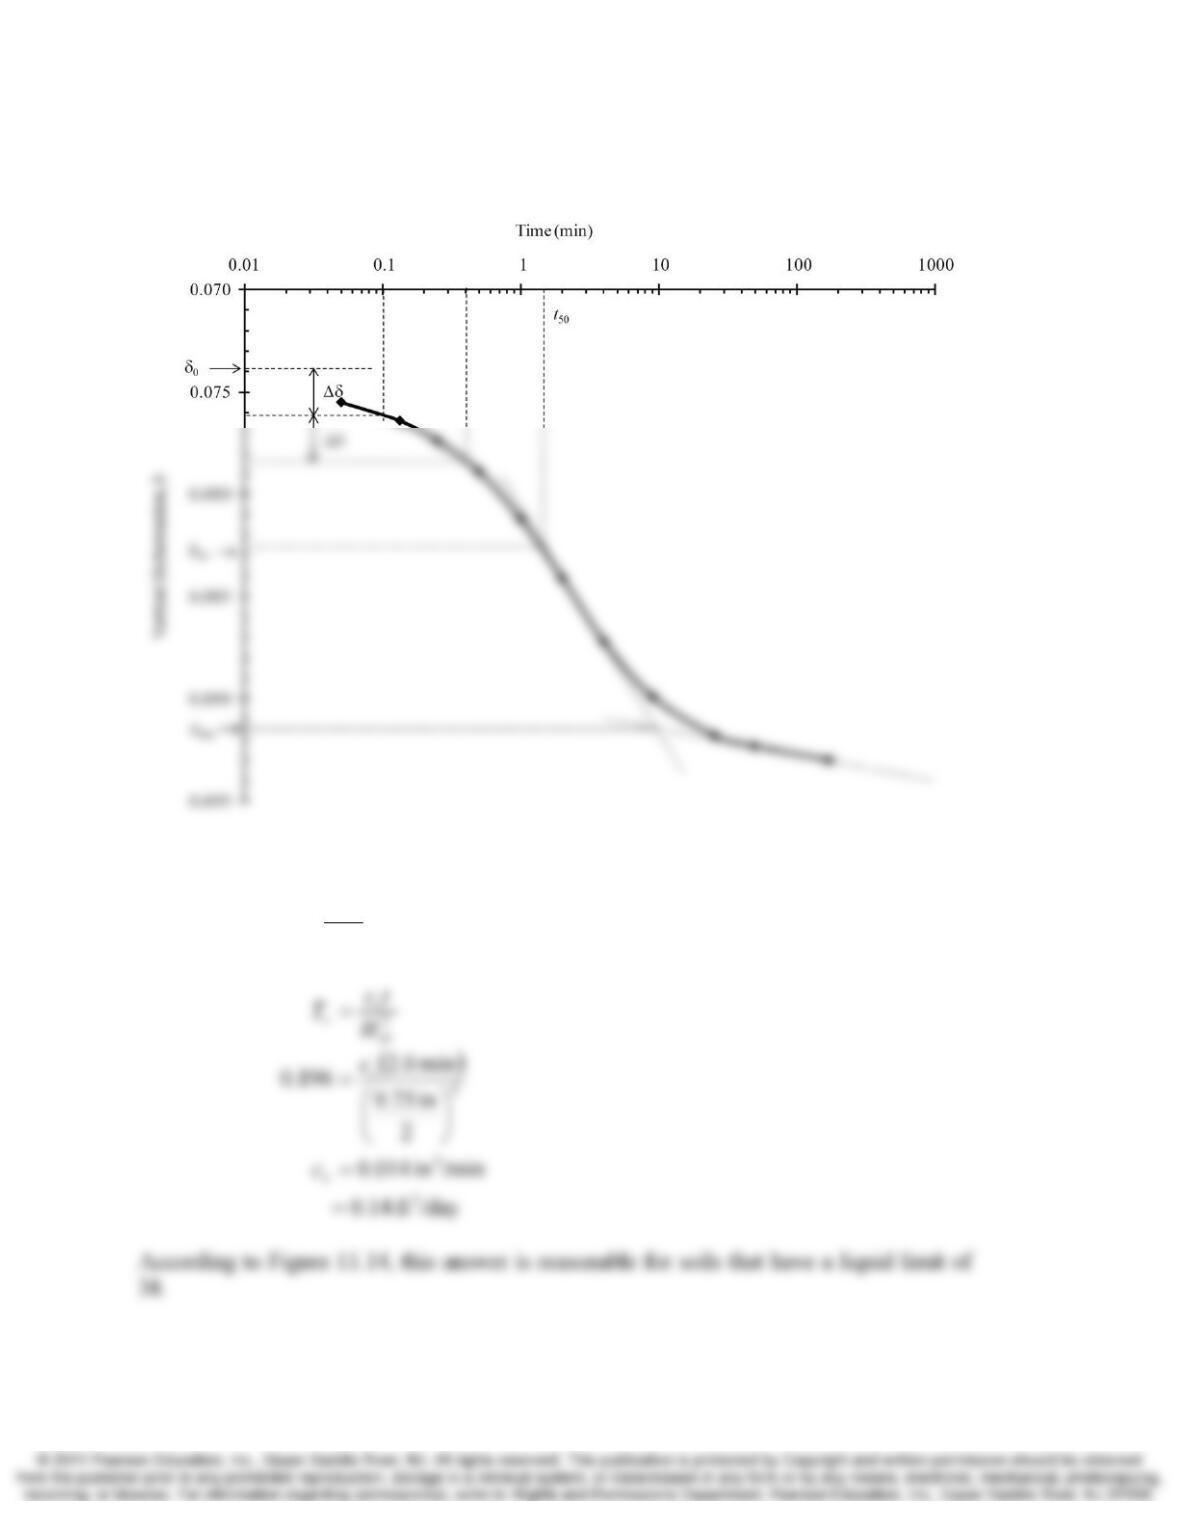
11.15 The data shown in the table below were obtained from a laboratory consolidation test on
a normally consolidation undisturbed CL soil with a liquid limit of 38. The sample was
2.50 in. in diameter, 0.75 in. tall and was tested under a double drainage condition.
Compute cv using the log-time fitting method. Then, compare your result with a typical
value of cv for this oil and determine if your value seems reasonable.
Time Since Loading
(HH:MM:SS)
Dial Reading
(inches)
0:00:03 0.0755
0:00:08 0.0764
11-16 Rate of Consolidation Chap. 11
Solution
According to the plot, t50 = 2.0 min
2
dr
v
vH
tc
T=
Chap. 11 Rate of Consolidation 11-17
11.16 Repeat Problem 11.15 using the square root of time fitting method. Compare the results
to those found using log-time method.
Solution
According to the plot min 44.12.1 5050 =→= tt
Section 11.5 Consolidation Monitoring
11.17 A proposed fill is to be placed on the soil profile shown in Figure 11.31.