Chapter 11. Liquids and Intermolecular Forces
Media Resources
Figures and Tables in Transparency Pack: Section:
Figure 11.2 Gases, Liquids, and Solids 11.1 A Molecular Comparison of Gases, Liquids,
Intermolecular Forces
Figure 11.20 Phase Changes and the Names 11.4 Phase Changes
Associated with Them
Figure 11.22 Heating Curve for Water 11.4 Phase Changes
Figure 11.25 Vapor Pressure for Four Liquids as a 11.5 Vapor Pressure
Function of Temperature
Figure 11.27 Generic Phase Diagram for a Pure 11.6 Phase Diagrams
Activities: Section:
Phases of Matter 11.1 A Molecular Comparison of Gases, Liquids,
and Solids
Hydrogen Bonding in Water 11.2 Intermolecular Forces
Intermolecular Forces 11.2 Intermolecular Forces
Animations: Section:
Hydrogen Bonding 11.2 Intermolecular Forces
Movies: Section:
Physical Properties of the Halogens 11.1 A Molecular Comparison of Gases, Liquids,
Liquids and Intermolecular Forces
147
and Solids
3-D Models: Section:
Chlorine 11.1 A Molecular Comparison of Gases, Liquids,
and Solids
Bromine 11.1 A Molecular Comparison of Gases, Liquids,
and Solids
Iodine 11.1 A Molecular Comparison of Gases, Liquids,
and Solids
Ice 11.2 Intermolecular Forces
Water 11.2 Intermolecular Forces
Ammonia 11.2 Intermolecular Forces
Methane 11.2 Intermolecular Forces
Acetic Acid 11.2 Intermolecular Forces
1-Propanol 11.2 Intermolecular Forces
2-Propanol 11.2 Intermolecular Forces
Other Resources
Further Readings: Section:
Pictorial Analogies I: States of Matter 11.1 A Molecular Comparison of Gases, Liquids,
and Solids
Molecular Handshake: Recognition through Weak 11.2 Intermolecular Forces
Noncovalent Interactions
Put the Body to Them! 11.2 Intermolecular Forces
Students as Solids, Liquids, and Gases 11.2 Intermolecular Forces
Chapter 11
148
Liquid Crystal Inquiries: Add a New Phase to Your 11.7 Liquid Crystals
Curriculum
Liquid Crystals Display New Potential 11.7 Liquid Crystals
Preparation and Properties of Cholesteric Liquid 11.7 Liquid Crystals
Crystals
OLEDs Set to Glow 11.7 Liquid Crystals
Shining Examples 11.7 Liquid Crystals
Live Demonstrations: Section:
Dancing Crystals: A Dramatic Illustration of 11.2 Intermolecular Forces
Intermolecular Forces
Viscosity Races 11.3 Select Properties of Liquids
Liquids and Intermolecular Forces
149
Chapter 11. Liquids and Intermolecular Forces
Common Student Misconceptions
• Students confuse intermolecular and intramolecular forces.
• Students often do not appreciate how important information from earlier chapters is for the
Teaching Tips
• Ion-dipole interactions are technically interparticular forces.
• The term volatile is often used incorrectly, especially in the media.
11.1 A Molecular Comparison of Gases, Liquids, and Solids
1
,
2
,
3
,
4
,
5
,
6
,
7
,
8
• Physical properties of substances are understood in terms of kinetic-molecular theory:
• Gases are highly compressible and assume the shape and volume of their container.
• Gas molecules are far apart and do not interact much with one another.
• Liquids are almost incompressible and assume the shape but not the volume of the container.
1
“Physical Properties of the Halogens” Movie from Instructor’s Resource CD/DVD
2
“Pictorial Analogies I: States of Matter” from Further Readings
3
Figure 11.2 from Transparency Pack
4
Chapter 11
150
• We can accomplish this by cooling or compressing the gas.
• Converting a solid into a liquid or gas requires the molecules to move further apart.
FORWARDS REFERENCES
• A comparison of phases in terms of entropy will be performed in Chapter 19 (section 19.3).
11.2 Intermolecular Forces
9
,
10
,
11
,
12
• The attraction between molecules is an intermolecular force.
• Intermolecular forces are much weaker than ionic or covalent bonds.
• When a substance melts or boils, intermolecular forces are broken.
Dispersion Forces
13
,
14
,
15
,
16
,
17
,
18
,
19
• These are the weakest of all intermolecular forces.
• It is possible for two adjacent neutral molecules to affect each other.
• The nucleus of one molecule (or atom) attracts the electrons of the adjacent molecule (or atom).
• For an instant, the electron clouds become distorted.
9
“Molecular Handshake; Recognition through Weak Noncovalent Interactions” from Further Readings
10
“Dancing Crystals: A Dramatic Illustration of Intermolecular Forces” from Live Demonstrations
11
“Hydrogen Chloride” 3–D Model from Instructor’s Resource CD/DVD
12
“Hydrogen Fluoride” 3–D Model from Instructor’s Resource CD/DVD
Liquids and Intermolecular Forces
151
• Dispersion forces increase as molecular weight increases.
• Dispersion forces depend on the shape of the molecule.
Dipole-Dipole Forces
20
,
21
,
22
,
23
,
24
• Dipole-dipole forces exist between neutral polar molecules.
• Compare two molecules with similar molecular weight: acetonitrile and propane.
• With similar molecular weights, we expect similar magnitudes for the dispersion forces.
Hydrogen Bonding
25
,
26
,
27
,
28
,
29
,
30
,
31
• Experiments show that the boiling points of compounds with H–F, H–O, and H–N bonds are
abnormally high.
• Their intermolecular forces are abnormally strong.
• Hydrogen bonding is a special type of intermolecular attraction.
• This is a special case of dipole-dipole interactions.
• H-bonding requires:
• H bonded to a small electronegative element (most important for compounds of F, O, and N).
• an unshared electron pair on a nearby small electronegative ion or atom (usually F, O, or N
20
“Students as Solids, Liquids, and Gases” from Further Readings
21
“Acetonitrile” 3-D Model from Instructor’s Resource CD/DVD
22
“Propane” 3–D Model from Instructor’s Resource CD/DVD
23
“Dimethyl Ether” 3–D Model from Instructor’s Resource CD/DVD
24
“Acetaldehyde” 3–D Model from Instructor’s Resource CD/DVD
Chapter 11
152
• The molecules in solids are usually more closely packed than those in liquids.
• Therefore, solids are usually more dense than liquids.
• Ice is ordered with an open structure to optimize H-bonding.
• Water molecules in ice are arranged in an open, regular hexagon.
• Each + H points towards a lone pair on O.
Ion-Dipole Forces
32
• An ion-dipole force is an interaction between an ion (e.g., Na+) and the partial charge on the end of a
polar molecule/dipole (e.g., water).
• It is especially important for solutions of ionic substances in polar liquids.
• Example: NaCl(aq)
Comparing Intermolecular Forces
33
,
34
,
35
,
36
,
37
,
38
,
39
,
40
• Dispersion forces are found in all substances.
• Their strength depends on molecular shapes and molecular weights.
• Dipole-dipole forces add to the effect of dispersion forces.
• They are found only in polar molecules.
• H-bonding is a special case of dipole-dipole interactions.
• It is the strongest of the intermolecular forces involving neutral species.
FORWARDS REFERENCES
• Soft molecular materials held together by intermolecular forces will be in Chapter 12 (section
12.6).
32
“Put the Body to Them!” from Further Readings
33
“Intermolecular Forces” Activity from Instructor’s Resource CD/DVD
34
Figure 11.14 from Transparency Pack
35
Liquids and Intermolecular Forces
153
• Breaking of solute-solute and solvent-solvent intermolecular forces and replacing
them with solute-solvent interactions will take place in the solution process (Ch. 13).
• The binding between the substrate and the active site in the enzyme action thanks to the
intermolecular forces will be discussed in Chapter 14 (section 14.7).
11.3 Select Properties of Liquids
Viscosity
41
,
42
• Viscosity is the resistance of a liquid to flow.
• A liquid flows by sliding molecules over one another.
• Viscosity depends on:
• the attractive forces between molecules.
Surface Tension
43
,
44
,
45
,
46
,
47
,
48
,
49
• Bulk molecules (those in the liquid) are equally attracted to their neighbors.
• Surface molecules are only attracted inward towards the bulk molecules.
• Therefore, surface molecules are packed more closely than bulk molecules.
• This causes the liquid to behave as if it had a “skin”.
41
“Viscosity Races” from Live Demonstrations
42
“1,2,3–Ethanetriol (glycerol)” 3-D Model from Instructor’s Resource CD/DVD
43
“Demonstration of Surface Tension” from Live Demonstrations
44
“Polarity, Miscibility, and Surface Tension of Liquids” from Live Demonstrations
45
“Lowering the Surface Tension of Water: An Illustration of the Scientific Method” from Live
Demonstrations
Chapter 11
154
• Adhesive forces are intermolecular forces that bind molecules to a surface.
• Illustrate this by looking at the meniscus in a tube filled with liquid.
• The meniscus is the shape of the liquid surface.
• The liquid climbs until adhesive and cohesive forces are balanced by gravity.
FORWARDS REFERENCES
• Viscosity of organic compounds, such as polyhydroxyl alcohols, will be mentioned in
Chapter 24 (section 24.4).
11.4 Phase Changes
50
• Phase changes are changes of state.
• Matter in one state is converted into another state.
• Sublimation: solid → gas.
Energy Changes Accompanying Phase Changes
51
,
52
,
53
• Energy changes of the system for the above processes are:
melting or fusion: ∆Hfus > 0 (endothermic).
• deposition: ∆Hdep < 0 (exothermic).
• condensation: ∆Hcon < 0 (exothermic).
• freezing: ∆Hfre < 0 (exothermic).
• Generally the heat of fusion (enthalpy of fusion) is less than heat of vaporization.
• It takes more energy to completely separate molecules, than to partially separate them.
• All phase changes are possible under the right conditions (e.g., water sublimes when snow disappears
without forming puddles).
• The following sequence is endothermic:
heat solid → melt → heat liquid → boil → heat gas
• The following sequence is exothermic:
cool gas → condense → cool liquid → freeze → cool solid
Liquids and Intermolecular Forces
155
Heating Curves
54
,
55
• Plot of temperature change versus heat added is a heating curve.
• Supercooling: When a liquid is cooled below its freezing point and it still remains a liquid.
Critical Temperature and Pressure
56
• Gases may be liquefied by increasing the pressure at a suitable temperature.
• Critical temperature is the highest temperature at which a substance can exist as a liquid.
• Critical pressure is the pressure required for liquefaction at this critical temperature.
• Supercritical carbon dioxide is widely used for these applications.
FORWARDS REFERENCES
• Supercritical fluids in green chemistry will be discussed in Chapter 18 (section 18.5).
• Thermodynamics of phase changes will be further discussed throughout Chapter 19.
11.5 Vapor Pressure
• Some of the molecules on the surface of a liquid have enough energy to escape the attraction of the
bulk liquid.
• These molecules move into the gas phase.
• As the number of molecules in the gas phase increases, some of the gas phase molecules strike the
Volatility, Vapor Pressure, and Temperature
57
,
58
,
59
• If equilibrium is never established, the vapor continues to form.
• Eventually, the liquid evaporates to dryness.
• Liquids that evaporate easily are said to be volatile.
• The higher the temperature, the higher the average kinetic energy, the faster the liquid evaporates.
Chapter 11
156
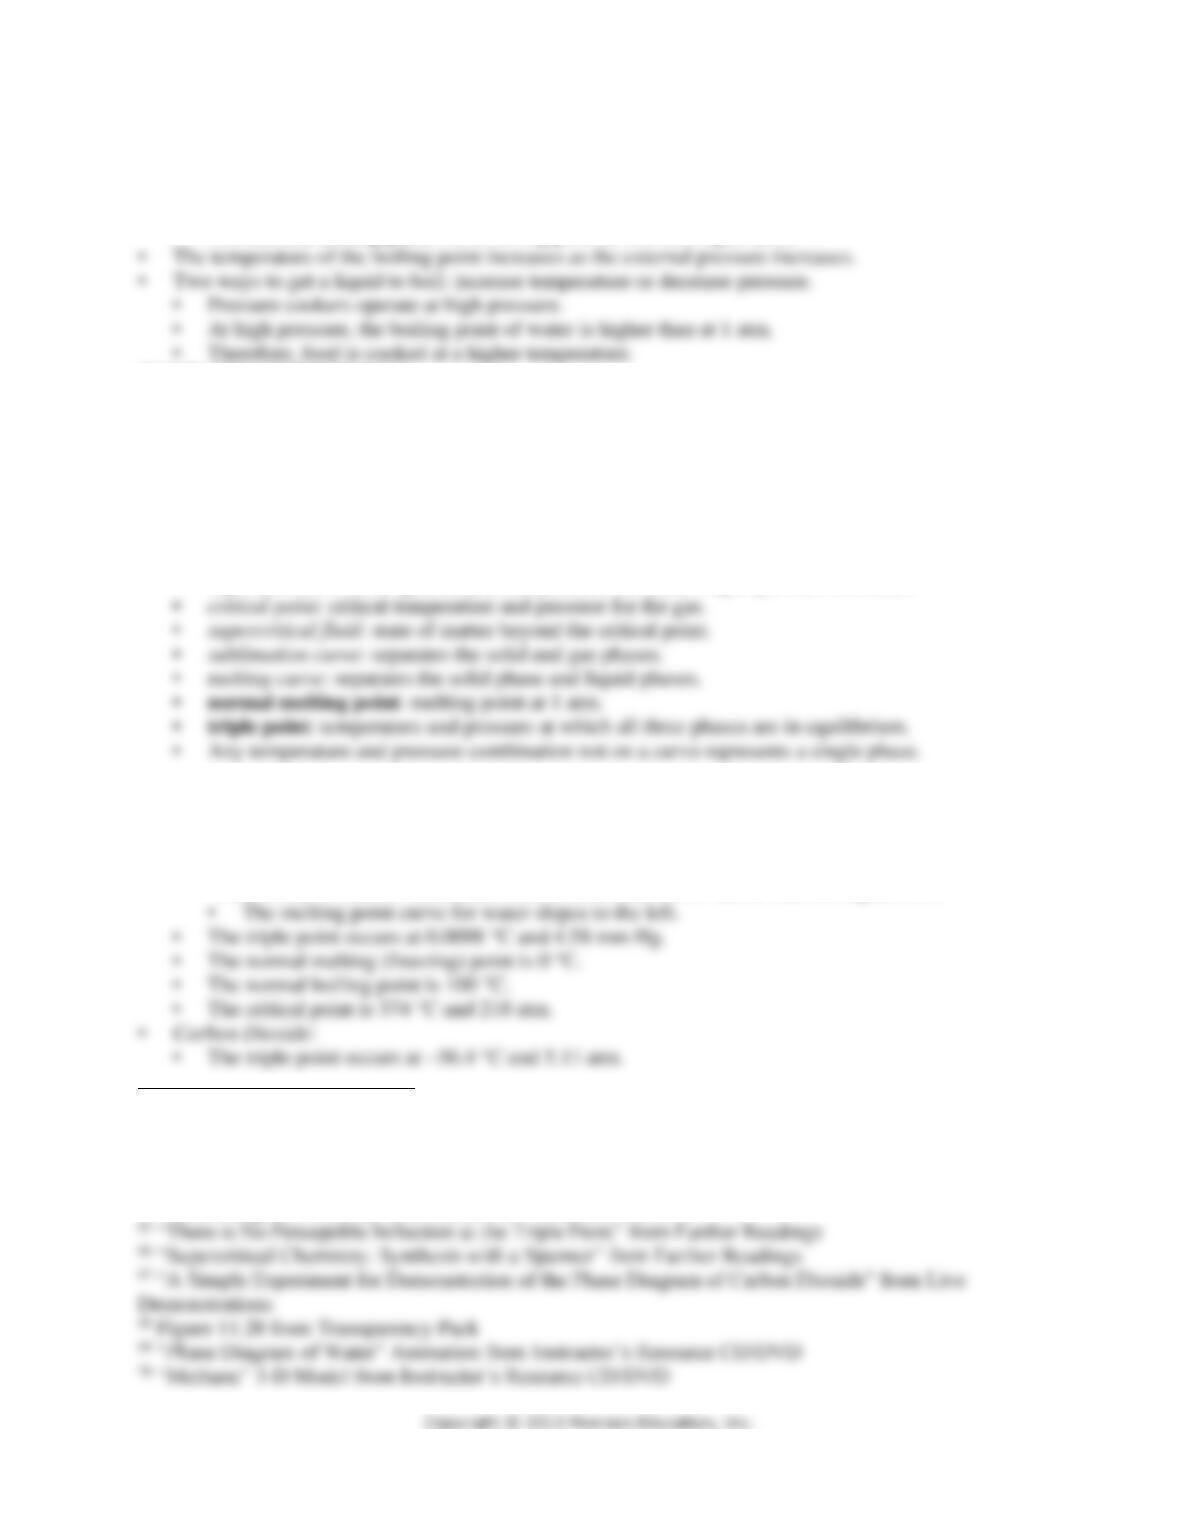
Vapor Pressure and Boiling Point
60
,
61
• Liquids boil when the external pressure at the liquid surface equals the vapor pressure.
• The normal boiling point is the boiling point at 760 mm Hg (1 atm).
FORWARDS REFERENCES
• Vapor pressure reduction of the solvent in a solution – a colligative property – will be
discussed in Chapter 13 (section 13.5).
11.6 Phase Diagrams
62
,
63
,
64
,
65
,
66
• A phase diagram is a plot of pressure vs. temperature summarizing all equilibria between phases.
• Phase diagrams tell us which phase will exist at a given temperature and pressure.
• Features of a phase diagram include:
• vapor-pressure curve: generally as temperature increases, vapor pressure increases.
Phase Diagrams of H2O and CO2
67
,
68
,
69
,
70
• Water:
• In general, an increase in pressure favors the more compact phase of the material.
• This is usually the solid.
• Water is one of the few substances whose solid form is less dense than the liquid form.
60
“Equilibrium Vapor Pressure” Activity from Instructor’s Resource CD/DVD
61
“The Effect of Pressure on Boiling Point” from Live Demonstrations
62
“Journey Around a Phase Diagram” from Further Readings
63
Figure 11.27 from Transparency Pack
64
“Phase Diagram” Activity from Instructor’s Resource CD/DVD
Liquids and Intermolecular Forces
157
• The ice sublimes.
FORWARDS REFERENCES
• Phase diagrams for a pure solvent and for a solution of a nonvolatile solute will be discussed
in Chapter 13 (section 13.5).
• Phase equilibria at melting and boiling points will be further analyzed in Chapter 19.
11.7 Liquid Crystals
71
,
72
• Solids are characterized by their order.
• Liquids are characterized by almost random ordering of molecules.
• There is an intermediate phase where liquids show a limited amount of ordering.
• Liquid crystals are substances that exhibit one or more ordered phases at a temperature above
Types of Liquid-Crystalline Phases
73
,
74
,
75
,
76
,
77
,
78
,
79
• Liquid crystal molecules are usually long and rodlike.
• In normal liquid phases they are randomly oriented.
• In liquid crystals, the molecules are arranged in specific patterns.
• Classification of liquid crystals depend on the ordering of the molecules.
• Nematic liquid crystals (least ordered).
71
“Liquid Crystal Inquiries: Add a New Phase to Your Curriculum” from Further Readings
72
“Colors in Liquid Crystals” from Live Demonstrations
73
Figure 11.32 from Transparency Pack
74
Figure 11.33 from Transparency Pack
Chapter 11
158
• The flexible tail causes the twist between the layers.
• The flexible tail usually contains many C–C bonds (e.g., the hydrocarbon tail in
cholesteryl octanoate).
Liquids and Intermolecular Forces
159
Further Readings:
1. John J. Fortman, “Pictorial Analogies I: States of Matter,” J. Chem. Educ., Vol. 70, 1993, 56–57.
5. Doris R. Kimbrough and Ronald DeLorenzo, “Solving the Mystery of Fading Fingerprints with
London-Dispersion Forces,” J. Chem. Educ., Vol. 75, 1998, 1300–1301. This is a forensic chemistry
application of London dispersion forces.
6. C. Jayne Wilcox, “London–Dispersion Forces and ‘The Wave’”, J. Chem. Educ., Vol. 75, 1998, 1301.
This is a sports analogy to introduce London-dispersion forces.
7. John W. Hill, “A People-and-Velcro Model for Hydrogen Bonding,” J. Chem. Educ., Vol. 67, 1990,
223. An analogy for hydrogen bonding is presented in this very short reading.
11. Martyn Poliakoff and Steve Howdle, “Supercritical Chemistry: Synthesis with a Spanner,” Chemistry
in Britain, February 1995, 118–121.
12. Nicholas K Kildahl, “Journey Around a Phase Diagram,” J. Chem. Educ., Vol. 71, 1994, 1052–1054.
13. Stephen J. Hawkes, “There is No Perceptible Inflection at the Triple Point,” J. Chem. Educ., Vol. 76,
1999, 226.
Chapter 11
160
as a function of temperature and composition. This reference includes instructions for the preparation of a
number of such compounds.
17. Richard Stevenson, “OLEDs Set to Glow,” Chemistry in Britain, January 2003, 33.
Live Demonstrations:
1. Donald W. Mundell and James H. Maynard, “Dancing Crystals: A Dramatic Illustration of
Intermolecular Forces,” J. Chem. Educ., Vol. 84, 2007, 1773-1775.
2. William M. Hemmerlin and Kenton Abel, “Viscosity Races,” J. Chem. Educ., Vol. 68, 1991, 417.
This is a simple demonstration to illustrate the relationship between molecular size and viscosity.
5. Andrew J. Rosenthal, “Demonstration of Surface Tension,” J. Chem. Educ., Vol. 78, 2001, 332–333.
6. Todd P. Silverstein, “Polarity, Miscibility, and Surface Tension of Liquids,” J. Chem. Educ.,
Vol. 70, 1993, 253.
7. Paul G. Jasien, Glenn Barnett, and David Speckhard, “Lowering the Surface Tension of Water: An
Illustration of the Scientific Method,” J. Chem. Educ., Vol. 70, 1993, 67–68.