
CHAPTER 11
THE BETA FOR FLIR SYSYTEMS
NOTE: The example below shows the results from January 2015. The actual answer to the case will
change based on current market conditions
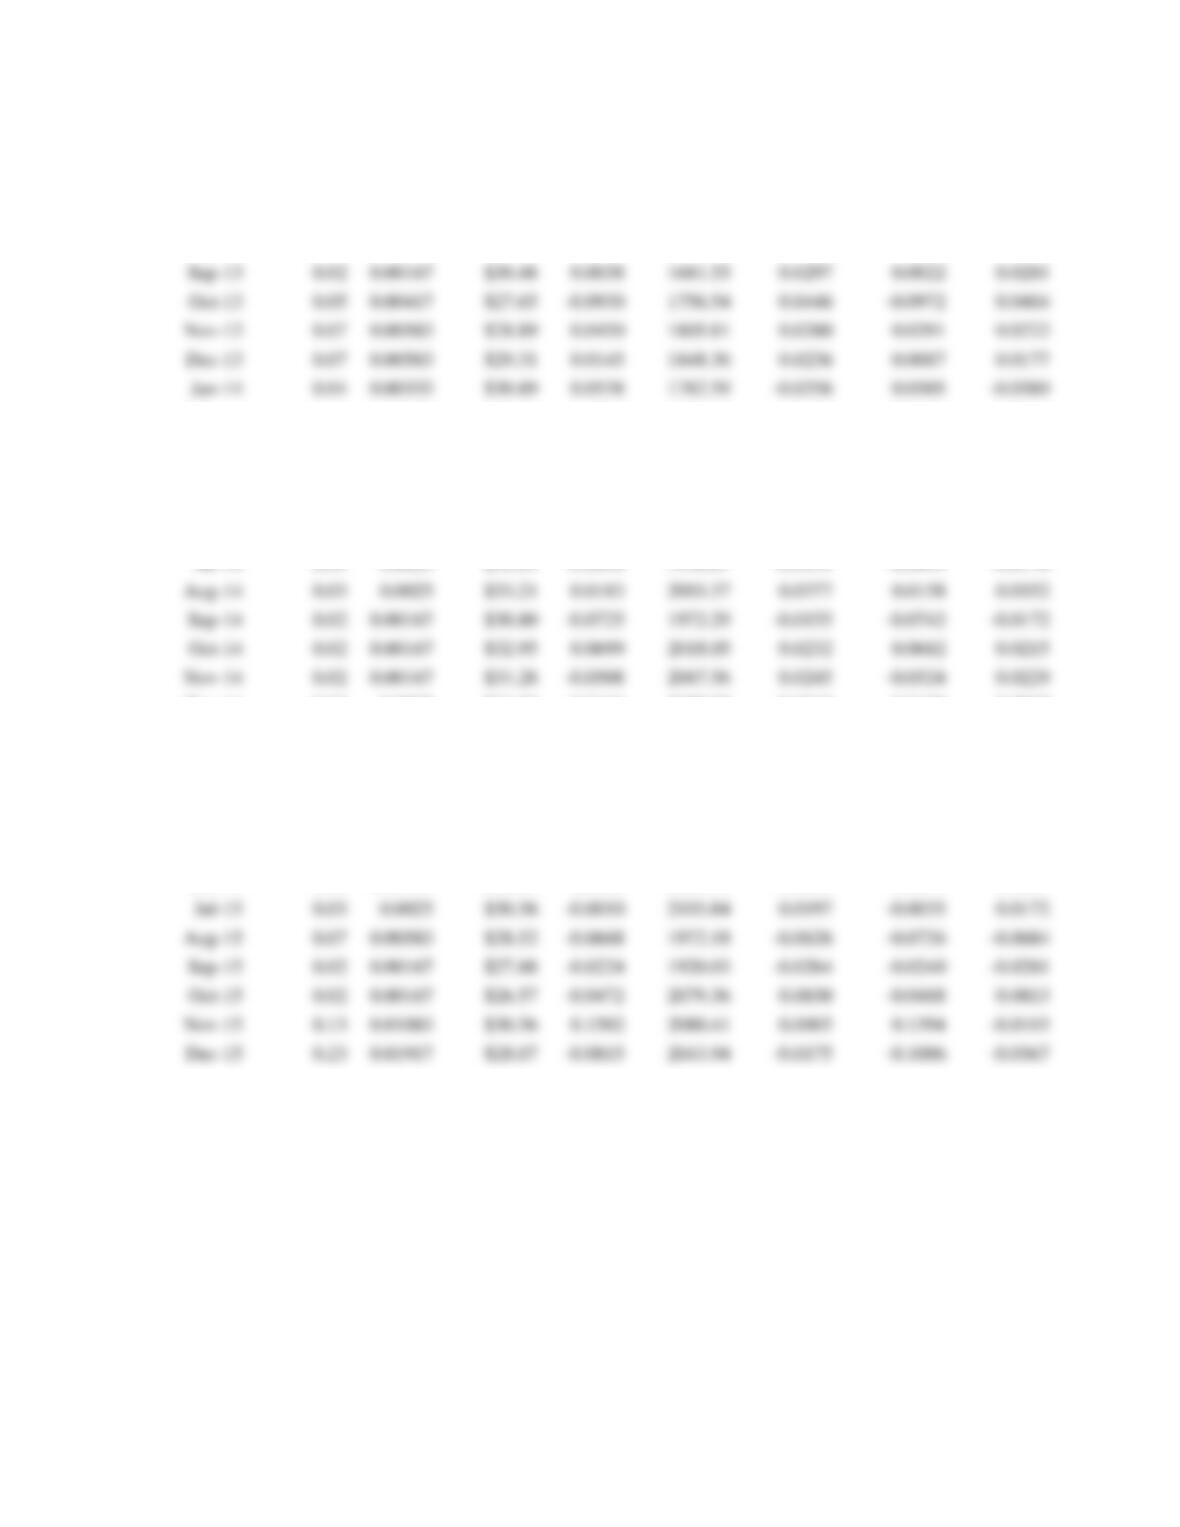
1. The information used for the analysis is presented below. Note that the risk-free rate is an annual rate.
It is necessary to find the monthly rate, so this rate is divided by 12.
3 month
Risk-free
1 month
risk-free
Stock
price
Return
S&P 500
S&P 500
return
Stock
risk
premium
Market
risk
premium
Dec–10
$27.99
1257.64
Jan-11
0.15
0.0125
$29.21
0.0434
1286.12
0.0226
0.0309
0.0101
Feb-11
0.13
0.01083
$30.45
0.0425
1327.22
0.0320
0.0317
0.0211
Mar–11
0.10
0.00833
$32.63
0.0715
1325.83
-0.0010
0.0632
-0.0094
Sep-11
0.01
0.00083
$23.71
-0.0317
1131.42
-0.0718
-0.0325
-0.0726
Oct–11
0.02
0.00167
$24.90
0.0499
1253.30
0.1077
0.0482
0.1061
Nov-11
0.01
0.00083
$25.49
0.0237
1246.96
-0.0051
0.0228
-0.0059
Dec–11
0.01
0.00083
$23.79
-0.0666
1257.60
0.0085
-0.0675
0.0077
Jan-12
0.03
0.0025
$24.43
0.0271
1312.41
0.0436
0.0246
0.0411
Feb-12
0.09
0.0075
$24.90
0.0192
1365.68
0.0406
0.0117
0.0331
Mar–12
0.08
0.00667
$24.08
-0.0329
1408.47
0.0313
-0.0395
0.0247
Apr-12
0.08
0.00667
$21.37
-0.1126
1397.91
-0.0075
-0.1193
-0.0142
0.09
0.0075
$20.36
-0.0471
1310.33
-0.0627
-0.0546
-0.0702
0.09
0.0075
$18.62
-0.0858
1362.16
0.0396
-0.0933
0.0321
0.10
0.00833
$19.52
0.0487
1379.32
0.0126
0.0404
0.0043
Sep-12
0.11
0.00917
$19.14
0.0091
1440.67
0.0242
-0.0001
0.0151
Oct–12
0.10
0.00833
$18.61
-0.0275
1412.16
-0.0198
-0.0359
-0.0281
Nov-12
0.09
0.0075
$19.61
0.0538
1416.18
0.0028
0.0463
-0.0047
Dec–12
0.07
0.00583
$21.46
0.0941
1426.19
0.0071
0.0883
0.0012
Jan-13
0.07
0.00583
$22.85
0.0650
1498.11
0.0504
0.0591
0.0446
Feb-13
0.10
0.00833
$25.40
0.1114
1514.68
0.0111
0.1031
0.0027
Apr-13
0.06
0.005
$23.45
-0.0654
1597.57
0.0181
-0.0704
0.0131
Apr-11
0.06
0.005
$33.20
0.0176
1363.61
0.0285
0.0126
0.0235
0.04
0.00333
$34.13
0.0281
1345.20
-0.0135
0.0248
-0.0168
0.04
0.00333
$31.83
-0.0675
1320.64
-0.0183
-0.0708
-0.0216
0.04
0.00333
$25.93
-0.1854
1292.28
-0.0215
-0.1887
-0.0248
Aug-11
0.02
0.00167
$24.49
-0.0555
1218.89
-0.0568
-0.0572
-0.0585
May–13
0.04
0.00333
$23.58
0.0057
1630.74
0.0208
0.0024
0.0174
Jun-13
0.05
0.00417
$26.11
0.1071
1606.28
-0.0150
0.1030
-0.0192
Jul-13
0.04
0.00333
$31.44
0.2039
1685.73
0.0495
0.2006
0.0461
Aug-13
0.04
0.00333
$30.37
-0.0340
1632.97
-0.0313
-0.0373
-0.0346
Feb-14
0.05
0.00417
$33.35
0.0798
1859.45
0.0431
0.0756
0.0390
Mar–14
0.05
0.00417
$35.17
0.0545
1872.34
0.0069
0.0503
0.0028
Apr-14
0.03
0.0025
$33.26
-0.0544
1883.95
0.0062
-0.0569
0.0037
May–14
0.03
0.0025
$34.21
0.0286
1923.57
0.0210
0.0261
0.0185
Jun-14
0.04
0.00333
$34.03
-0.0052
1960.23
0.0191
-0.0085
0.0157
Jul-14
0.03
0.0025
$32.61
-0.0418
1930.67
-0.0151
-0.0443
-0.0176
Aug-14
0.03
0.0025
$33.21
0.0183
2003.37
0.0377
0.0158
0.0352
Sep-14
0.02
0.00167
$30.80
-0.0725
1972.29
-0.0155
-0.0742
-0.0172
0.02
0.00167
$32.95
0.0699
2018.05
0.0232
0.0682
0.0215
Nov-14
0.02
0.00167
$31.28
-0.0508
2067.56
0.0245
-0.0524
0.0229
Dec–14
0.03
0.0025
$31.85
0.0183
2058.90
-0.0042
0.0158
-0.0067
Jan-15
0.03
0.0025
$29.77
-0.0653
1994.99
-0.0310
-0.0678
-0.0335
Feb-15
0.02
0.00167
$31.93
0.0725
2104.50
0.0549
0.0708
0.0532
Mar–15
0.03
0.0025
$30.94
-0.0310
2067.89
-0.0174
-0.0335
-0.0199
Apr-15
0.02
0.00167
$30.56
-0.0125
2085.51
0.0085
-0.0141
0.0069
May–15
0.02
0.00167
$30.32
-0.0076
2107.39
0.0105
-0.0092
0.0088
Jun-15
0.02
0.00167
$30.59
0.0088
2063.11
-0.0210
0.0072
-0.0227
Jul-15
0.03
0.0025
$30.56
-0.0010
2103.84
0.0197
-0.0035
0.0172
Aug-15
0.07
0.00583
$28.52
-0.0668
1972.18
-0.0626
-0.0726
-0.0684
Sep-15
0.02
0.00167
$27.88
-0.0224
1920.03
-0.0264
-0.0240
-0.0281
0.02
0.00167
$26.57
-0.0472
2079.36
0.0830
-0.0488
0.0813
Nov-15
0.13
0.01083
$30.56
0.1502
2080.41
0.0005
0.1394
-0.0103
Dec–15
0.23
0.01917
$28.07
-0.0815
2043.94
-0.0175
-0.1006
-0.0367
Using the Excel functions for the average return and standard deviation, the table below shows the
averages and standard deviations for each of the series.
Risk-free
Stock
S&P 500
Average return
.0047%
.22%
.87%
Standard deviation
.0034%
6.70%
3.38%
Sep-13
0.02
0.00167
$30.48
0.0038
1681.55
0.0297
0.0022
0.0281
0.05
0.00417
$27.65
-0.0930
1756.54
0.0446
-0.0972
0.0404
Nov-13
0.07
0.00583
$28.89
0.0450
1805.81
0.0280
0.0391
0.0222
Dec–13
0.07
0.00583
$29.31
0.0145
1848.36
0.0236
0.0087
0.0177
Jan-14
0.04
0.00333
$30.89
0.0538
1782.59
-0.0356
0.0505
-0.0389
2. Jensen’s alpha represents the excess return not explained by the beta of the stock. A positive alpha
plots above the Security Market Line and has a return in excess of its systematic risk.
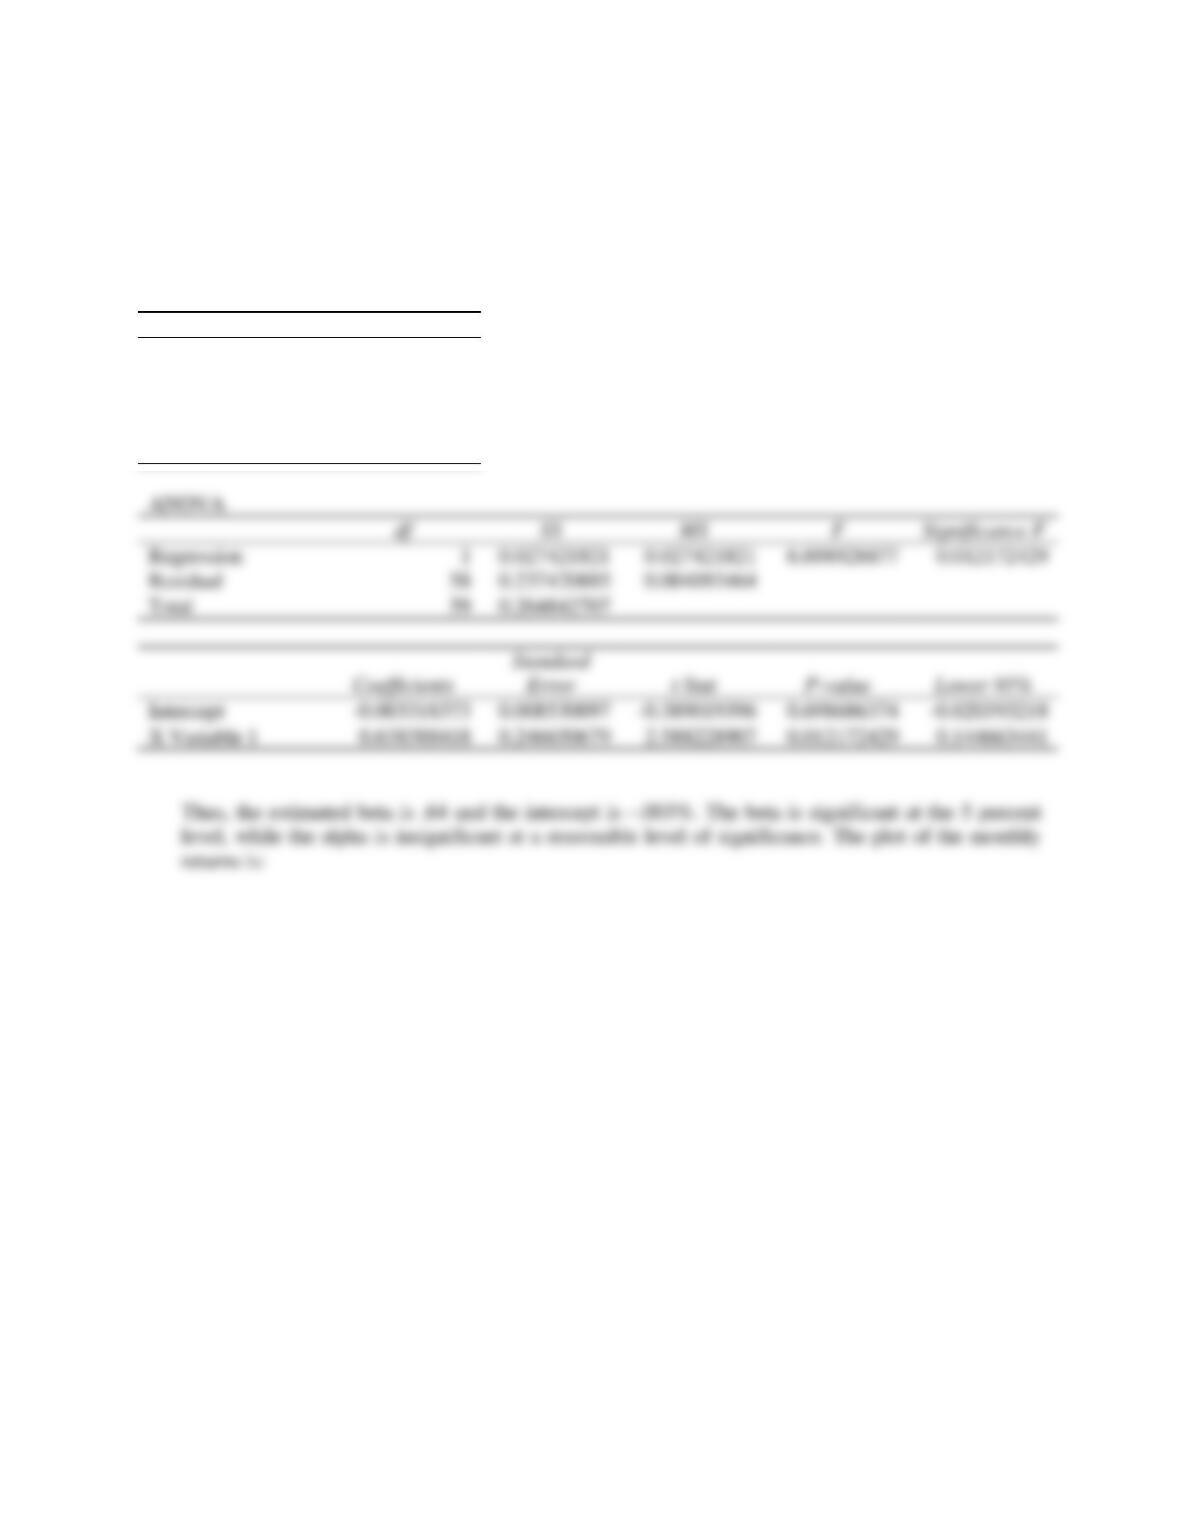
3. The relevant output from the Excel regression is:
SUMMARY OUTPUT
Regression Statistics
Multiple R
0.321776363
R Square
0.103540028
Adjusted R Square
0.088083821
Standard Error
0.063980181
Observations
60
Regression
Residual
58
Total
Intercept
X Variable 1
0.638388418
4. The beta for FLIR Systems on Yahoo! Finance at the time was .53, which is similar to this estimate.
Possible reasons for the difference could be different data, for example Yahoo! Finance could use a
longer or shorter period, or use daily data, a different risk-free rate, or a different market risk premium.
10%
15%
20%
25%
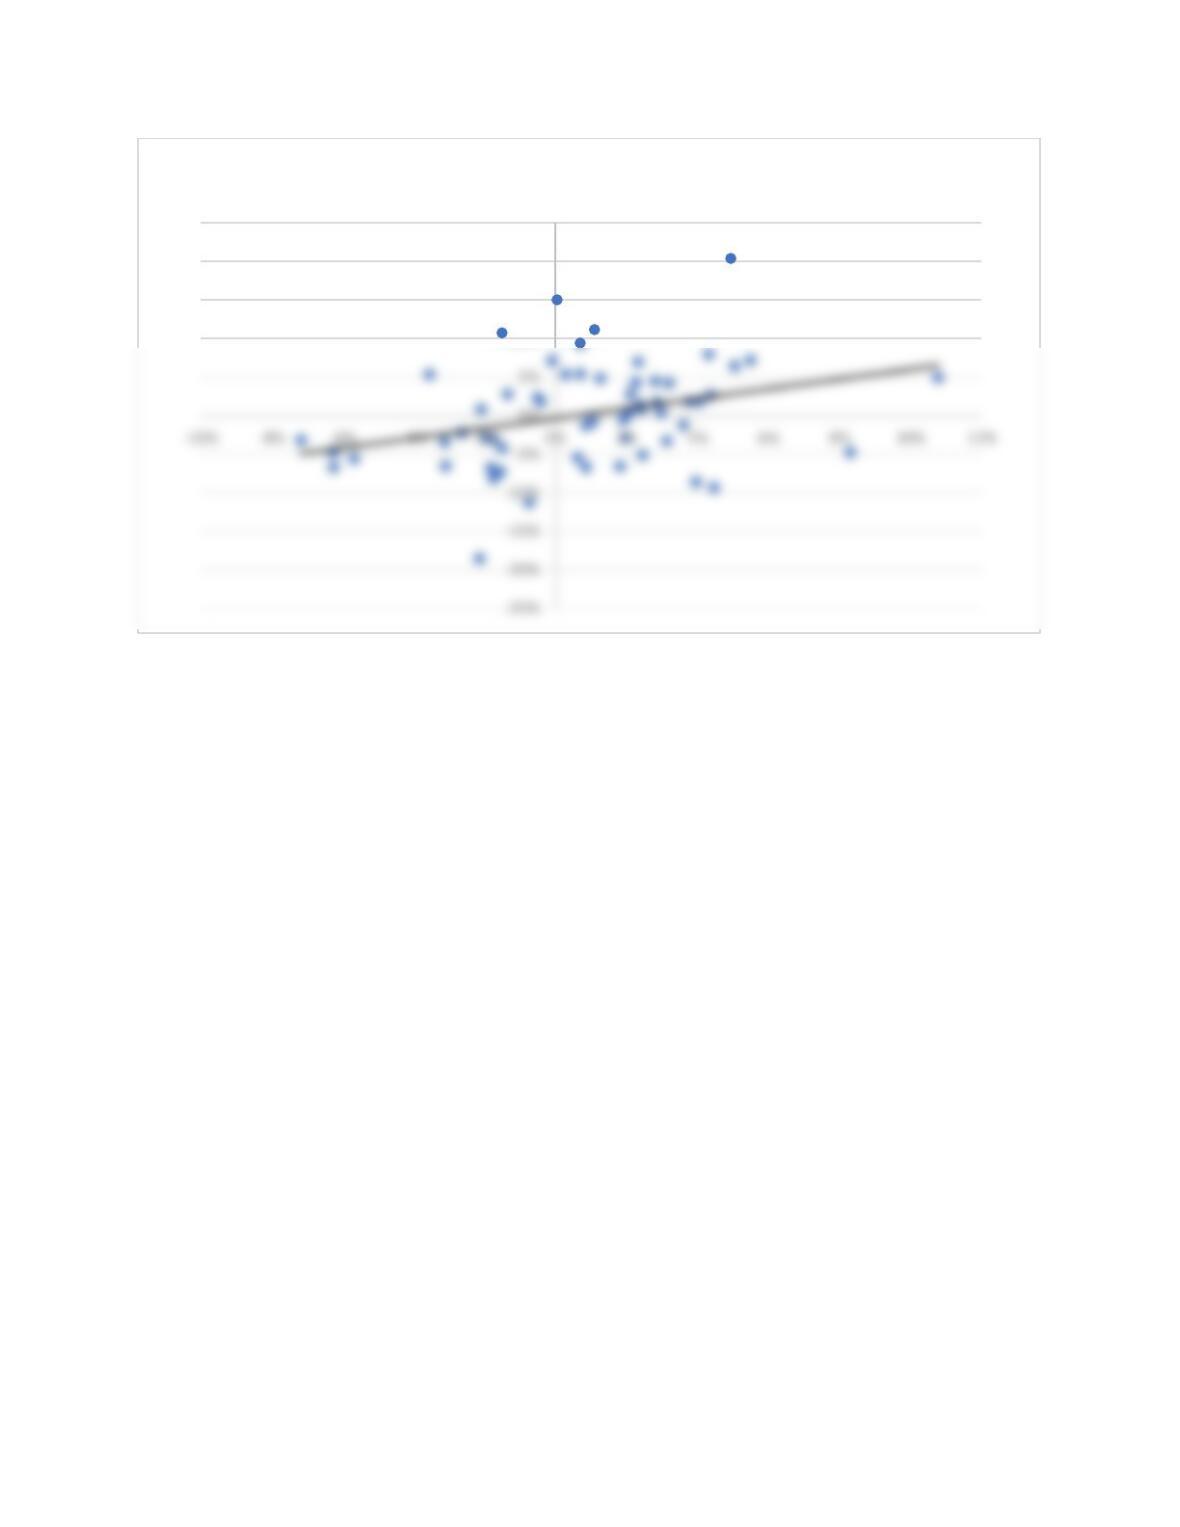
FLIR Monthly Returns vs. S&P 500 Returns