Exercise 11-11 (continued)
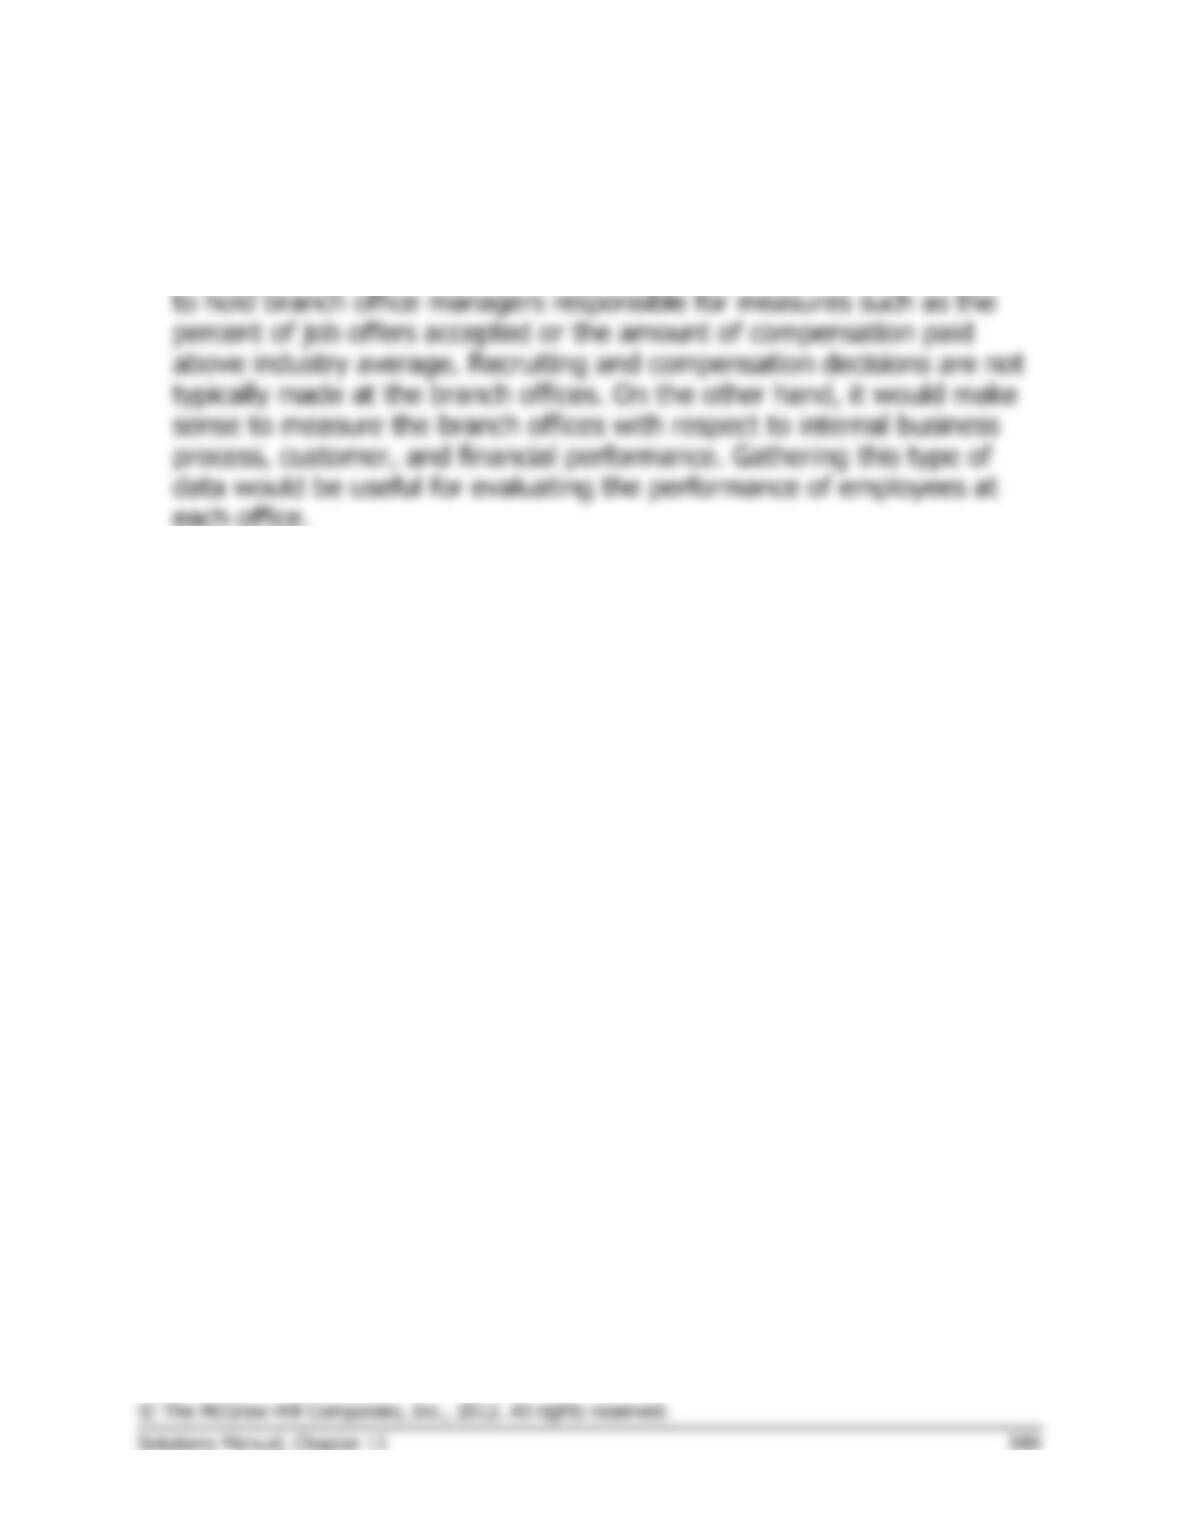
4. Each office’s individual performance should be based on the scorecard
measures only if the measures are controllable by those employed at
the branch offices. In other words, it would not make sense to attempt
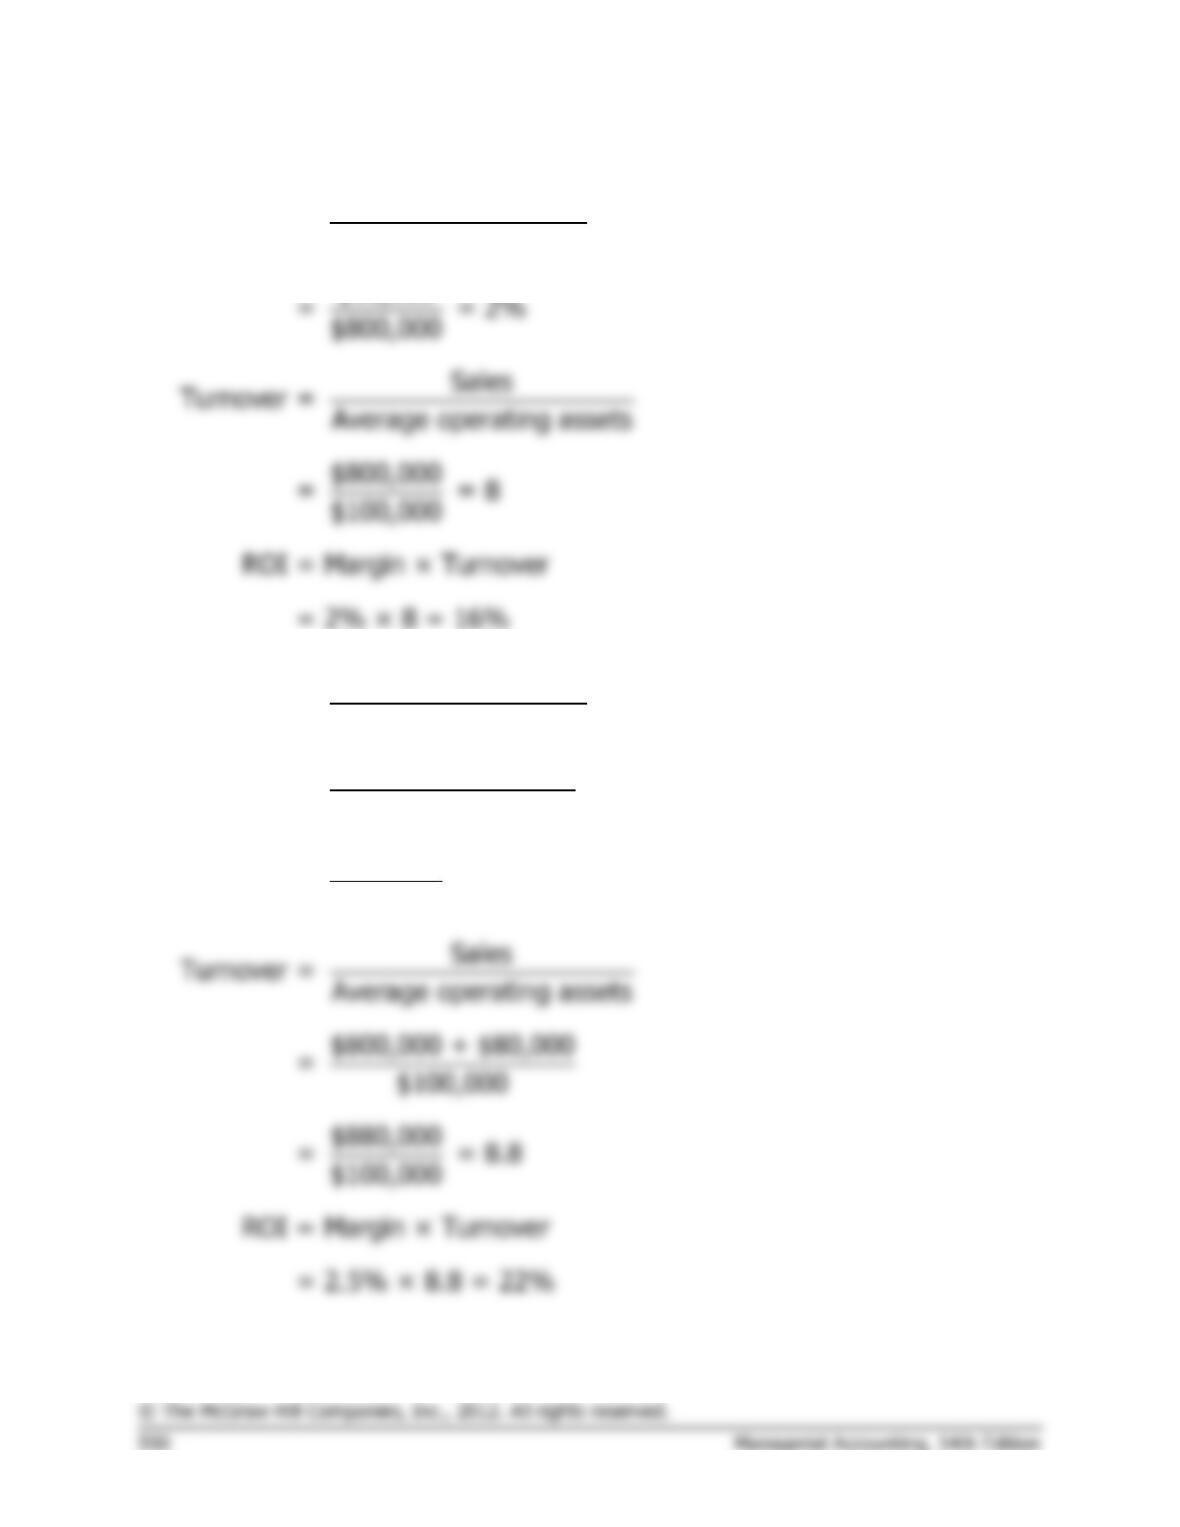
Exercise 11-12 (30 minutes)
1.
Net operating income
Margin = Sales
$16,000
2.
Net operating income
Margin = Sales
$16,000 + $6,000
=
$800,000 + $80,000
$22,000
= = 2.5%
$880,000
Exercise 11-12 (continued)
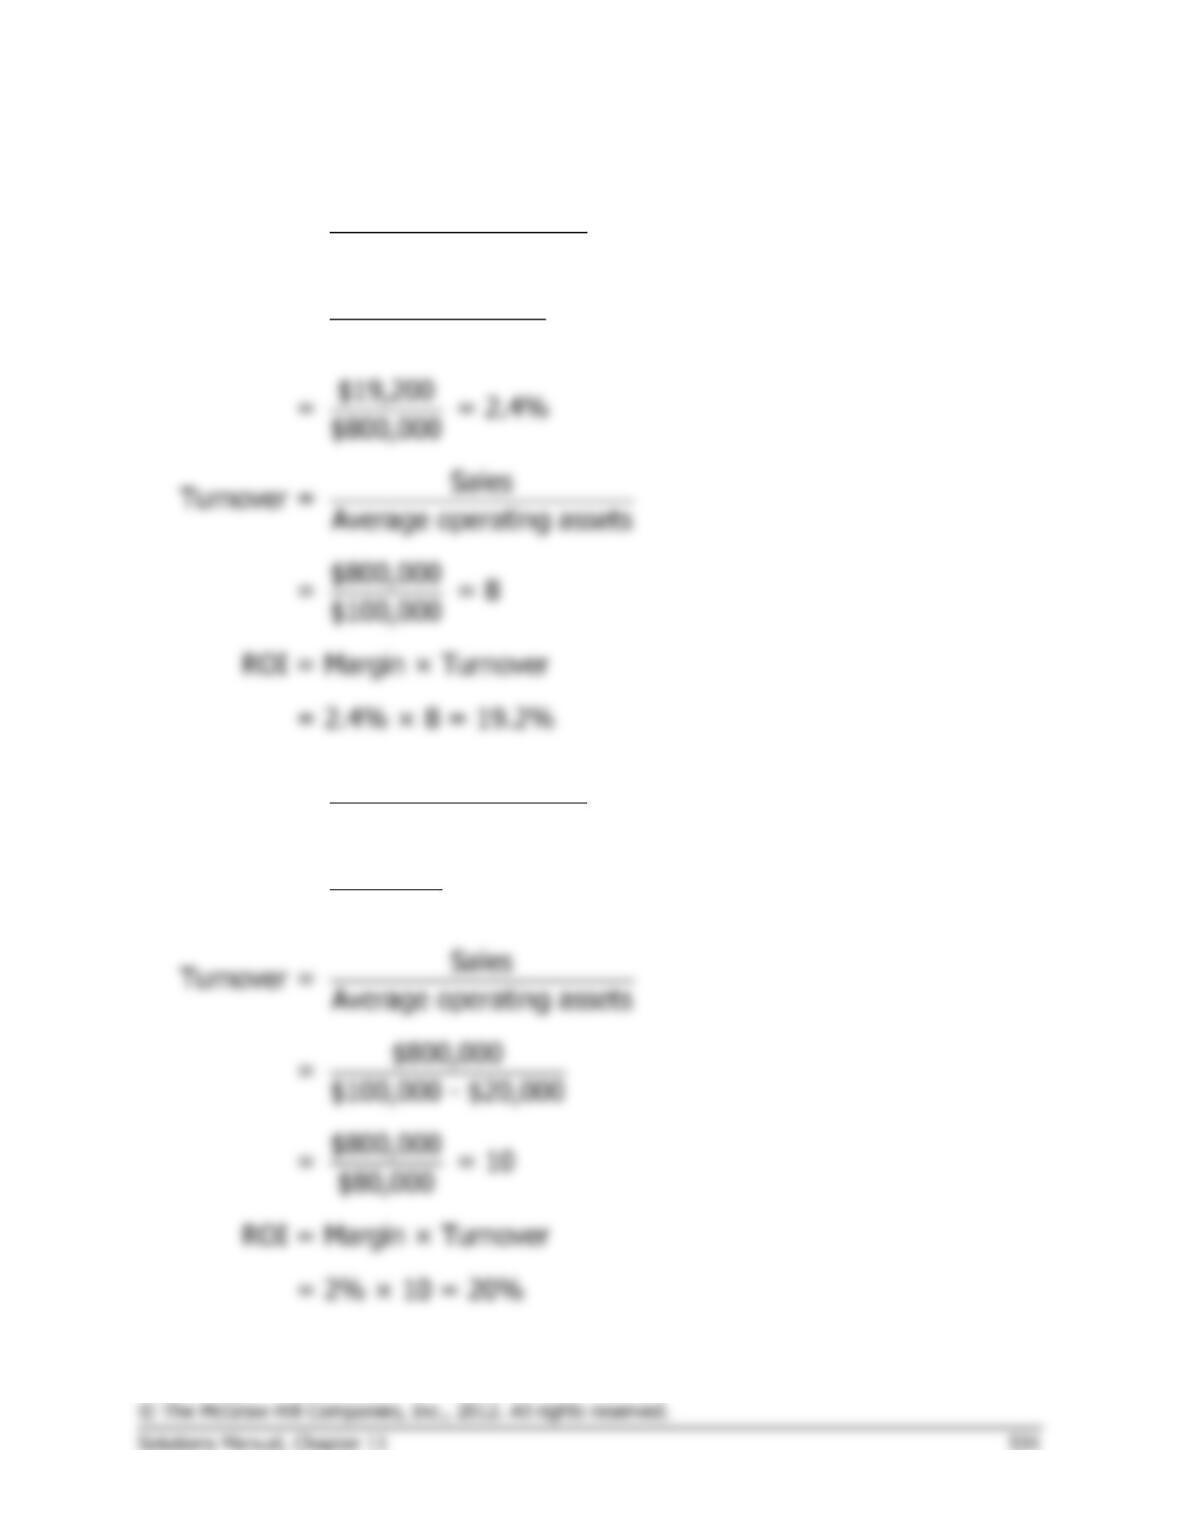
3.
Net operating income
Margin = Sales
$16,000 + $3,200
=
$800,000
4.
Net operating income
Margin =
Sales
$16,000
= = 2%
$800,000
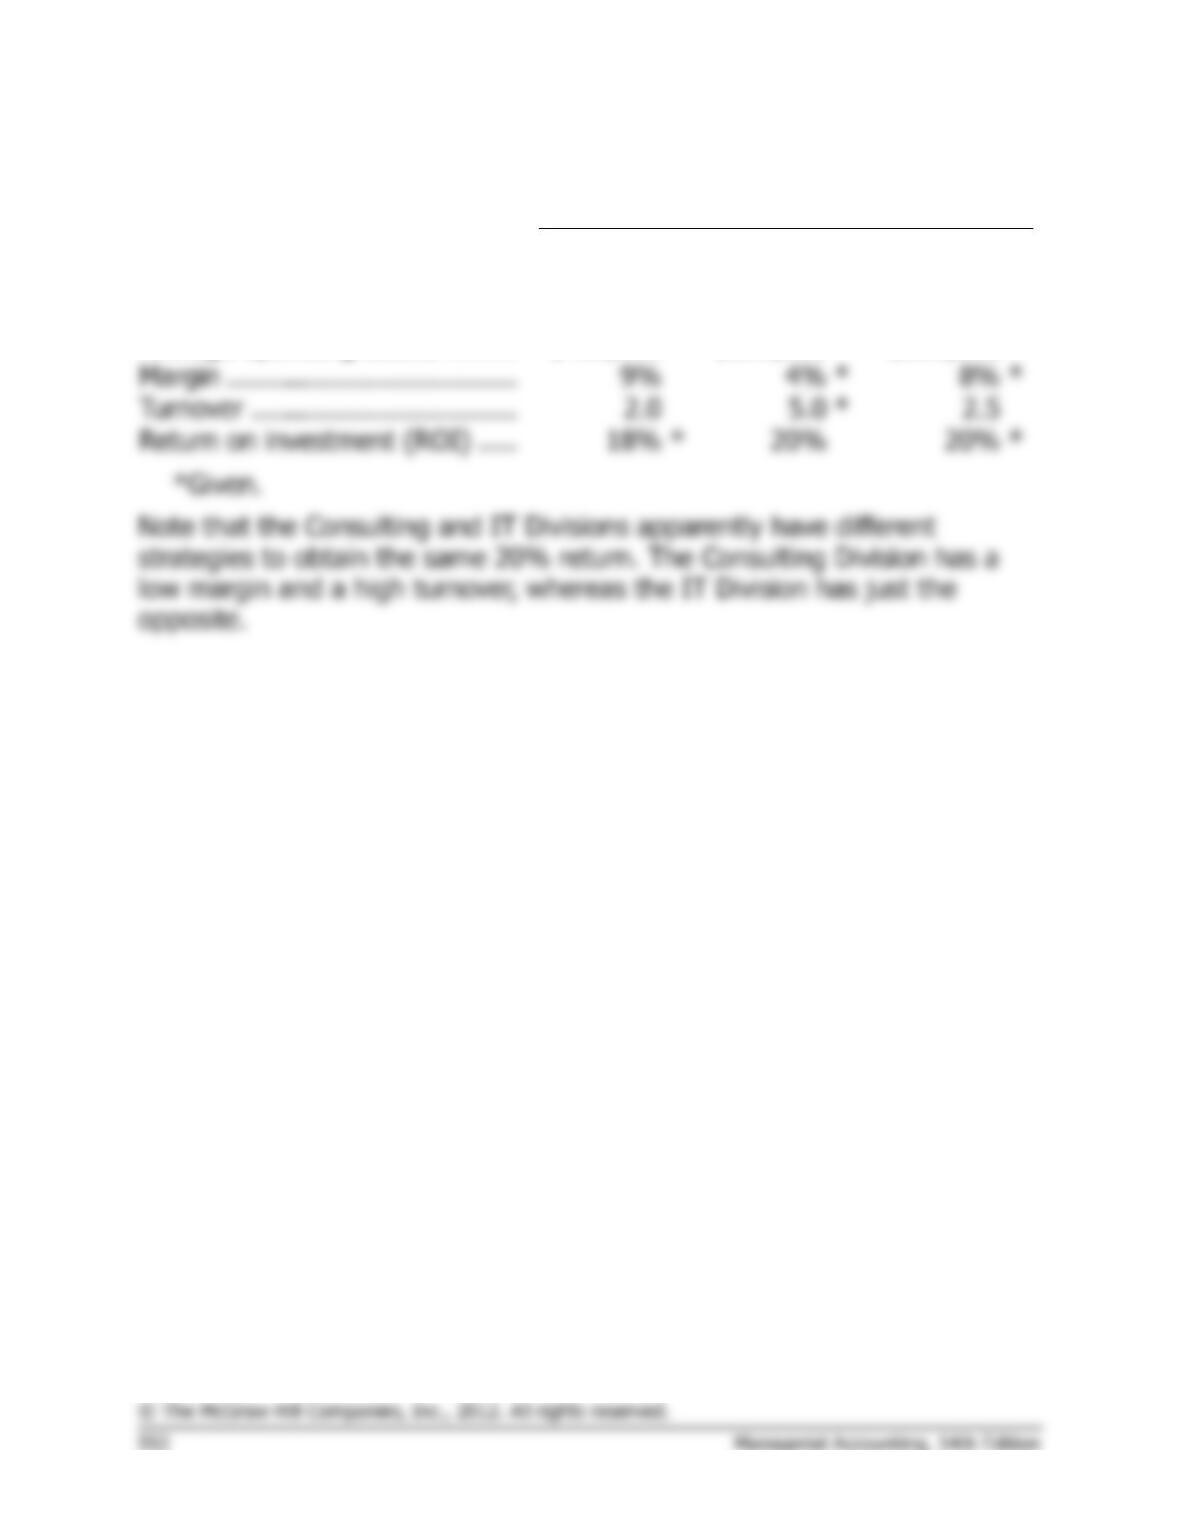
Exercise 11–13 (15 minutes)
Division
Fab
Consulting
IT
Sales …………………………………
$800,000
*
$650,000
$500,000
Net operating income ……………
$72,000
*
$26,000
$40,000
*
Average operating assets ………
$400,000
$130,000
*
$200,000
Margin ………………………………
*
*
Turnover …………………………...
*
Return on investment (ROI) …..
*
*
Problem 11-14 (30 minutes)
1.
Present
New Line
Total
(1)
Sales …………………….
$21,000,000
$9,000,000
$30,000,000
(2)
Net operating income .
$1,680,000
$630,000
*
$2,310,000
(3)
Operating assets ……..
$5,250,000
$3,000,000
$8,250,000
(4)
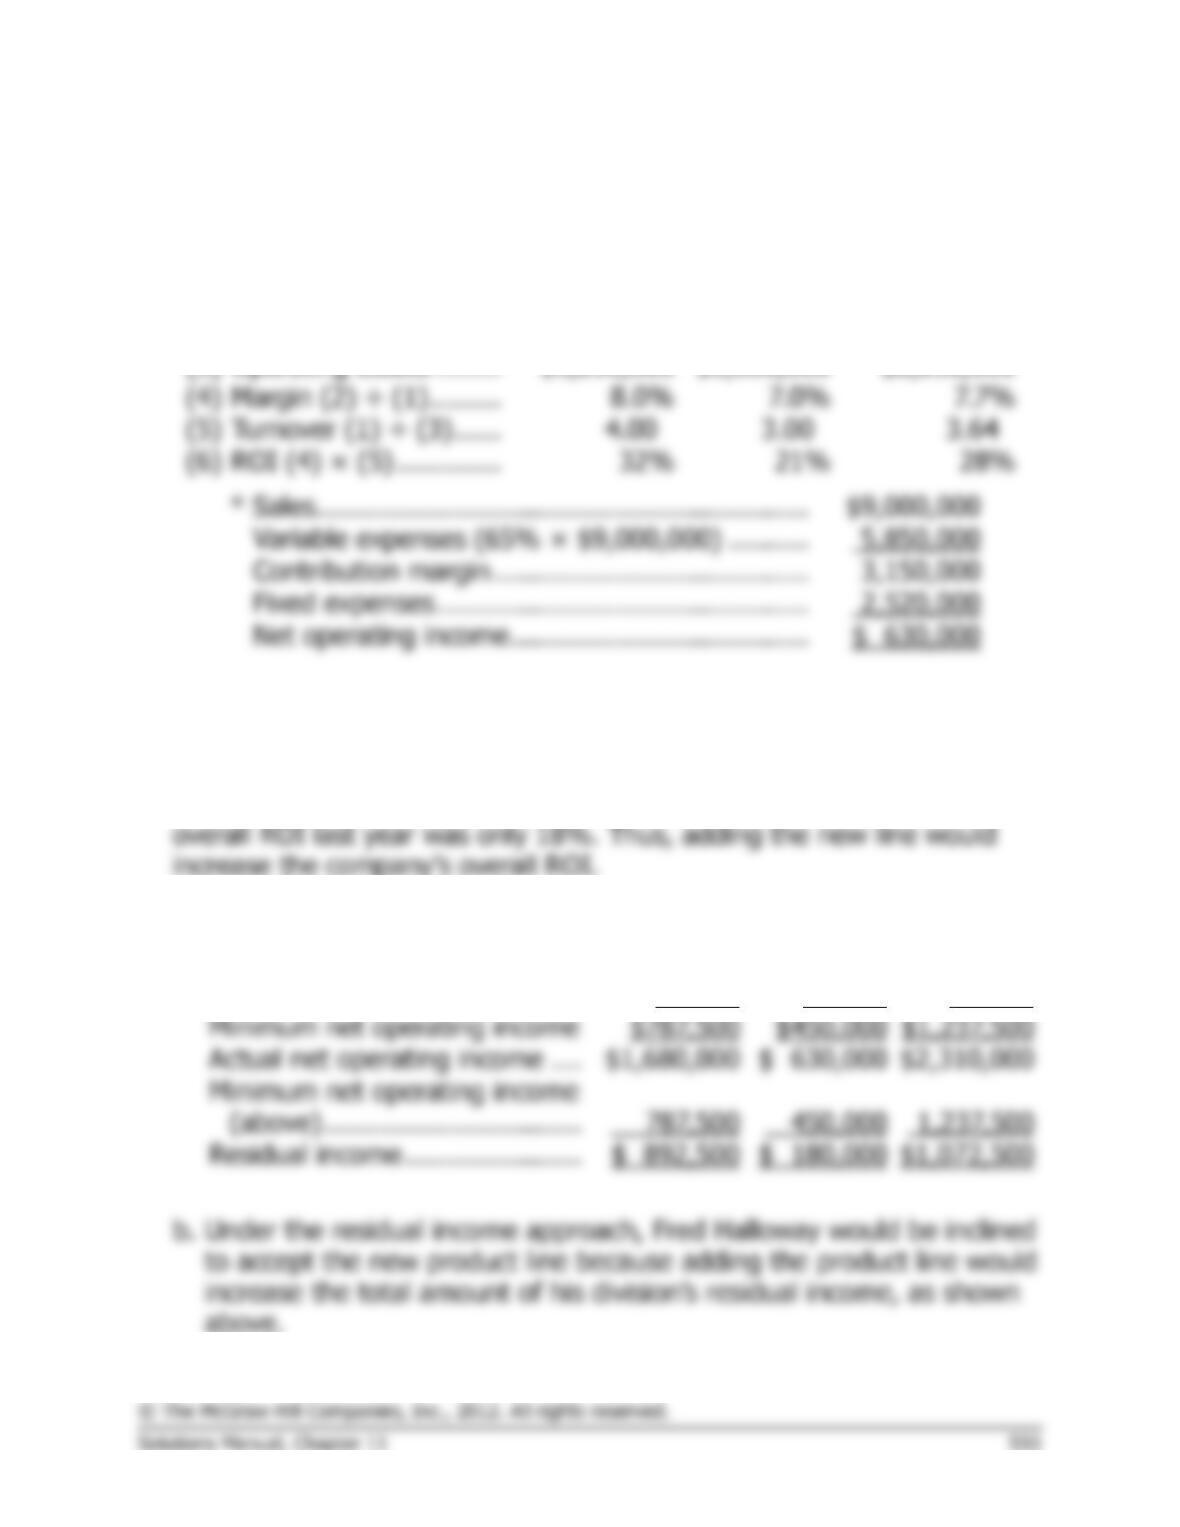
Margin (2) ÷ (1) ………
(5)
Turnover (1) ÷ (3) ……
(6)
ROI (4) × (5) ………….
*
Sales …………………………………………………….
Variable expenses (65% × $9,000,000) ……….
Contribution margin …………………………………
Fixed expenses ……………………………………….
Net operating income ……………………………….
2. Fred Halloway will be inclined to reject the new product line because
accepting it would reduce his division’s overall rate of return.
3. The new product line promises an ROI of 21%, whereas the company’s
4.
a.
Present
New Line
Total
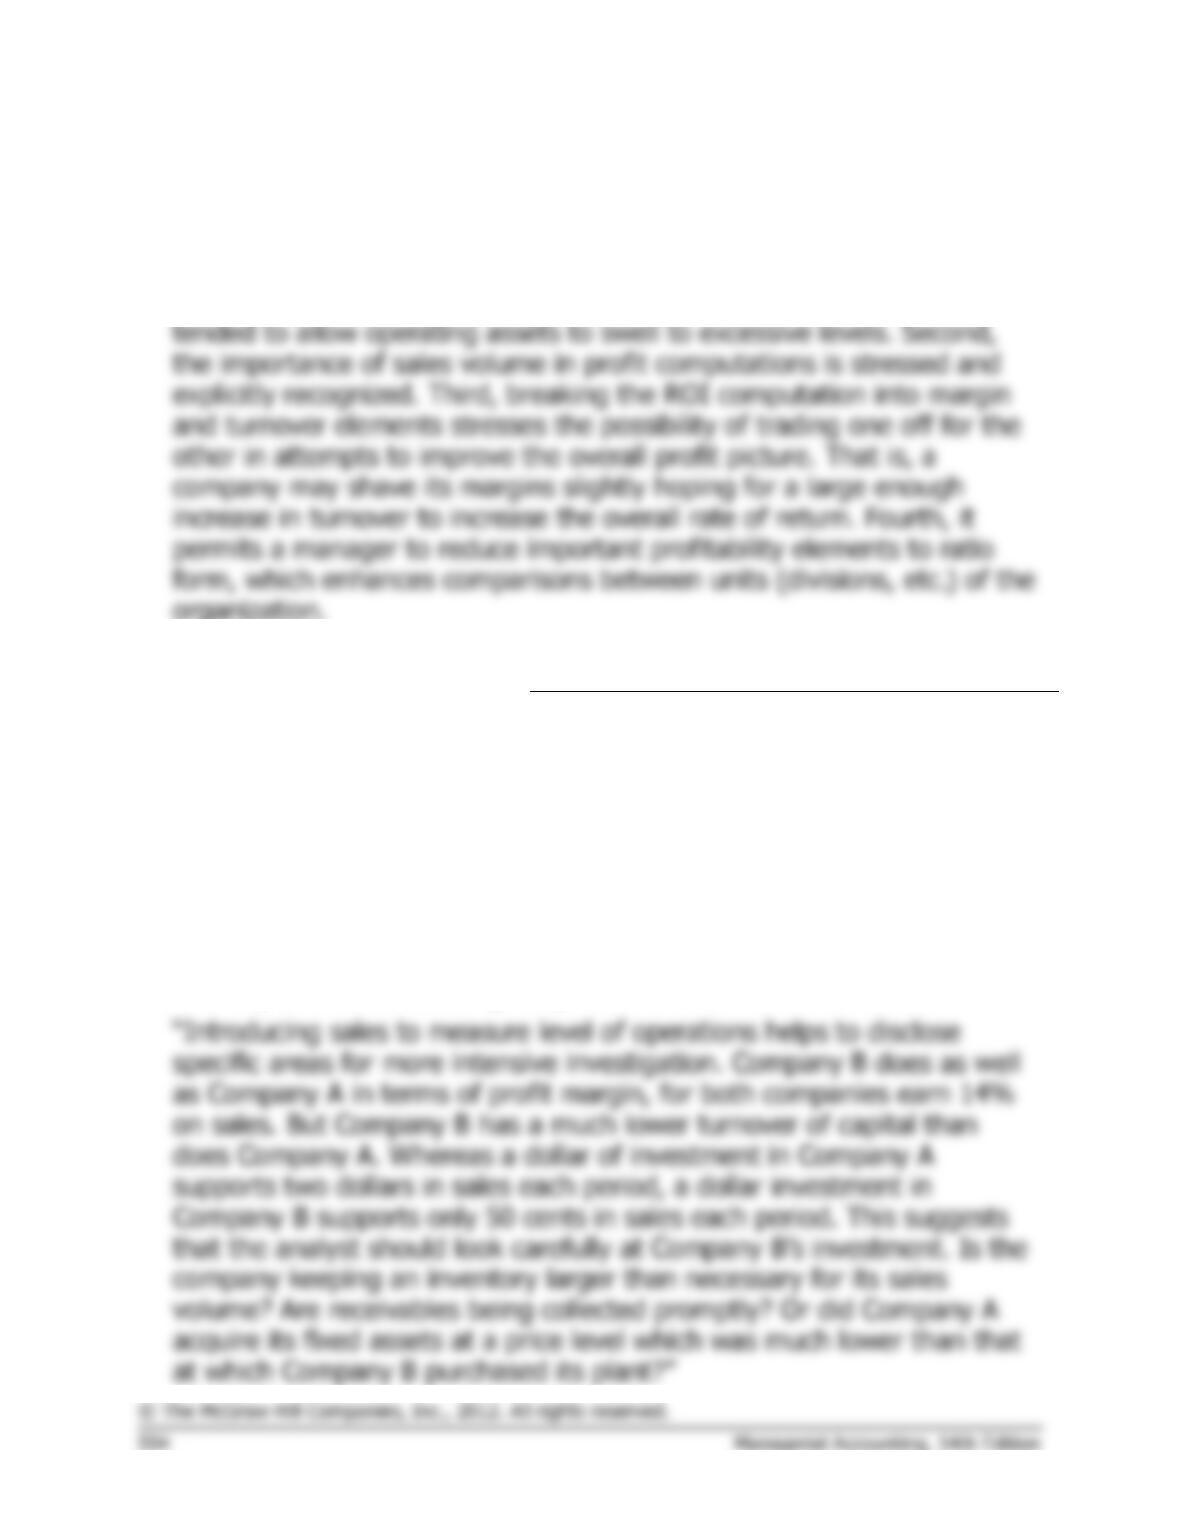
Operating assets …………………
$5,250,000
$3,000,000
$8,250,000
Minimum required return ………
× 15%
× 15%
× 15%
Minimum net operating income
Actual net operating income ….
450,000
Residual income ………………….
$1,072,500
Problem 11-15 (30 minutes)
1. Breaking the ROI computation into two separate elements helps the
manager to see important relationships that might remain hidden. First,
the importance of turnover of assets as a key element to overall
profitability is emphasized. Prior to use of the ROI formula, managers
2.
Companies in the Same Industry
A
B
C
Sales …………………………….
$4,000,000
*
$1,500,000
*
$6,000,000
Net operating income ……….
$560,000
*
$210,000
*
$210,000
Average operating assets …..
$2,000,000
*
$3,000,000
$3,000,000
*
Margin …………………………..
14%
14%
3.5%
*
Turnover ………………………..
2.0
0.5
2.0
*
Return on investment (ROI) .
28%
7%
*
7%
*Given.
NAA Report No. 35
states (p. 35):
Problem 11-15 (continued)
Thus, by including sales specifically in ROI computations the manager is
able to discover possible problems, as well as reasons underlying a
strong or a weak performance. Looking at Company A compared to
Company C, notice that C’s turnover is the same as A’s, but C’s margin
on sales is much lower. Why would C have such a low margin? Is it due
to inefficiency, is it due to geographical location (thereby requiring
higher salaries or transportation charges), is it due to excessive
materials costs, or is it due to still other factors? ROI computations raise
Problem 11-16 (30 minutes)
1. a., b., and c.
Month
1
2
3
4
Throughput time in days:
Process time …………………………....
0.6
0.5
0.5
0.4
Inspection time …………………………
0.7
0.7
0.4
0.3
Move time ……………………………….
0.5
0.5
0.4
0.5
Queue time ……………………………..
3.6
3.6
2.6
1.7
Total throughput time …………………
5.4
5.3
3.9
2.9
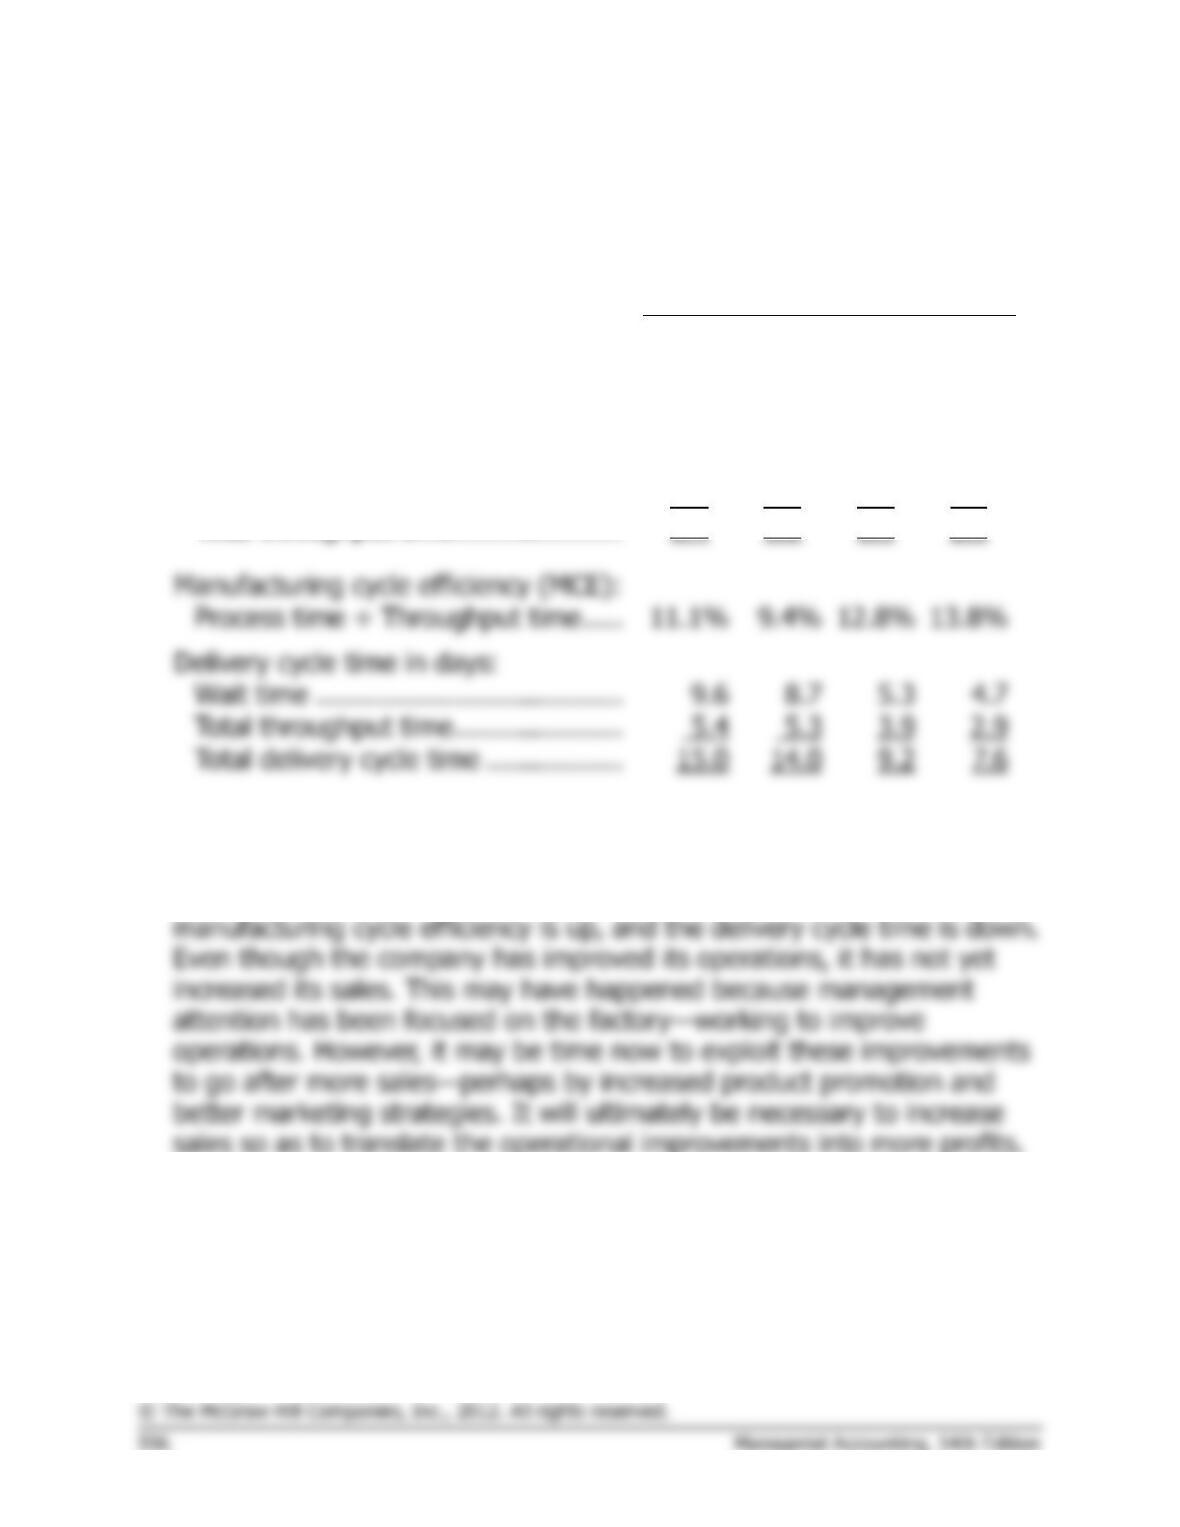
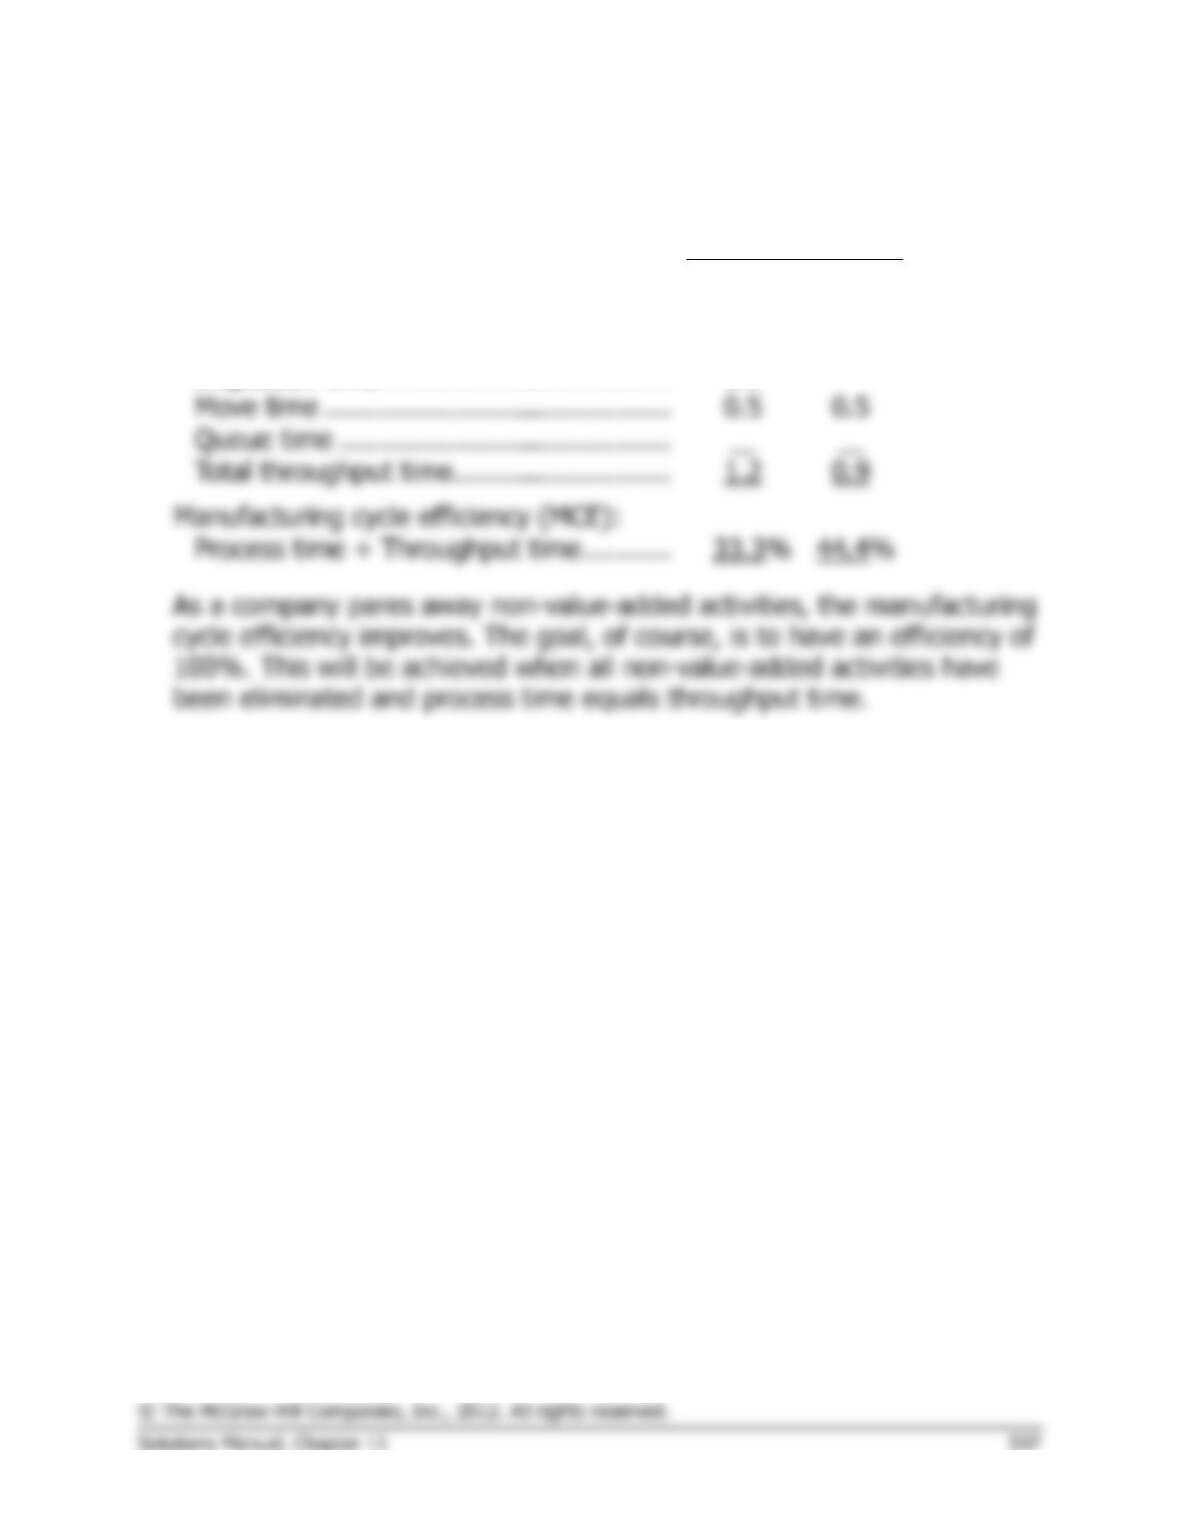
Manufacturing cycle efficiency (MCE):
Process time ÷ Throughput time …..
9.4%
Delivery cycle time in days:
Wait time ………………………………..
Total throughput time …………………
Total delivery cycle time ……………..
2. The general trend is favorable in all of the performance measures except
for total sales. On-time delivery is up, process time is down, inspection
time is down, move time is basically unchanged, queue time is down,
Problem 11-16 (continued)
3. a. and b.
Month
5
6
Throughput time in days:
Process time …………………………..……..
0.4
0.4
Inspection time ………………………………
0.3
Move time …………………………………….
0.5
0.5
Queue time …………………………………..
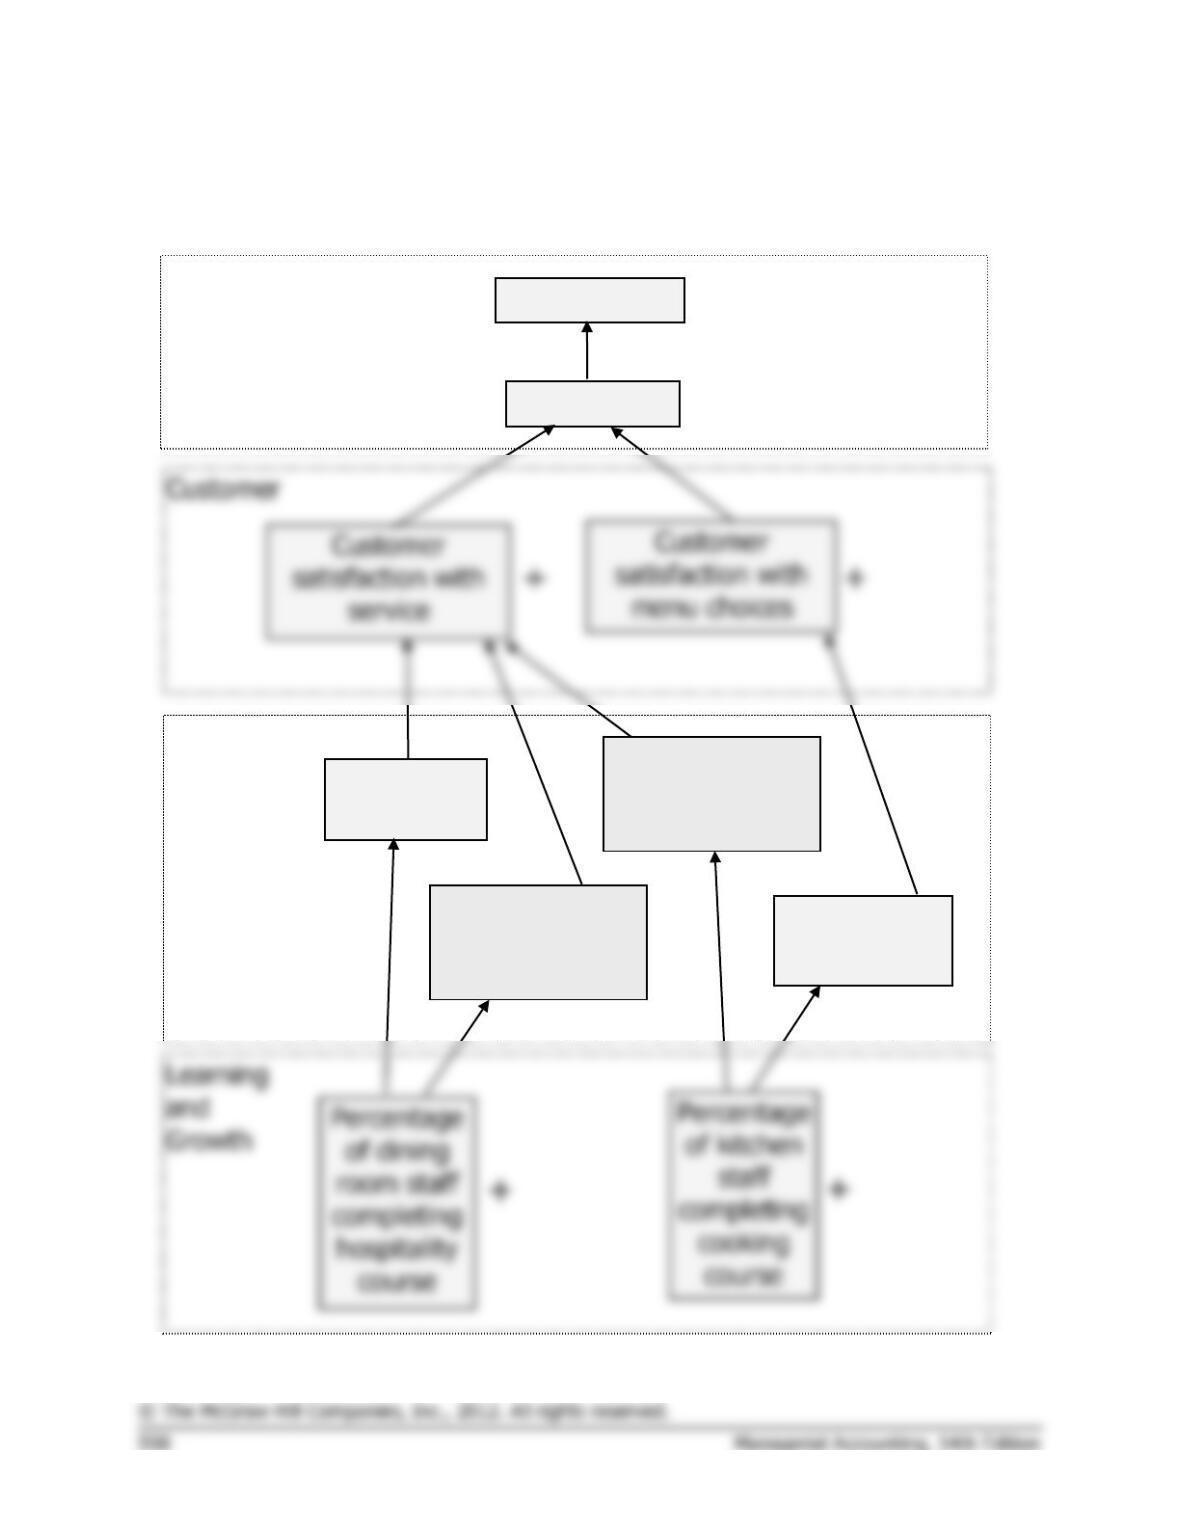
Manufacturing cycle efficiency (MCE):
+
+
Internal
Business
Processes
Financial
+
+
Problem 11-17 (45 minutes)
1. Students’ answers may differ in some details from this solution.
Total profit
Sales
Number of
menu items
Dining area
cleanliness
+
+
+
Average time
to prepare an
order
Average time
to take orders
+
–
–
Problem 11-17 (continued)
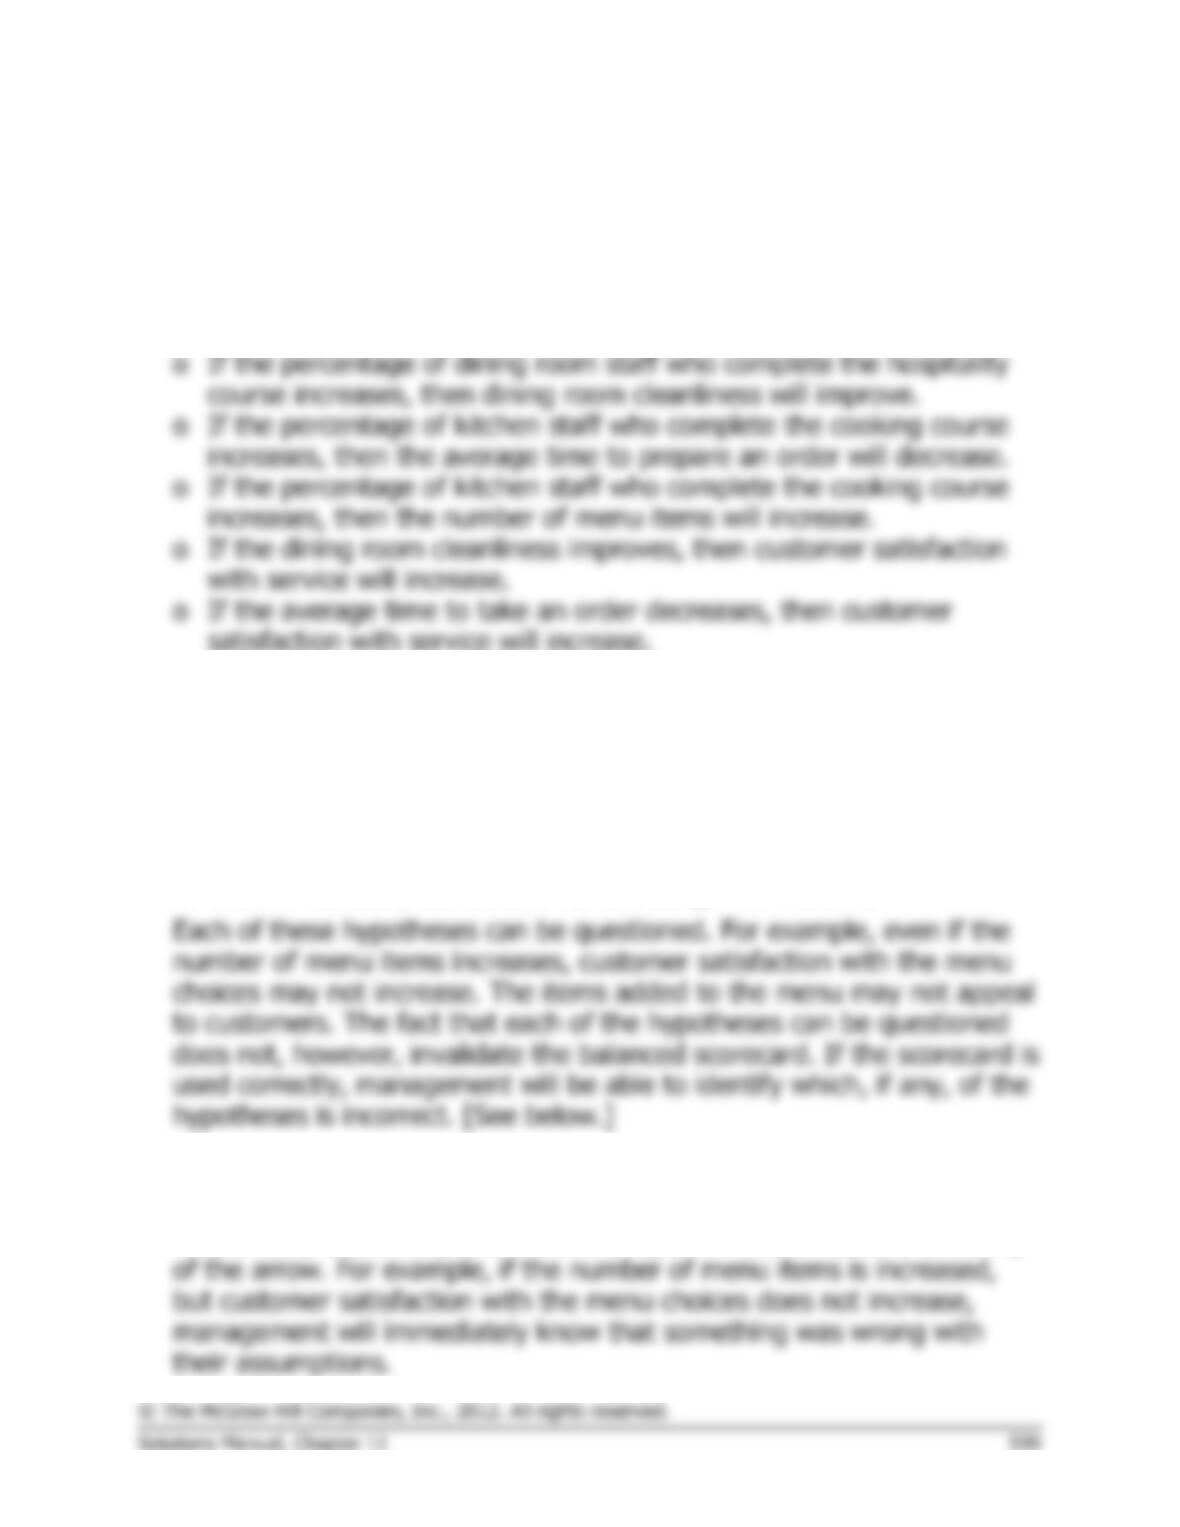
2. The hypotheses underlying the balanced scorecard are indicated by the
arrows in the diagram. Reading from the bottom of the balanced
scorecard, the hypotheses are:
o If the percentage of dining room staff who complete the hospitality
course increases, the average time to take an order will decrease.
o If the average time to prepare an order decreases, then customer
satisfaction with service will increase.
o If the number of menu items increases, then customer satisfaction
with menu choices will increase.
o If customer satisfaction with service increases, sales will increase.
o If customer satisfaction with menu choices increases, sales will
increase.
o If sales increase, total profits for the Lodge will increase.
3. Management will be able to tell if a hypothesis is false if an
improvement in a performance measure at the bottom of an arrow does
not, in fact, lead to improvement in the performance measure at the tip
Problem 11-18 (20 minutes)
1. Operating assets do not include investments in other companies or in
undeveloped land.
Ending
Balances
Beginning
Balances
Cash …………………………………
$ 130,000
$ 125,000
Accounts receivable ……………..
Inventory …………………………..
Net operating income …………………………..……..
Minimum required return (20% × $1,900,000) ….
$1,880,000 + $1,920,000
Average operating assets = = $1,900,000
2
Net operating income
Margin = Sales
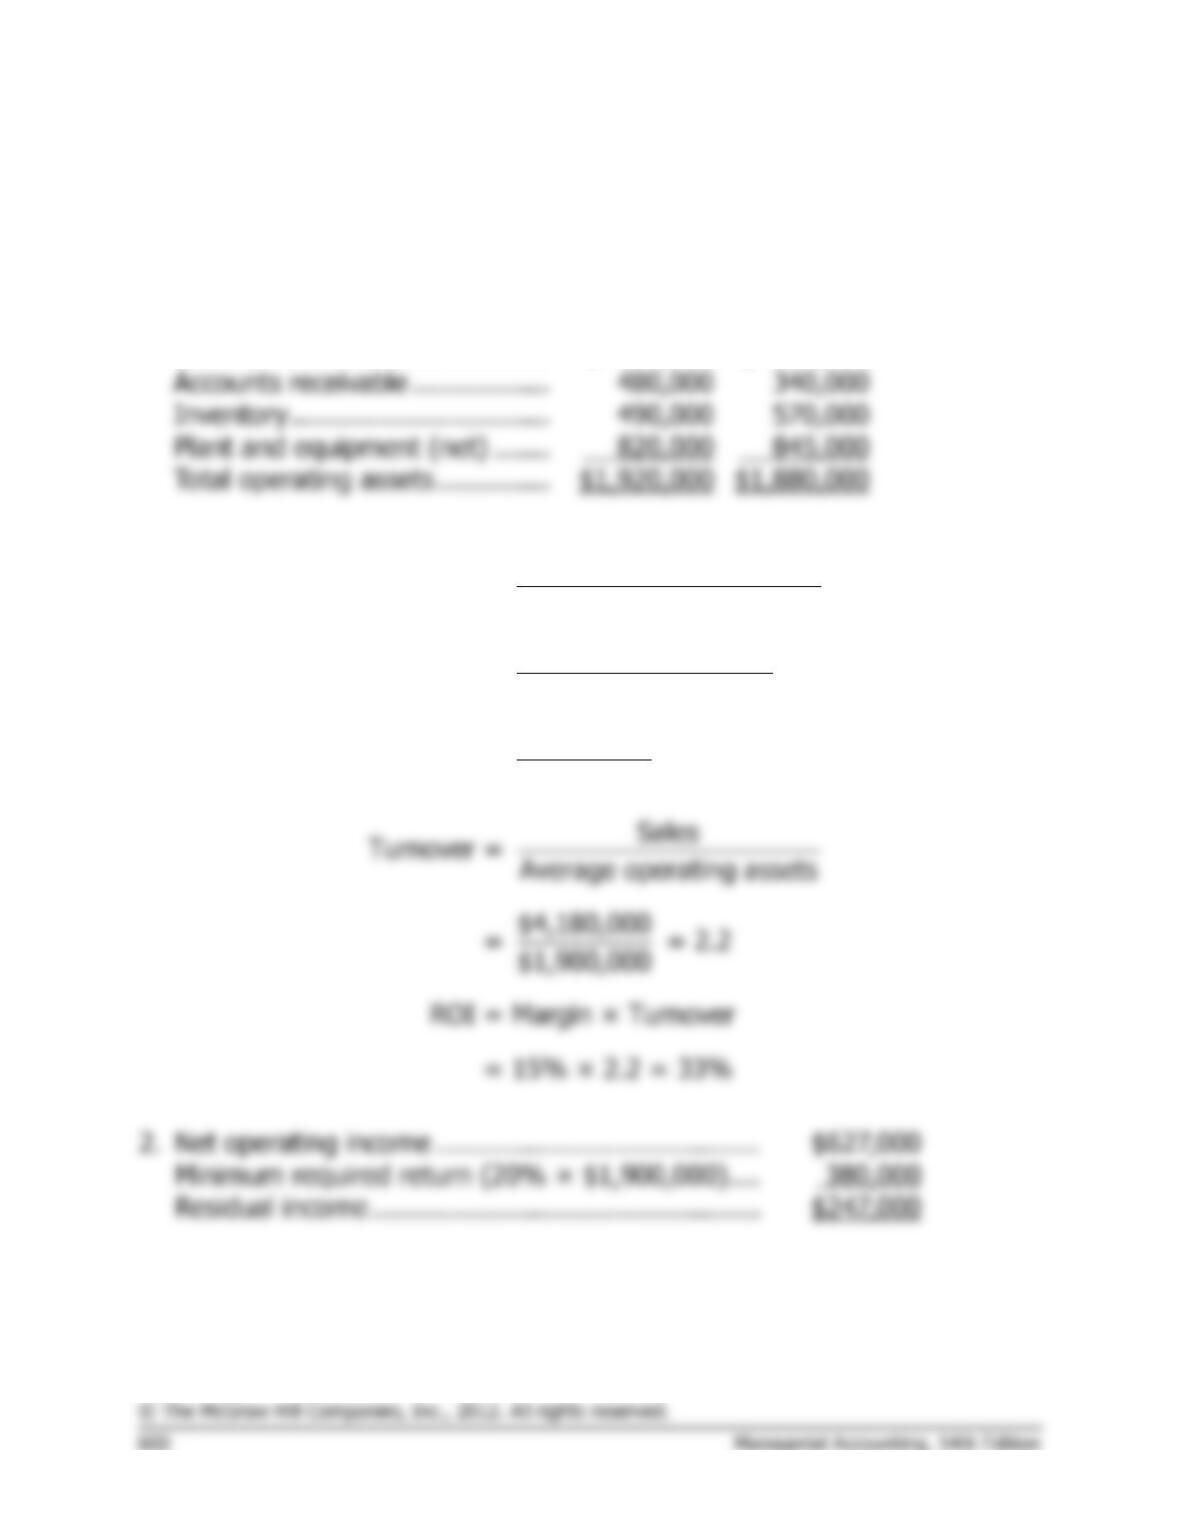
$627,000
= = 15%
$4,180,000
Problem 11-19 (45 minutes)
The answers below are not the only possible answers. Ingenious people
1. Speed-to-market can be improved by taking on less ambitious projects.
Instead of working on major product innovations that require a great
2. Performance measures that are ratios or percentages present special
dangers. A ratio can be increased either by increasing the numerator or
3. In real life, the production manager simply added several weeks to the
delivery cycle time. In other words, instead of promising to deliver an
Problem 11-19 (continued)
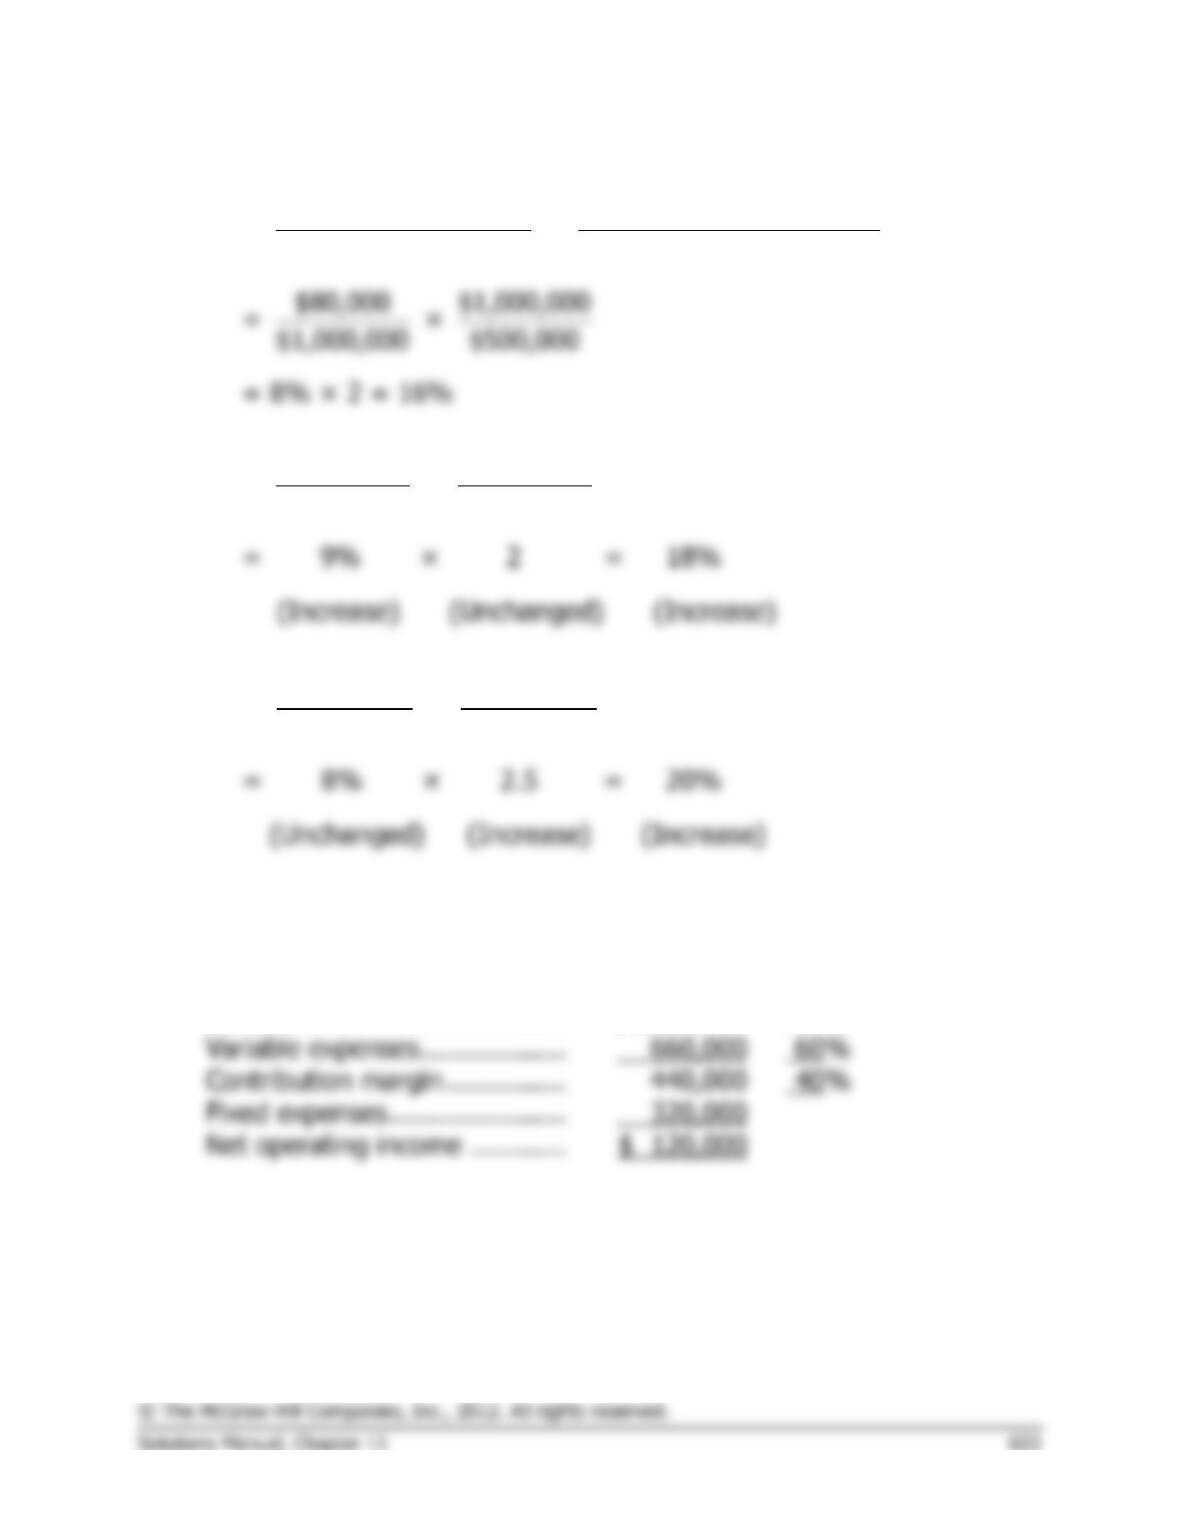
4. As stated above, ratios can be improved by changing either the
numerator or the denominator. Managers who are under pressure to
increase the revenue per employee may find it easier to eliminate
$1.2 million.
Before eliminating
the business unit
After eliminating
the business unit
Total revenue …………….
$120,000,000
$110,000,000
Total employees …………
1,000
800
Revenue per employee ..
Total profits ………………
Problem 11-20 (30 minutes)
1.
Net operating income Sales
ROI = ×
Sales Average operating assets
2.
$90,000 $1,000,000
ROI = ×
$1,000,000 $500,000
3.
$80,000 $1,000,000
ROI = ×
$1,000,000 $400,000
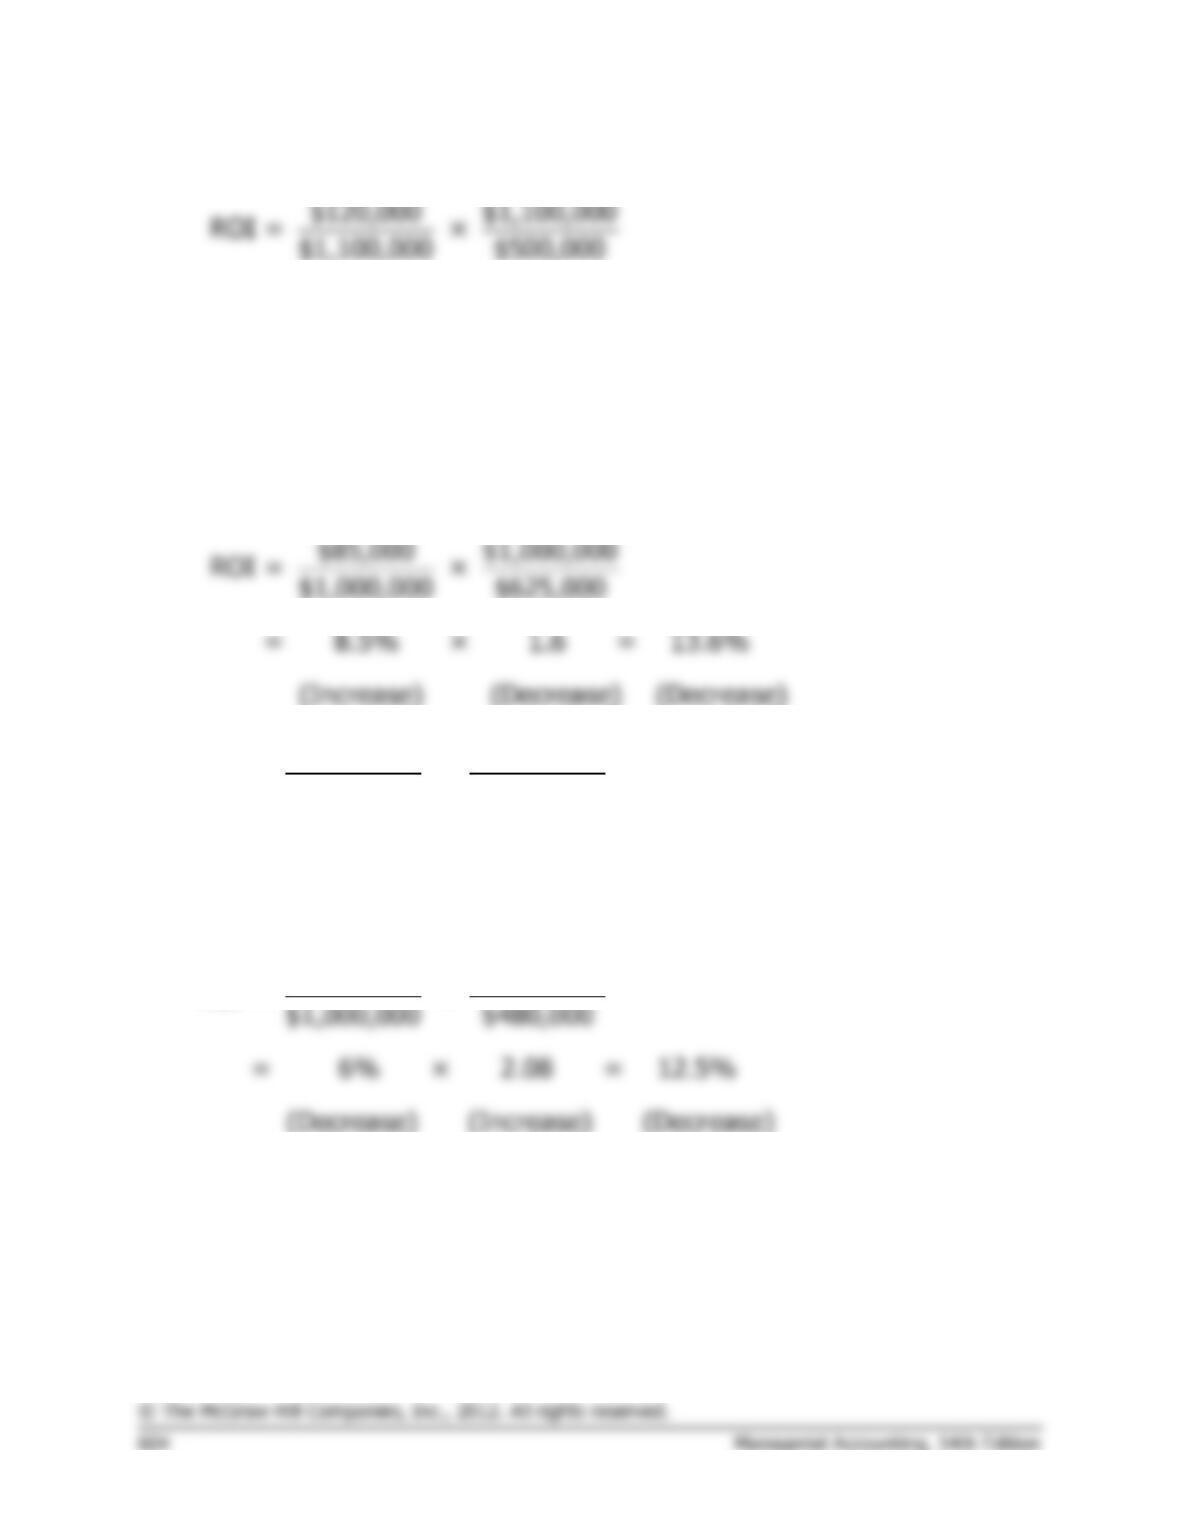
4. The company has a contribution margin ratio of 40% ($20 CM per unit
divided by $50 selling price per unit). Therefore, a $100,000 increase in
sales would result in a new net operating income of:
Sales ………………………………
$1,100,000
100%
Fixed expenses ………………….
Net operating income …………
Problem 11-20 (continued)
= 10.91% × 2.2 = 24%
(Increase) (Increase) (Increase)
A change in sales affects
both
the margin and the turnover.
5. Interest is a financing expense and thus is not used to compute net
operating income.
$85,000 $1,000,000
ROI = ×
6.
$80,000 $1,000,000
ROI = ×
$1,000,000 $320,000
= 8% × 3.125 = 25%
(Unchanged) (Increase) (Increase)
7.
$60,000 $1,000,000
ROI = ×
Problem 11-21 (90 minutes)
1. Both companies view training as important; both companies need to
leverage technology to succeed in the marketplace; and both companies
are concerned with minimizing defects. There are numerous differences
between the two companies. For example, Applied Pharmaceuticals is a
Problem 11-21 (continued)
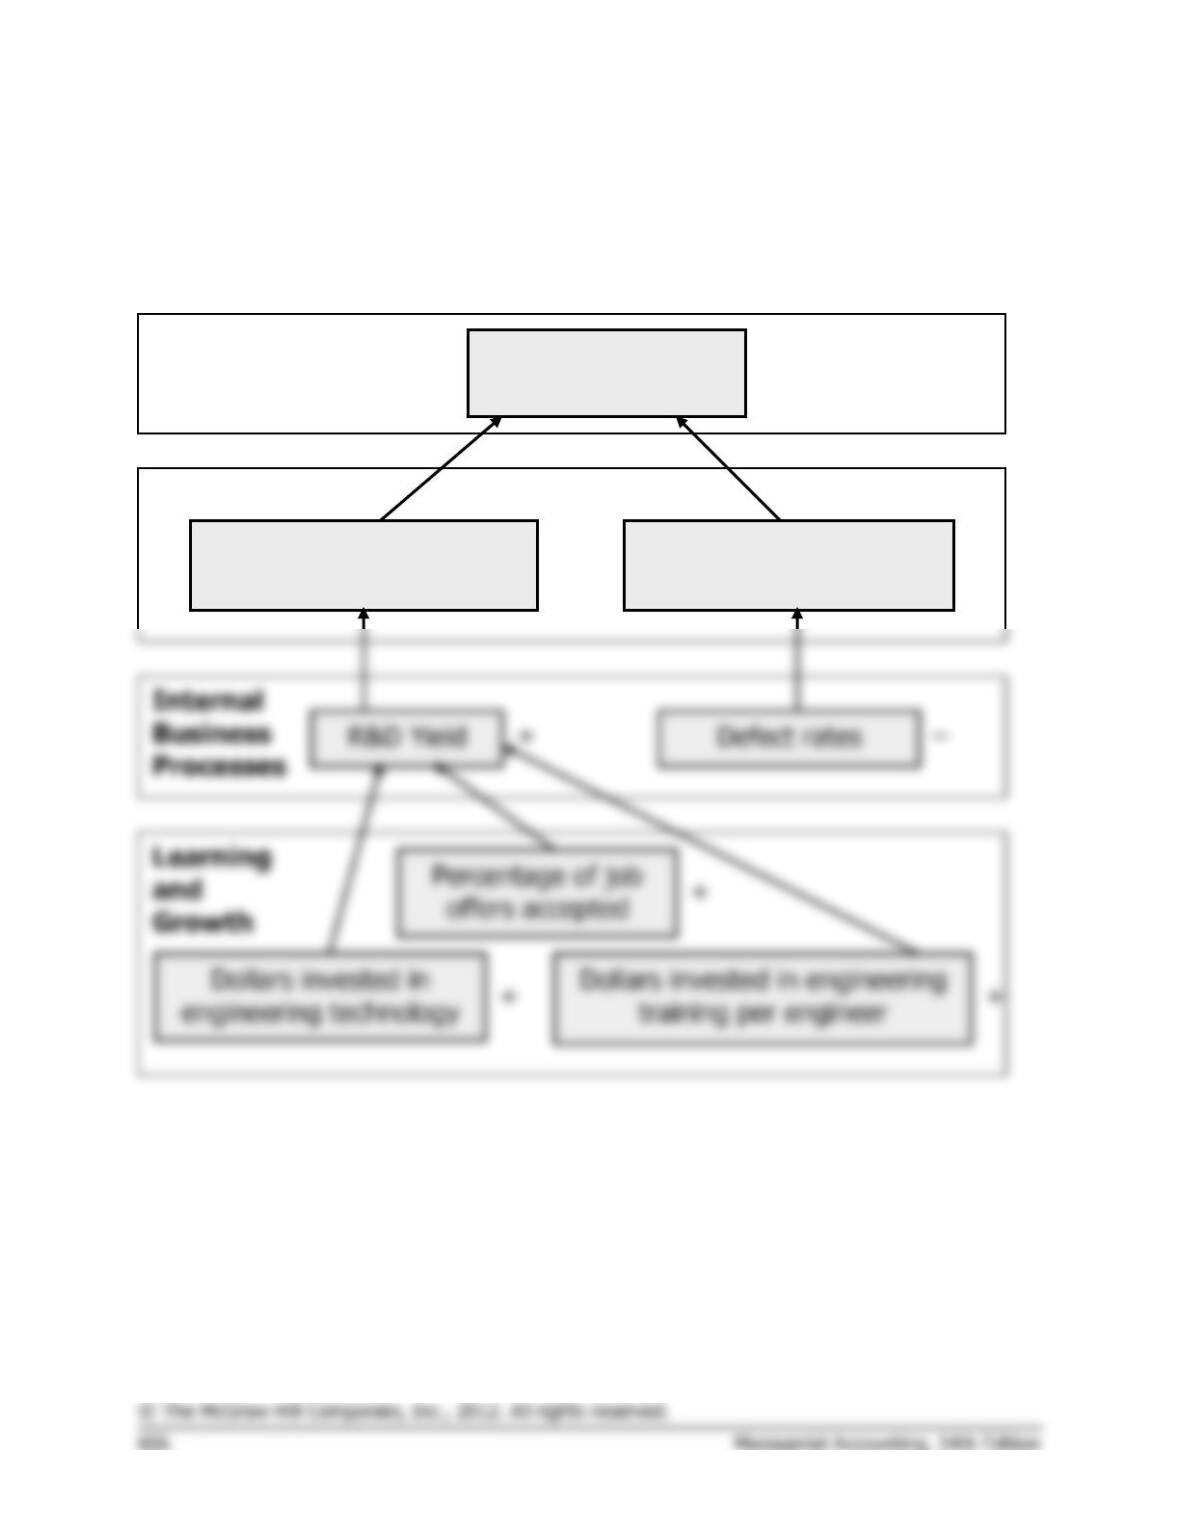
2. Students’ answers may differ in some details from this solution.
Applied Pharmaceuticals
Return on
Stockholders’ Equity
Financial
Customer perception of
first-to-market capability
Customer perception of
product quality
Customer
+
+
+
+
+
+
+
Problem 11-21 (continued)
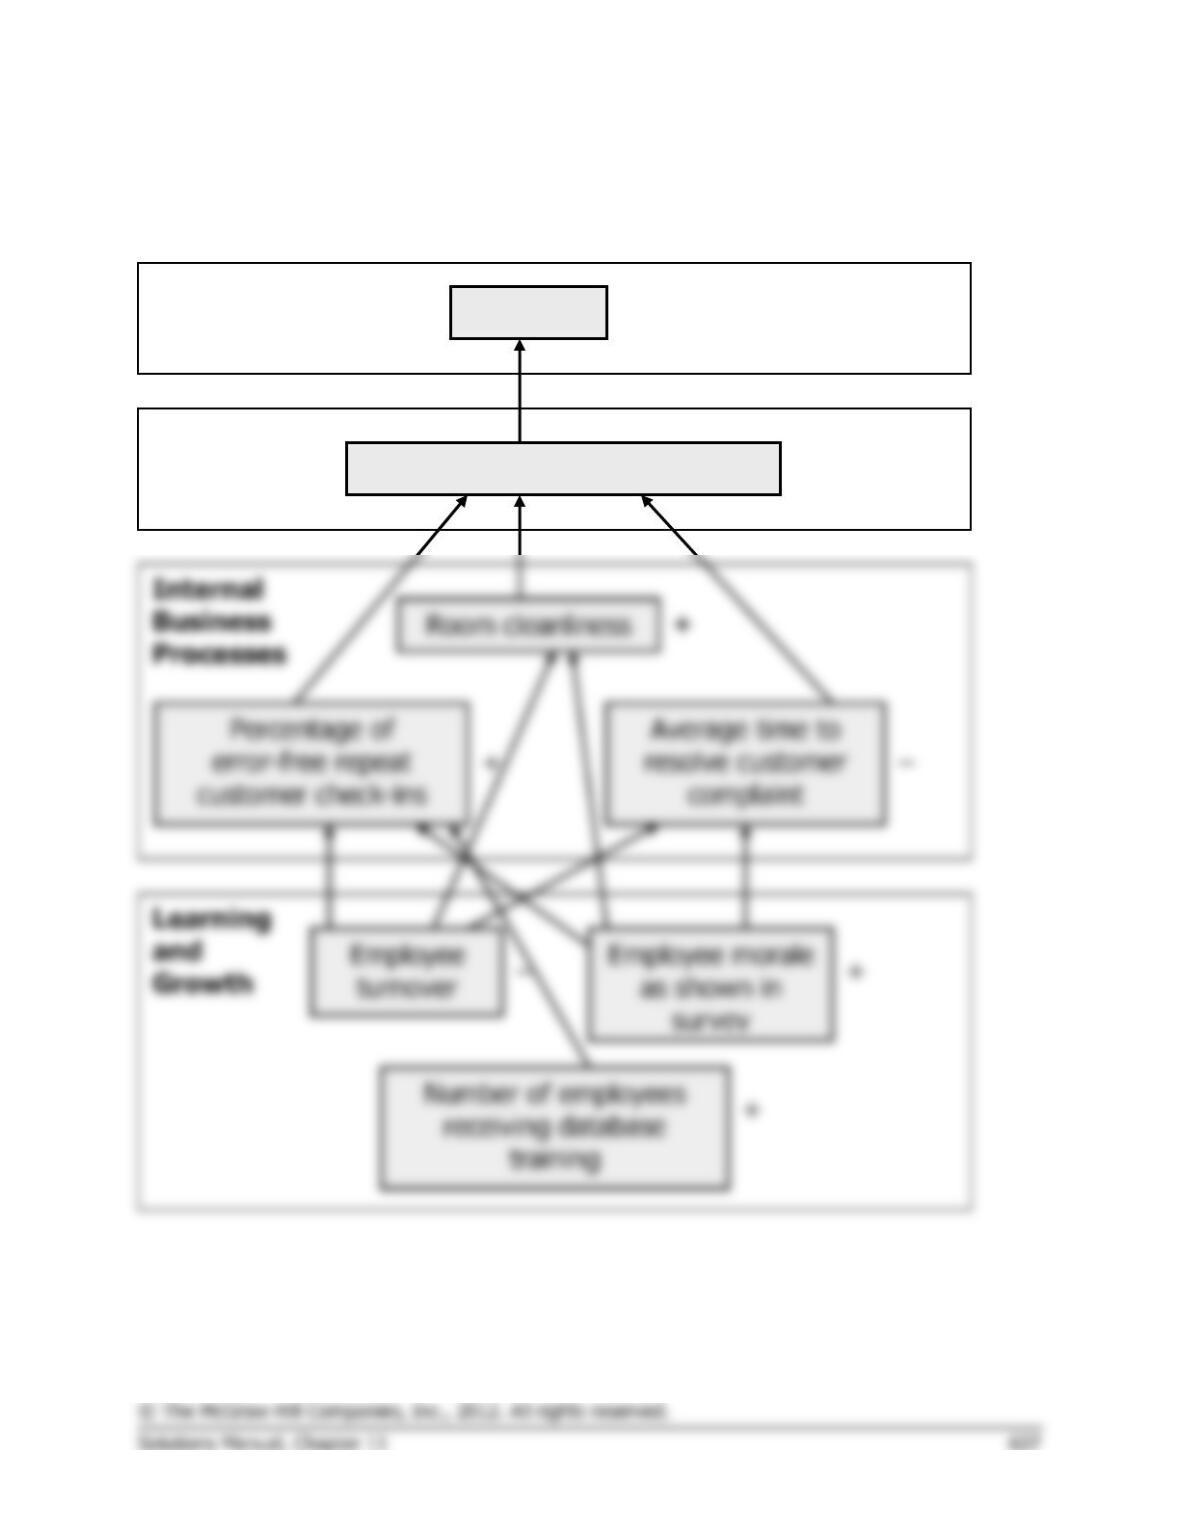
Destination Resorts International
Sales
Financial
Number of repeat customers
Customer
+
+
Problem 11-21 (continued)
3. The hypotheses underlying the balanced scorecards are indicated by the
arrows in each diagram. Reading from the bottom of each balanced
scorecard, the hypotheses are:
Applied Pharmaceuticals
o If the dollars invested in engineering technology increase, then the
then the return on stockholders’ equity will increase.
o If the customer perception of product quality increases, then the
return on stockholders’ equity will increase.
Destination Resort International
o If the employee turnover decreases, then the percentage of error-
free repeat customer check-ins and room cleanliness will increase
and the average time to resolve customer complaints will decrease.
o If the number of employees receiving database training increases,
then the percentage of error-free repeat customer check-ins will
increase.