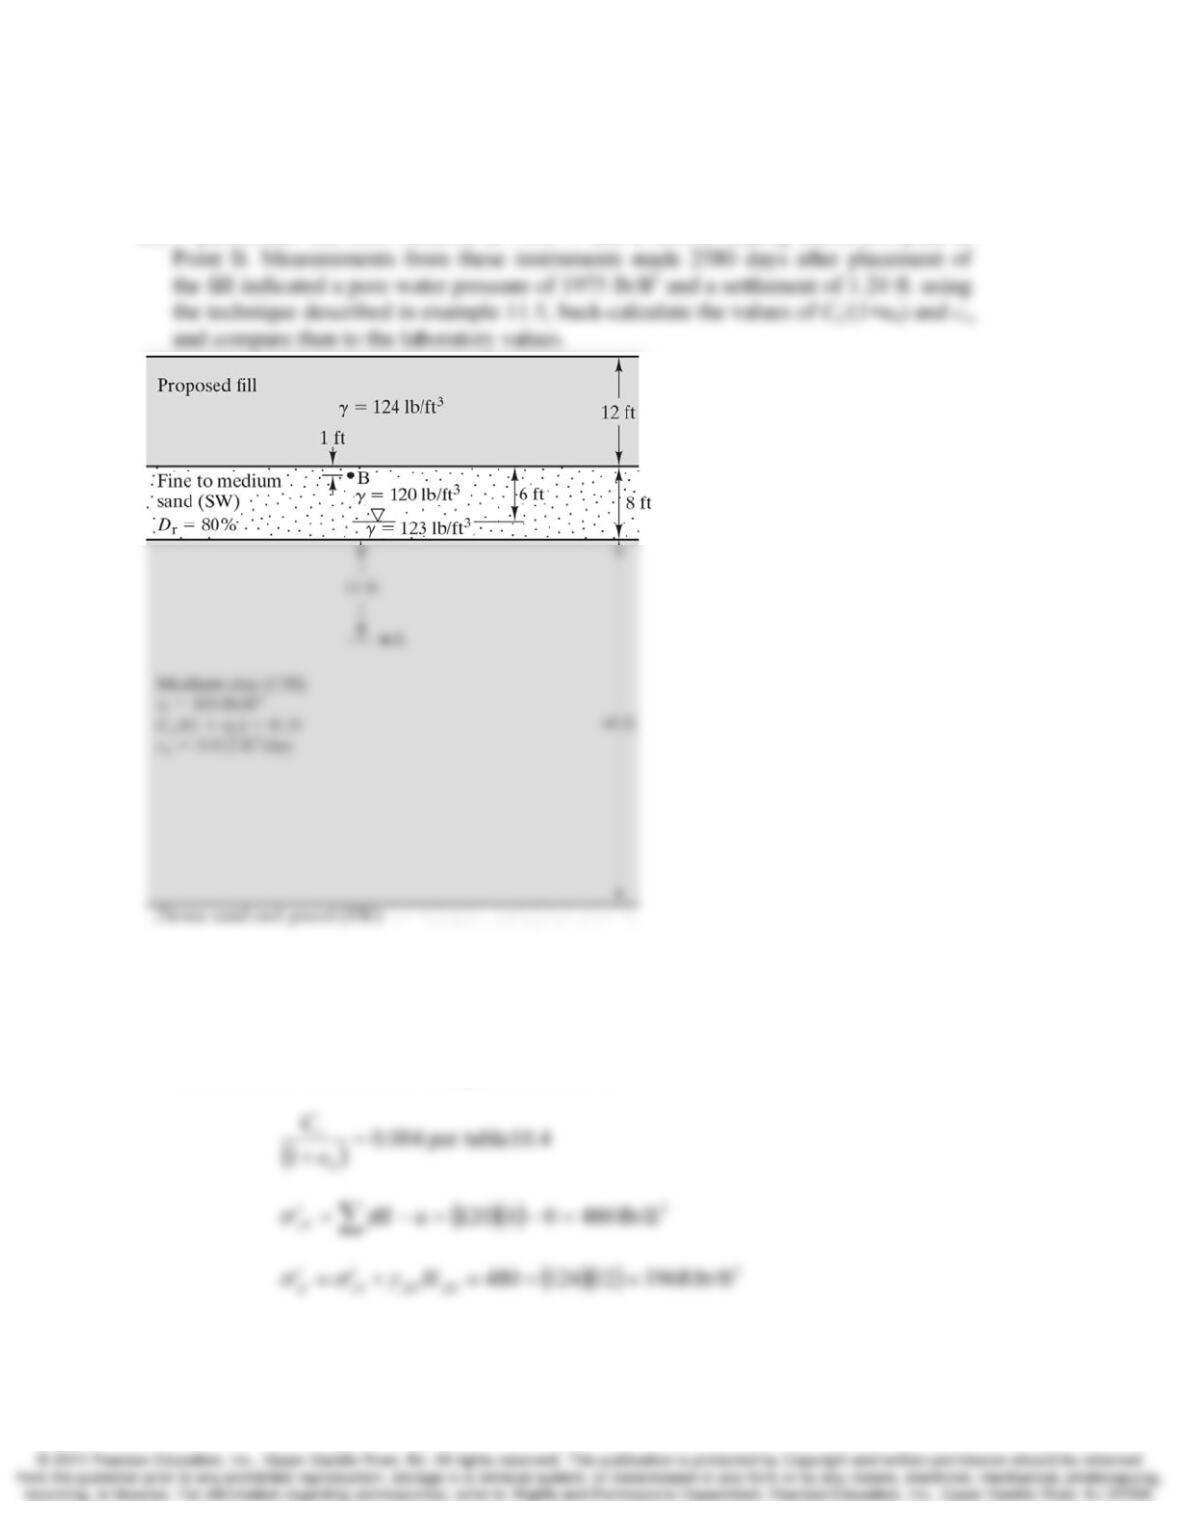
11-18 Rate of Consolidation Chap. 11
(a) Using the laboratory test results shown in this figure, develop a time-settlement plot.
Do not apply any correction for the construction period. The medium clay is normally
consolidated.
(b) A piezometer has been installed at Point A and a remote-reading settlement plate at
Figure 11.31 Soil profile for Problems 11.17, 11.18 and 11.31.
Solution
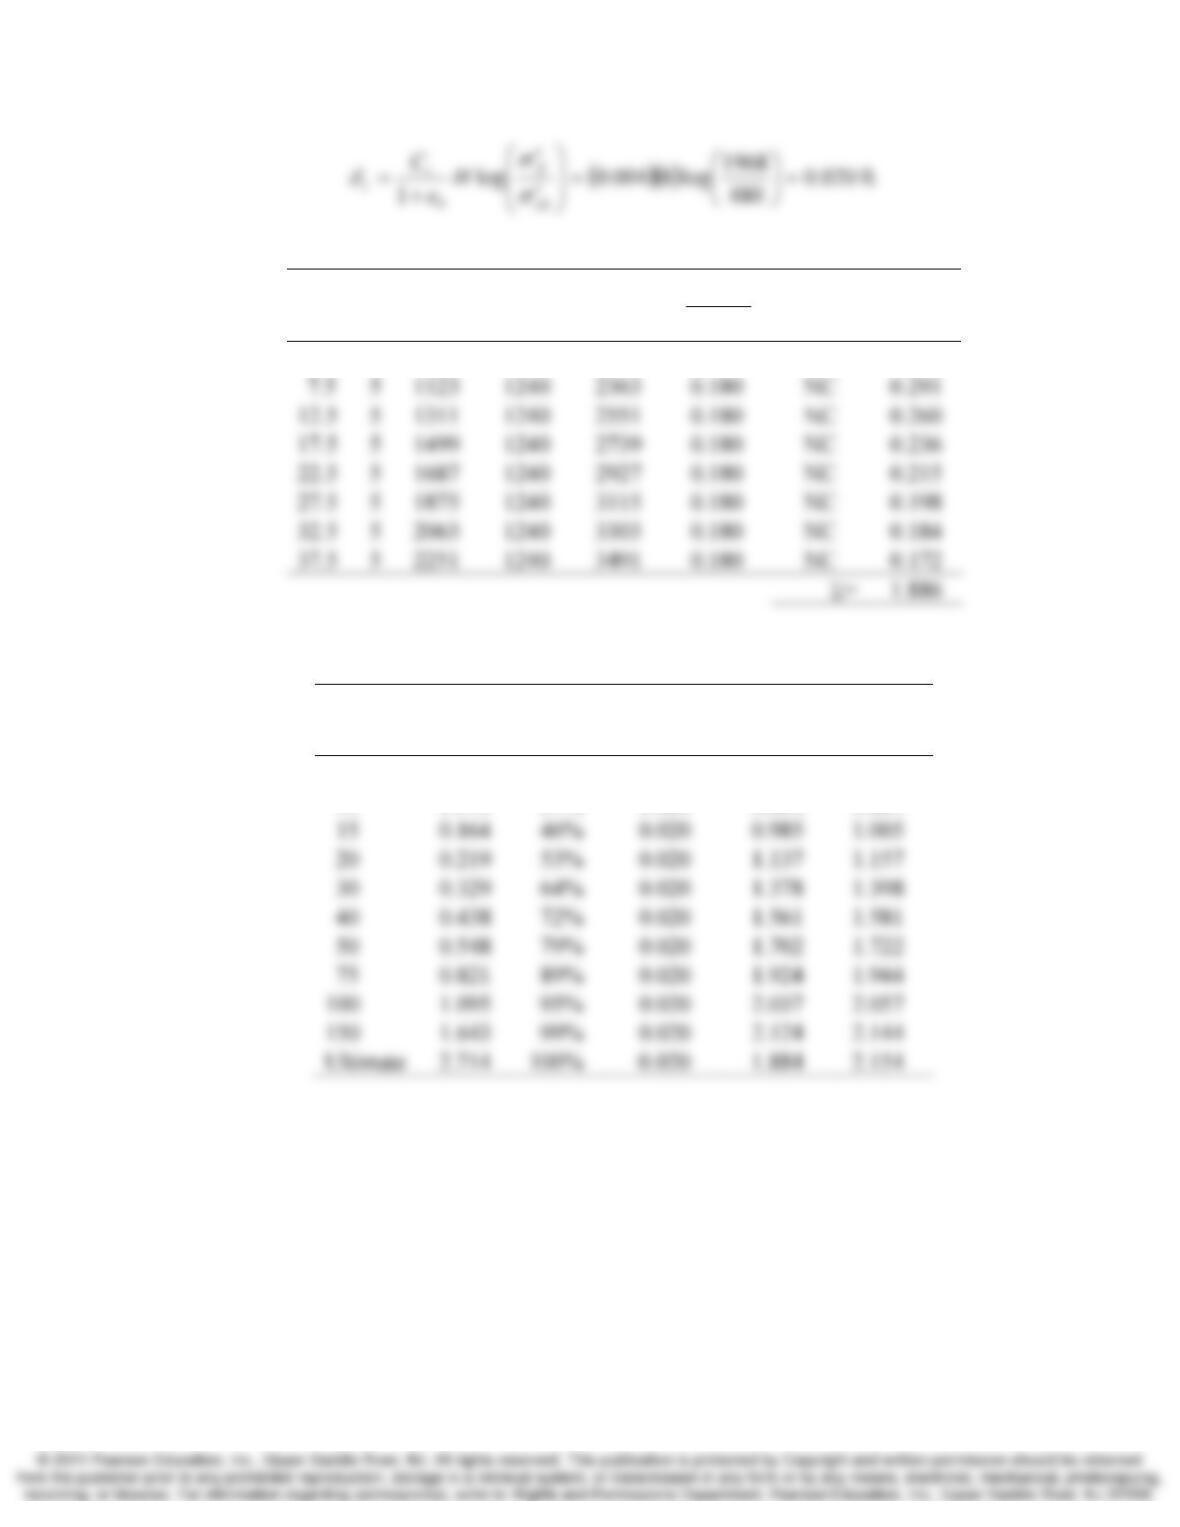
(a) The sand stratum will consolidate immediately upon placement of the fill. Its ultimate
consolidation settlement is computed as follows:
Chap. 11 Rate of Consolidation 11-19
Calculate ultimate consolidation using equation 11.20
z
(ft)
H
(ft)
σ‘z0
(lb/ft2)
Δσz
(lb/ft2)
σ‘z
(lb/ft2)
()
0
1e
Cc
+
Case δ (ft)
2.5 5 935 1240 2175 0.180 NC 0.330
Calculate consolidation settlement using the simplified solution
t (yrs) T
v U
δc in sand
(ft)
δc in clay
(ft) δc (ft)
5 0.055 26% 0.020 0.569 0.589
10 0.110 37% 0.020 0.804 0.824
11-20 Rate of Consolidation Chap. 11
b.
()
(
)
2
lb/ft 148812124 ===Δ fillfillz H
γσ
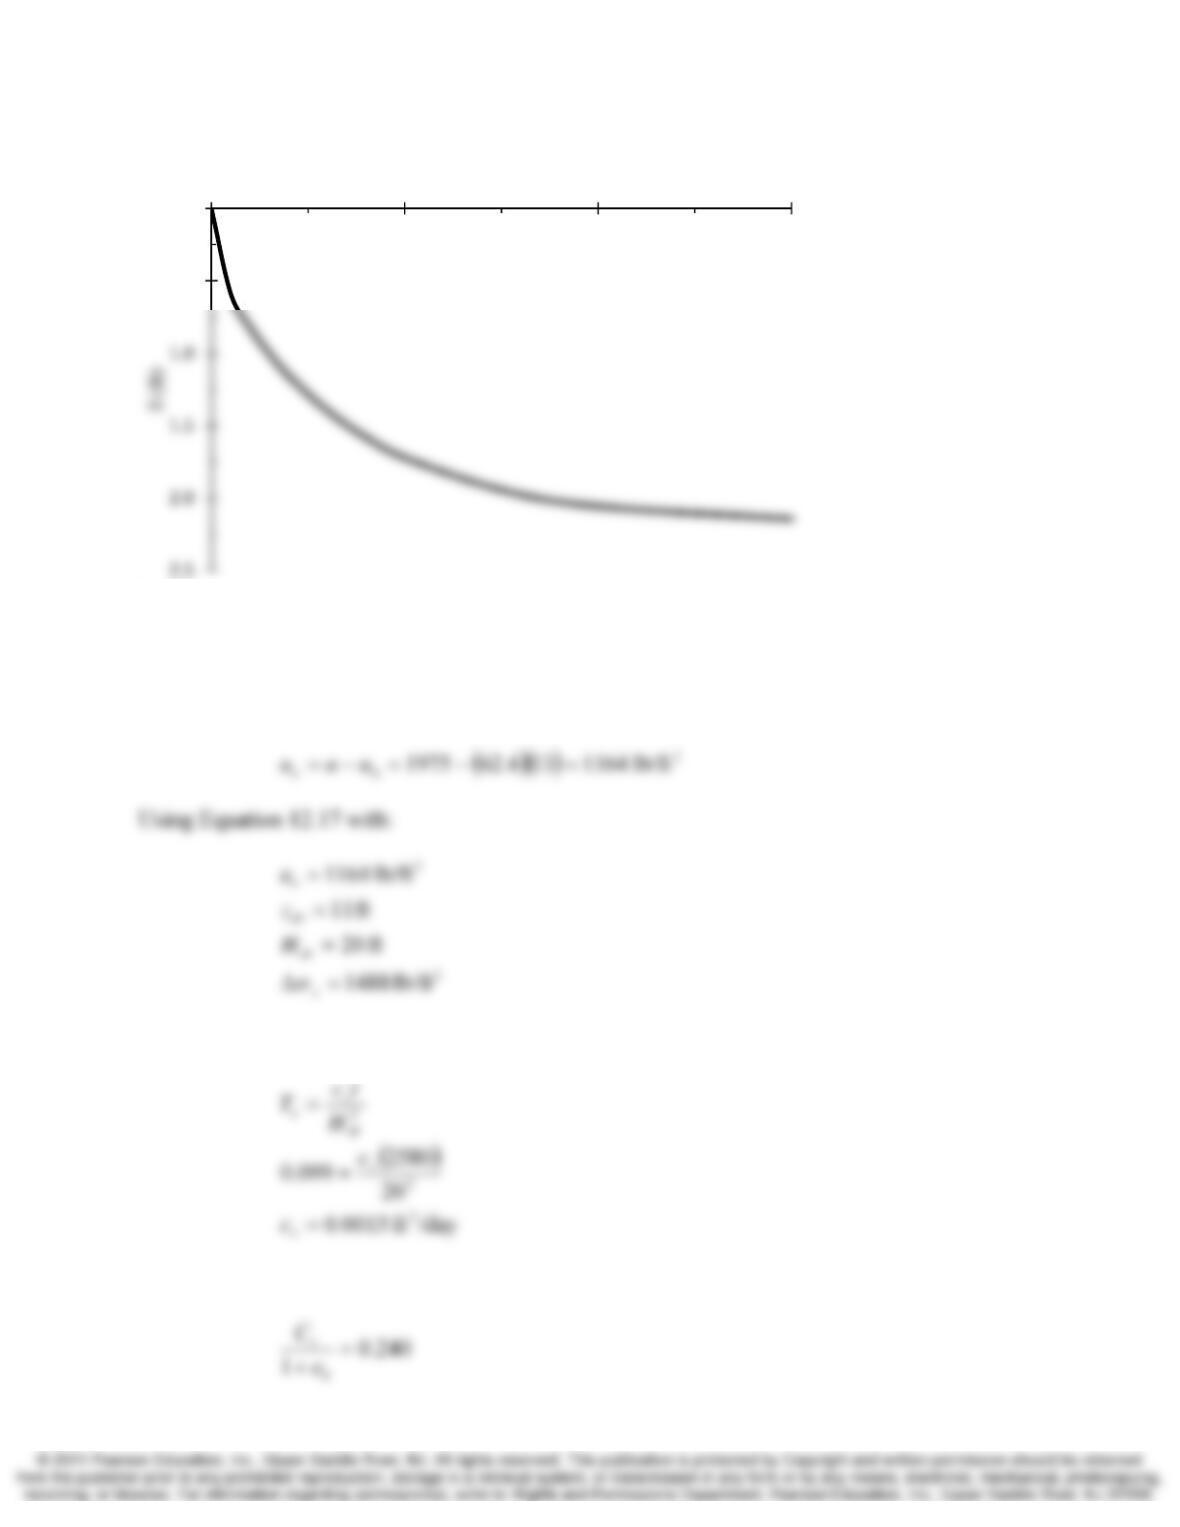
At point A:
gives Tv = 0.099
Using the Equation 11.20 with cv=0.015 ft2/day and δ = 1.20 ft gives:
0.0
0.5
0 50 100 150
t (yr)
Chap. 11 Rate of Consolidation 11-21
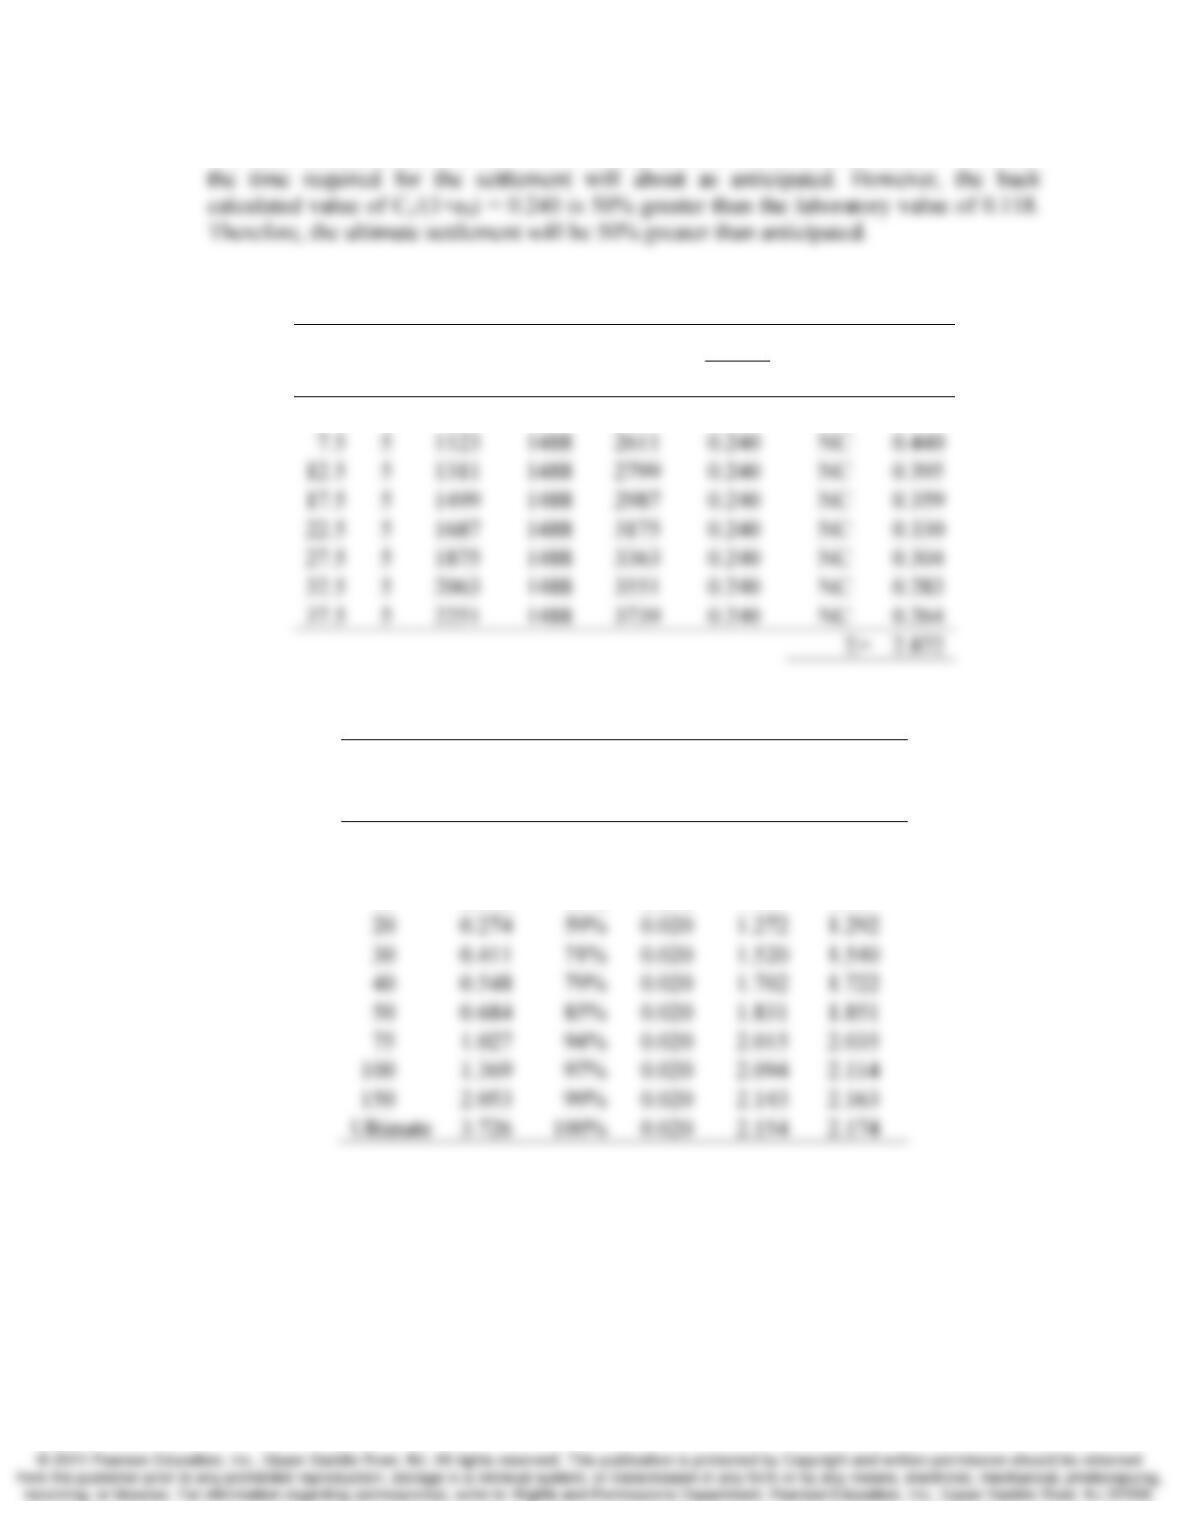
The back calculated value of cv = 0.015 is very close to the laboratory value of 0.012, so
Calculate ultimate consolidation settlement using Equation 11.20
z
(ft)
H
(ft)
σ‘z0
(lb/ft2)
Δσz
(lb/ft2)
σ‘z
(lb/ft2)
()
0
1e
Cc
+
CASE δ (ft)
2.5 5 935 1488 2423 0.240 NC 0.496
Calculate consolidation settlement using the simplified solution
t (yrs) T
v U
δ
c
in sand
(ft)
δ
c
in clay
(ft) δc (ft)
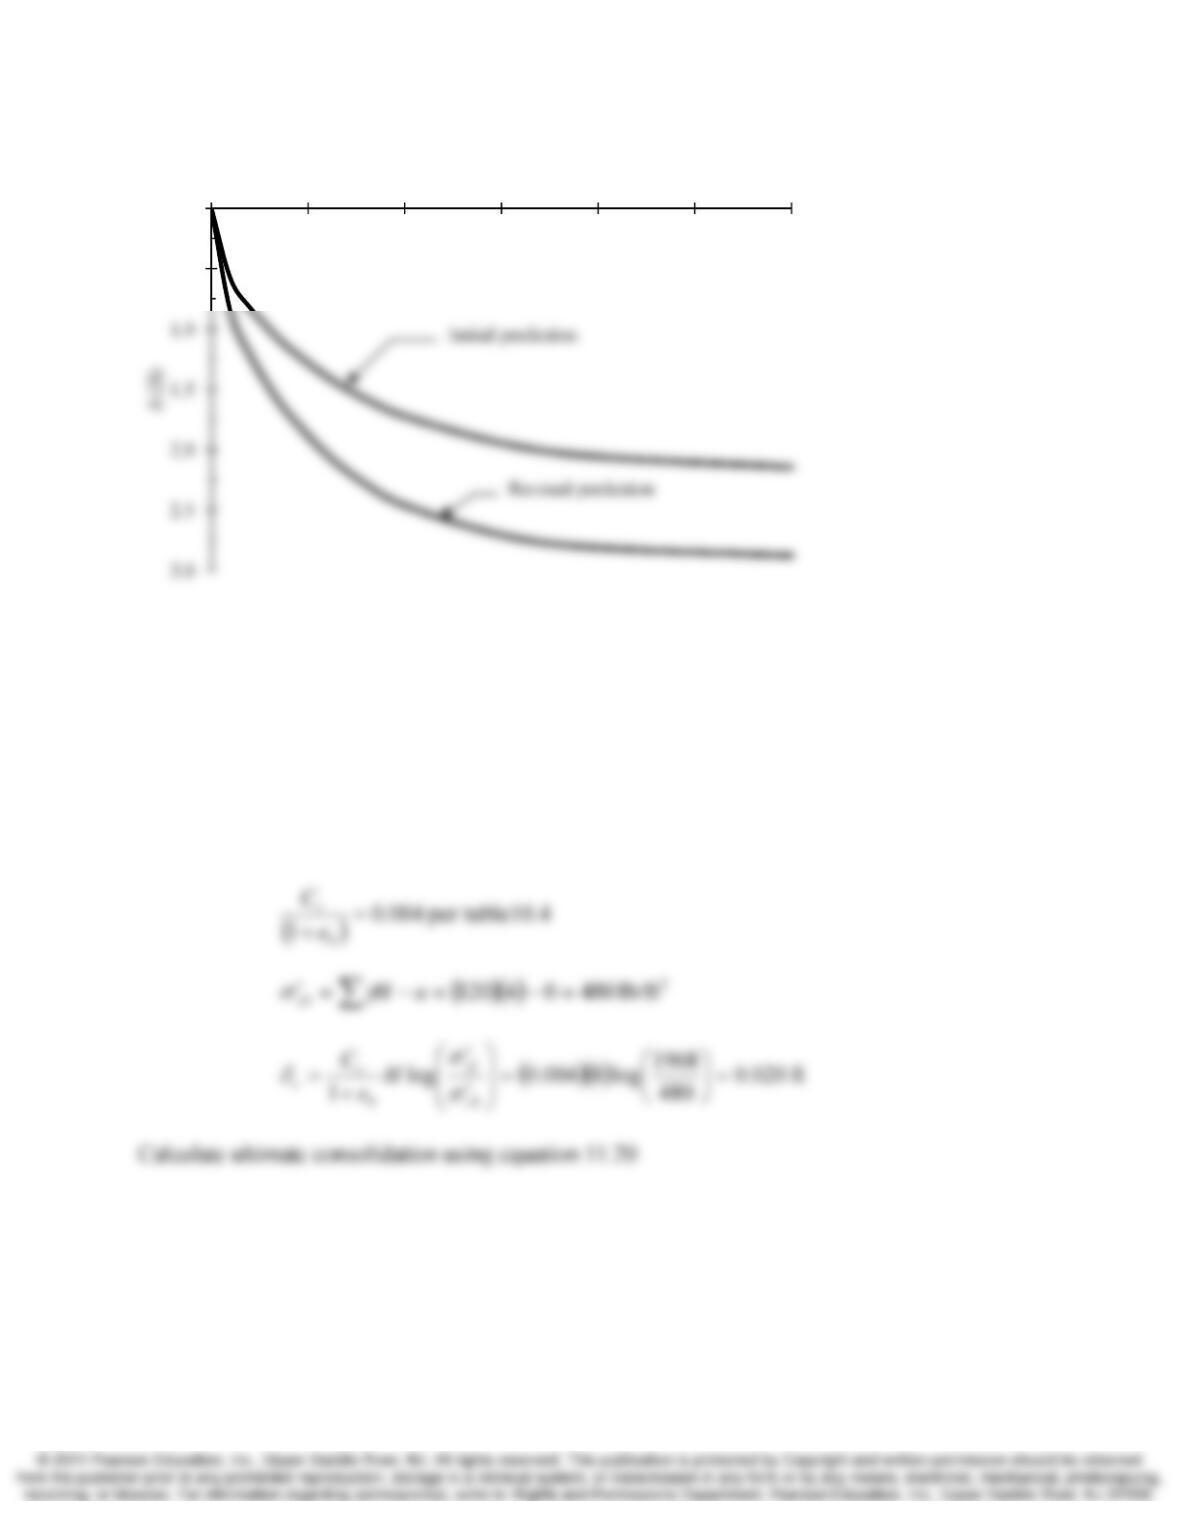
5 0.068 30% 0.020 0.636 0.656
10 0.137 42% 0.020 0.899 0.919
15 0.205 51% 0.020 1.101 1.121
11-22 Rate of Consolidation Chap. 11
Comprehensive
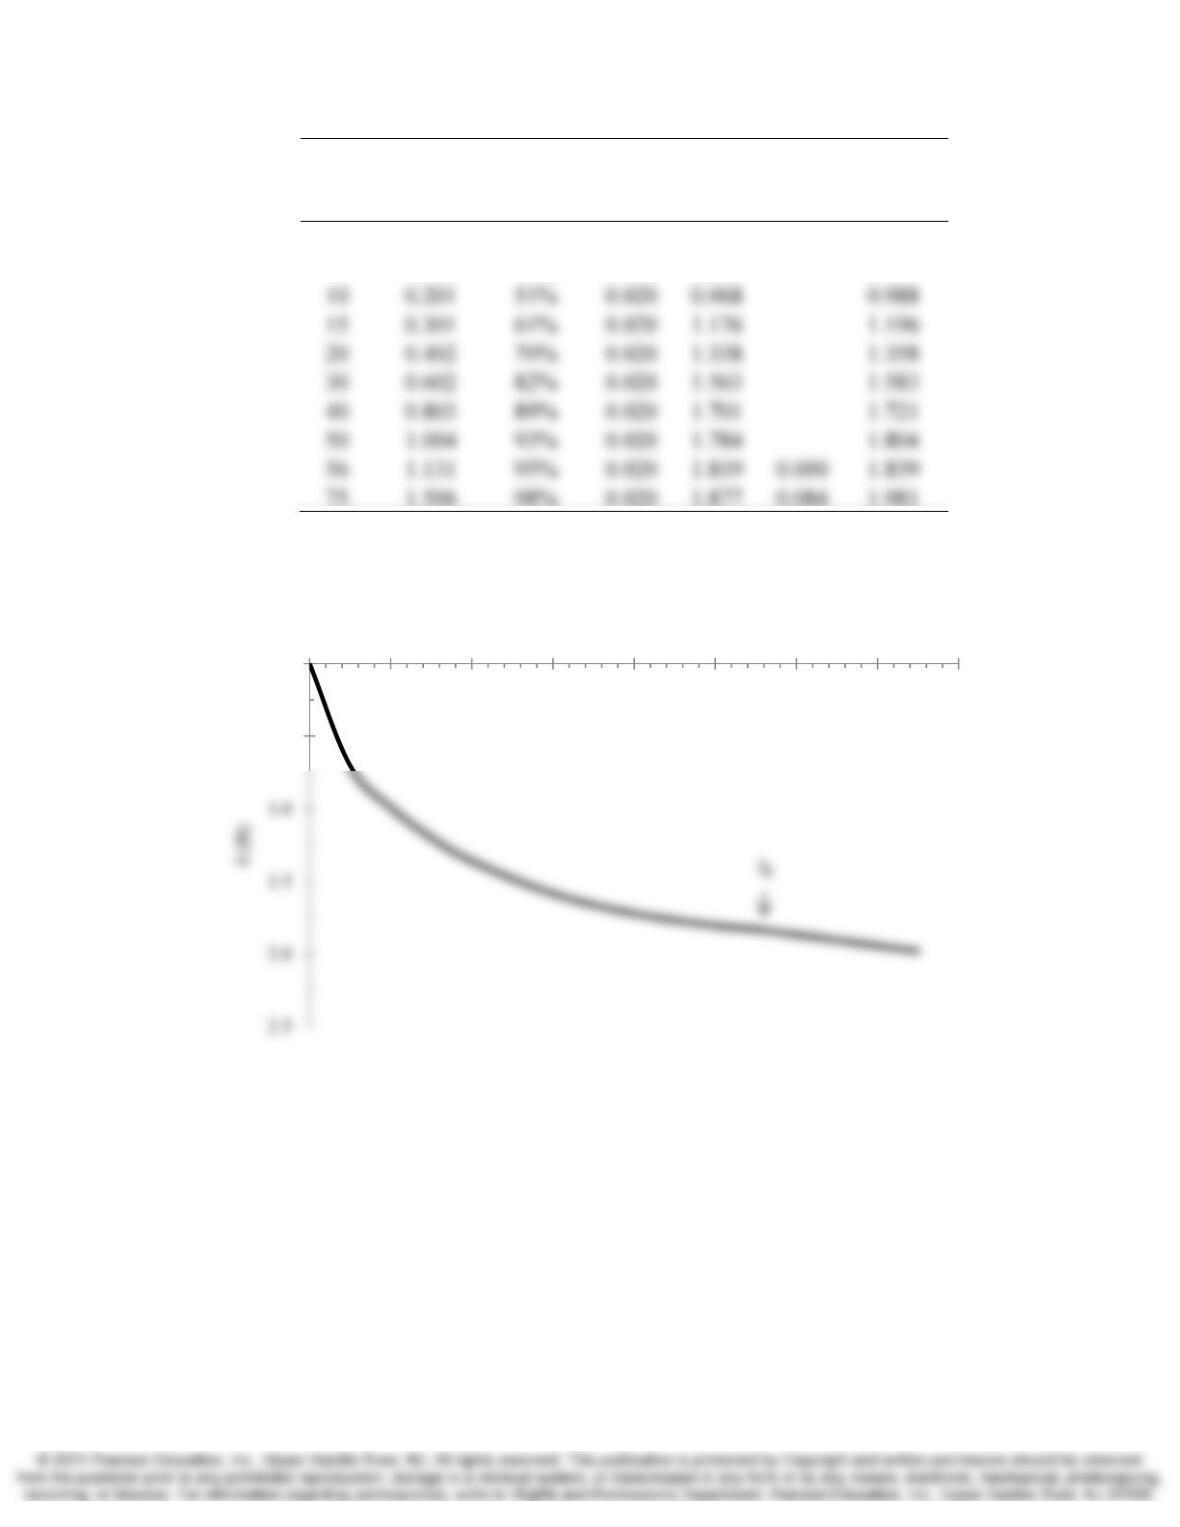
11.18 The clay stratum in Figure 11.31 has Cc/(1+e0) = 0.16, cv = 0.022, and Cα/(1+ep) = 0.017.
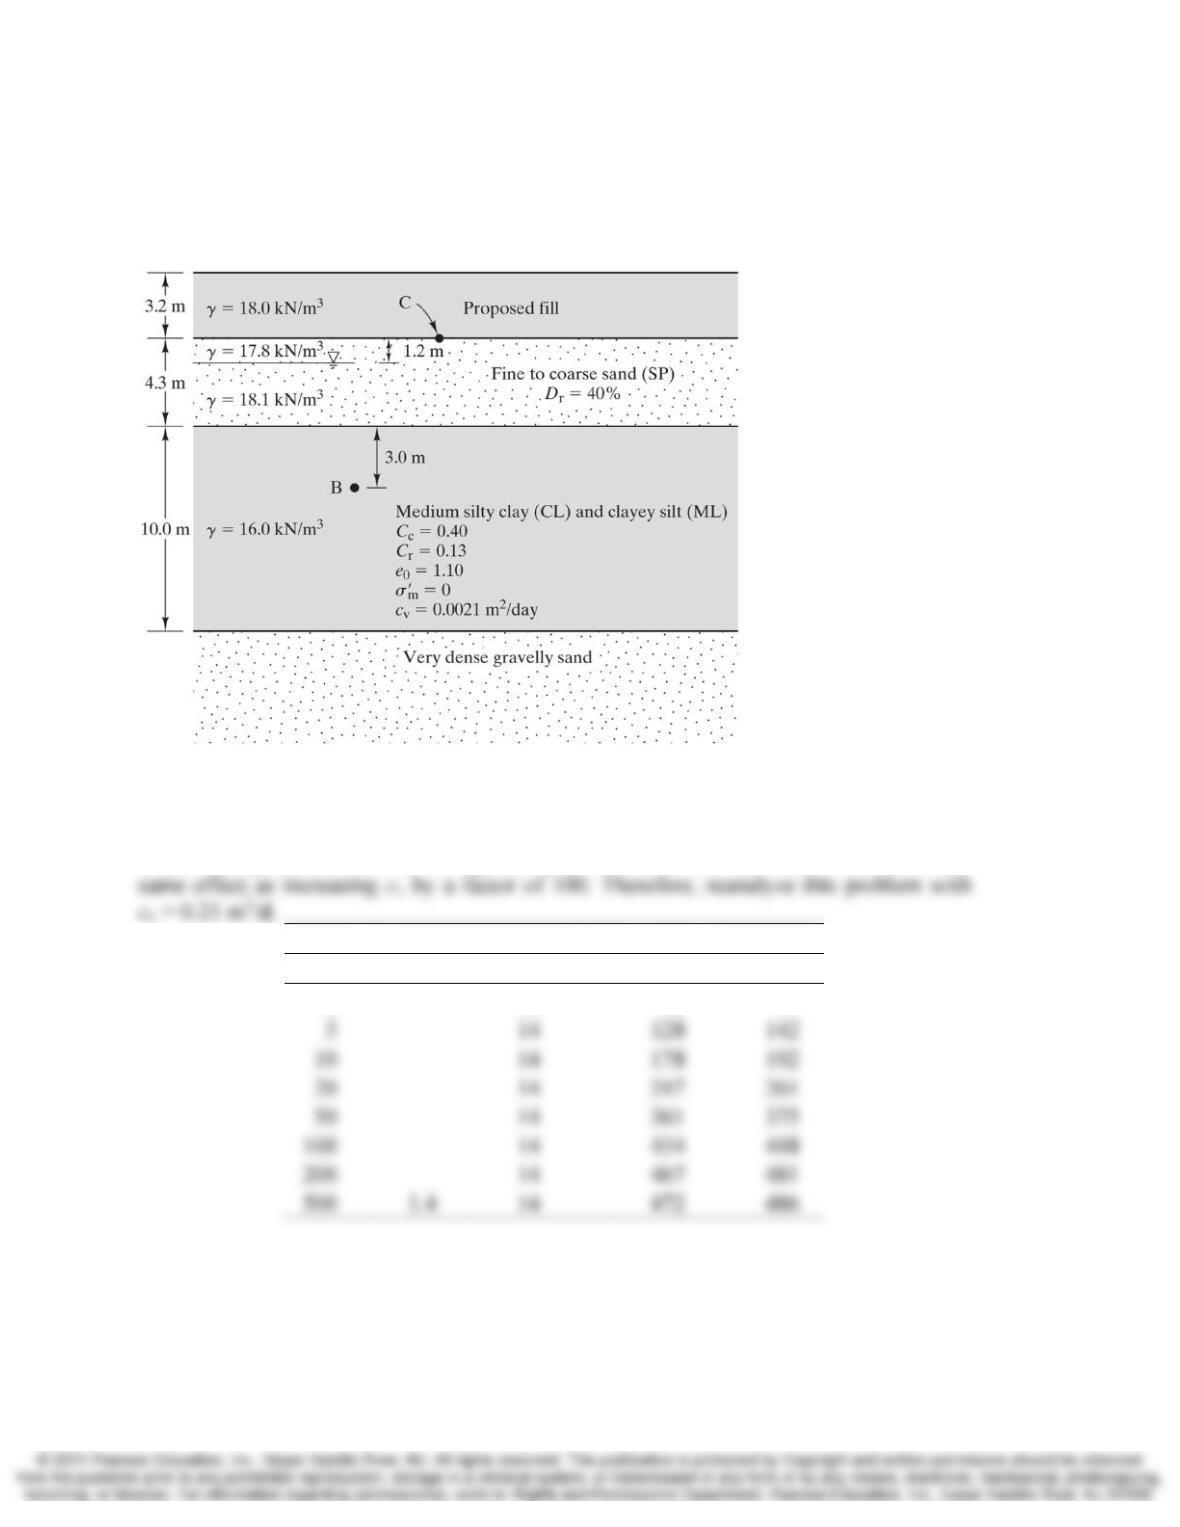
Develop a time-settlement plot for t = 0 to 75 years considering both consolidation and
secondary compression. Do not apply any correction for the construction period.
Solution
The sand stratum will consolidate immediately upon placement of the fill. Its ultimate
consolidation settlement is computed as follows:
0.0
0.5
0 25 50 75 100 125 150
t (yr)
Chap. 11 Rate of Consolidation 11-23
t (yrs) T
v U
δ
c
in sand
(ft)
δ
c
in clay
(ft)
δ
s
in clay
(ft) δc (ft)
0 0.000 0% 0.000 0.000 0.000
5 0.100 36% 0.020 0.684 0.704
Take end of primary to be at 95% consolidation.
0.0
0.5
0 1020304050607080
t (yr)
11-24 Rate of Consolidation Chap. 11
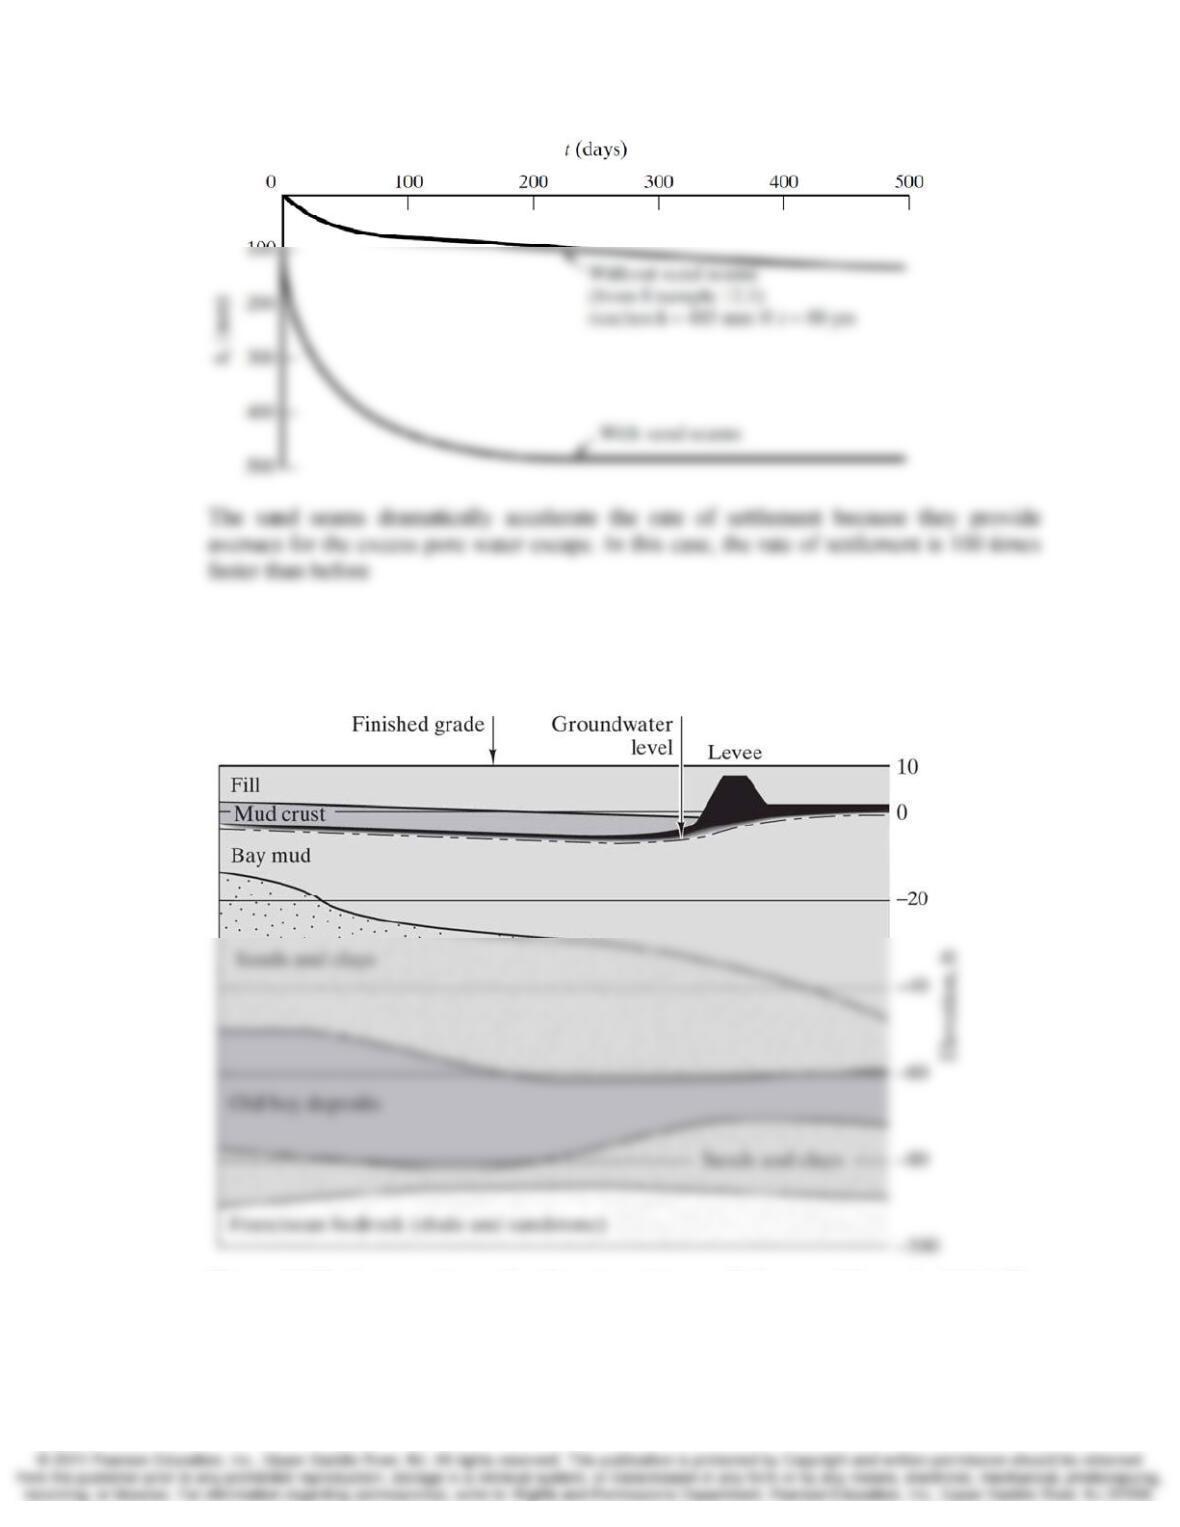
11.19 The CL/ML stratum in Figure 11.7 contains thin horizontal sand seams spaced about 1 m
apart. Using this new information, reevaluate the computation in Example 11.3 and
develop a revised time-settlement plot. Compare this plot with the ones in Figure 11.8
and explain why they are different
Figure 11.7 Soil profile for Example 11.3.
Solution
Based on Equation 11.18, decreasing Hdr from 5 to 0.5 m (i.e. by a factor of 10) has the
Time Settlement (mm)
(days) (years) Sand Strata Clay Strata Total
2 14 82 96
Chap. 11 Rate of Consolidation 11-25
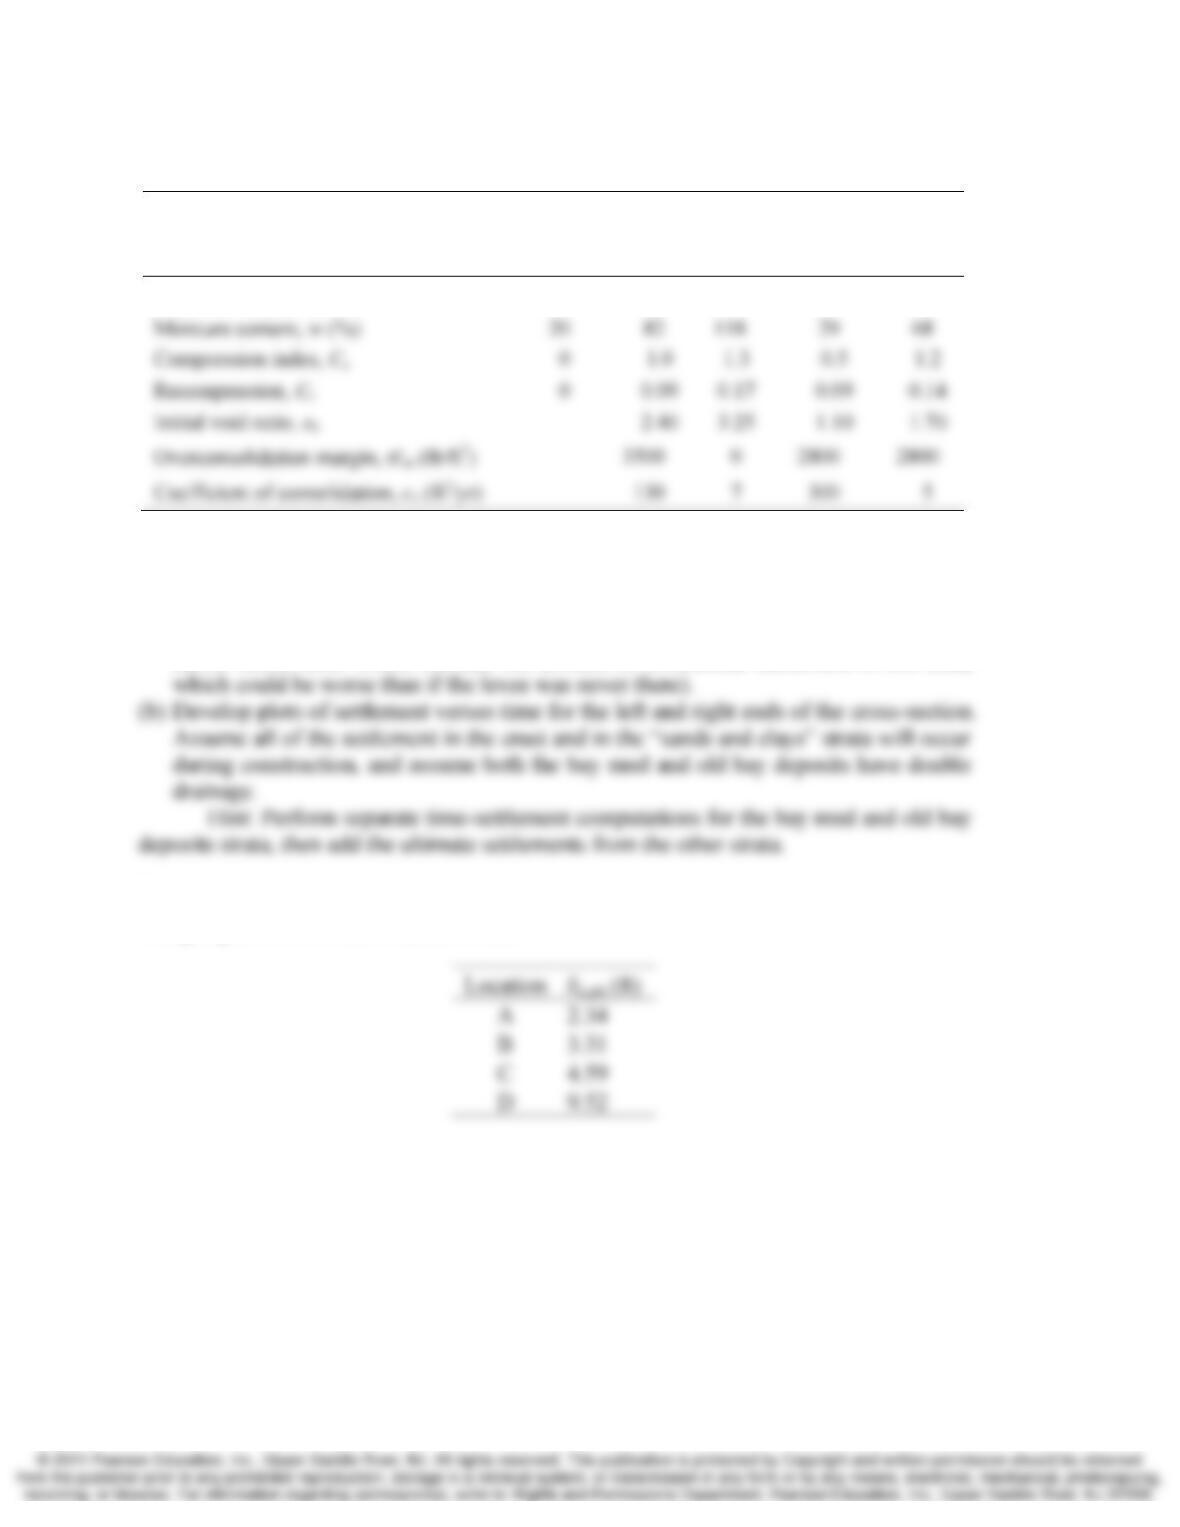
11.20 Most of the international airport is San Francisco, California, is built on fill placed in San
Francisco Bay. A cross-section through one portion of the airport is shown in Figure
11.32.
Figure 11.32 Cross-section at San Francisco Airport. (Roberts and Darragh, 1962.) The
groundwater table is indicated by the dashed line.
11-26 Rate of Consolidation Chap. 11
The engineering properties of these soils are approximately as follows:
Fill
and
Levee
Bay
Mud
Crust
Bay
Mud
Sands
and
Clays
Old Bay
Deposits
Dry unit weight, γd (lb/ft3) 108 49 40 80 61
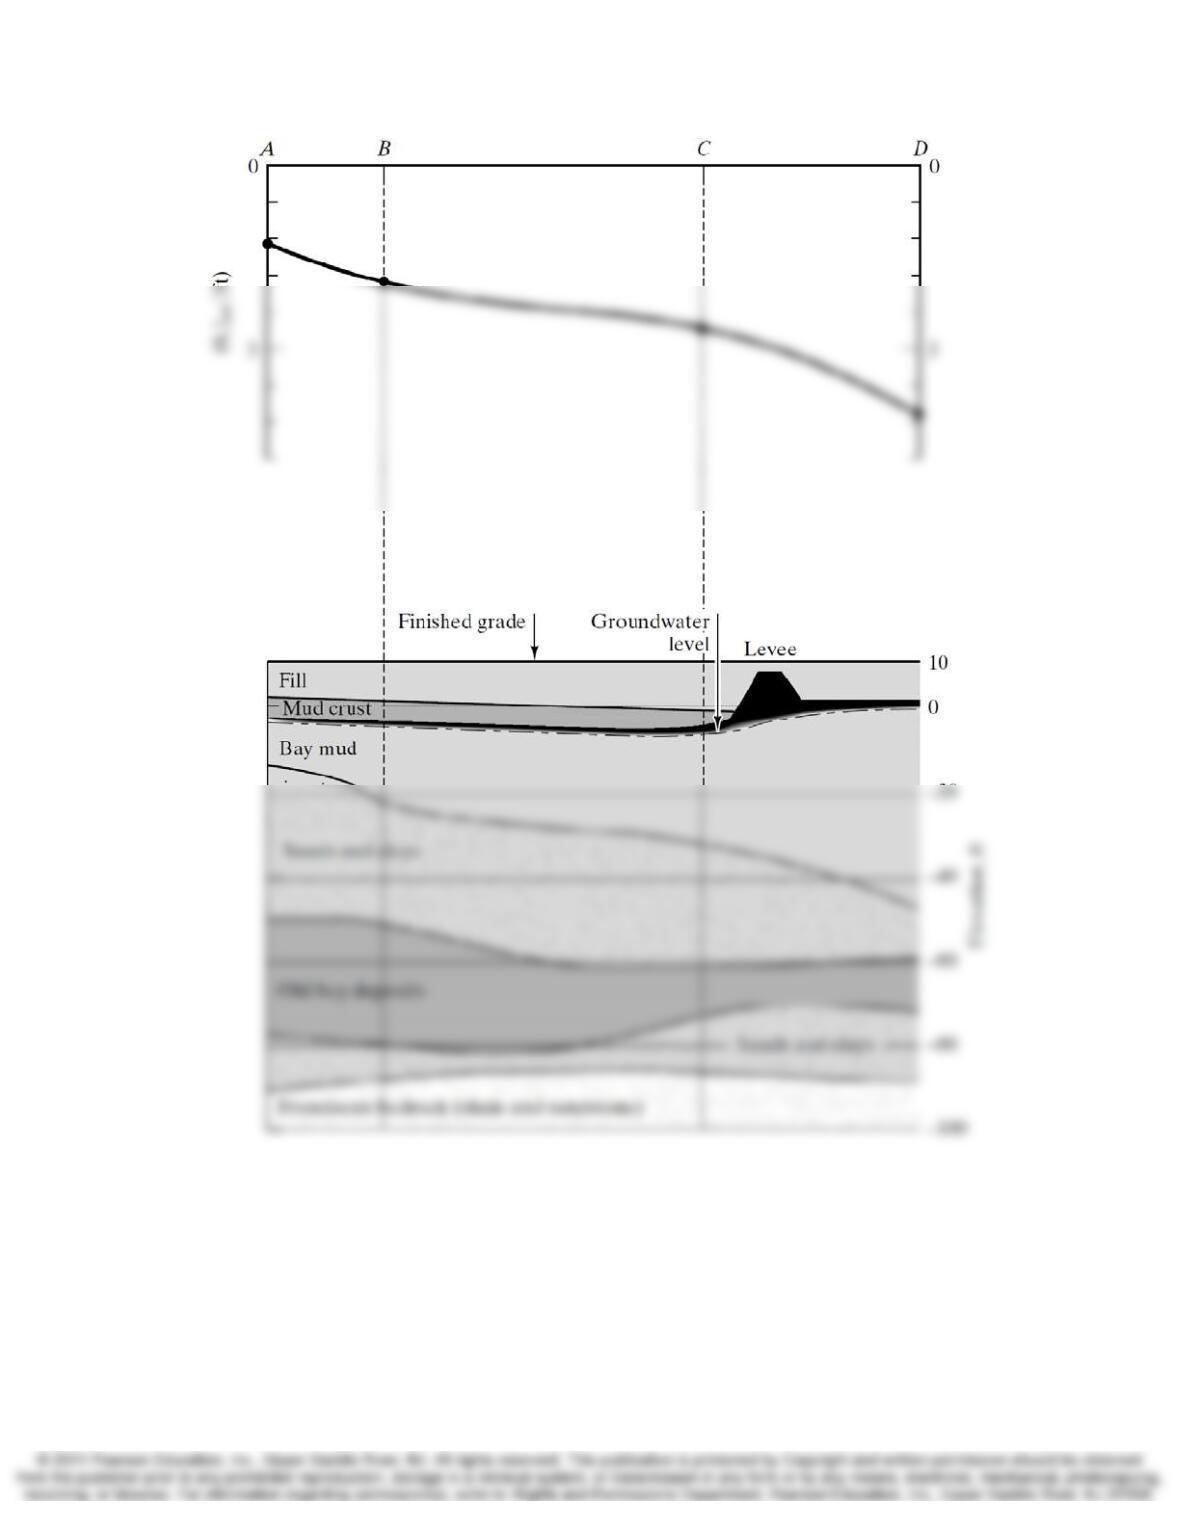
(a) Compute the ultimate consolidation settlement at various points along the cross-
section. Then develop a plot of ultimate consolidation settlement versus horizontal
position. When performing these computations, ignore the presence of the levee and
any consolidation that may have already occurred due to its weight (in reality, these
earlier settlements would increase the amount of differential settlement in this area,
Solution
Using Equations 11.20, 11.21, and 11.22:
Chap. 11 Rate of Consolidation 11-27
11-28 Rate of Consolidation Chap. 11
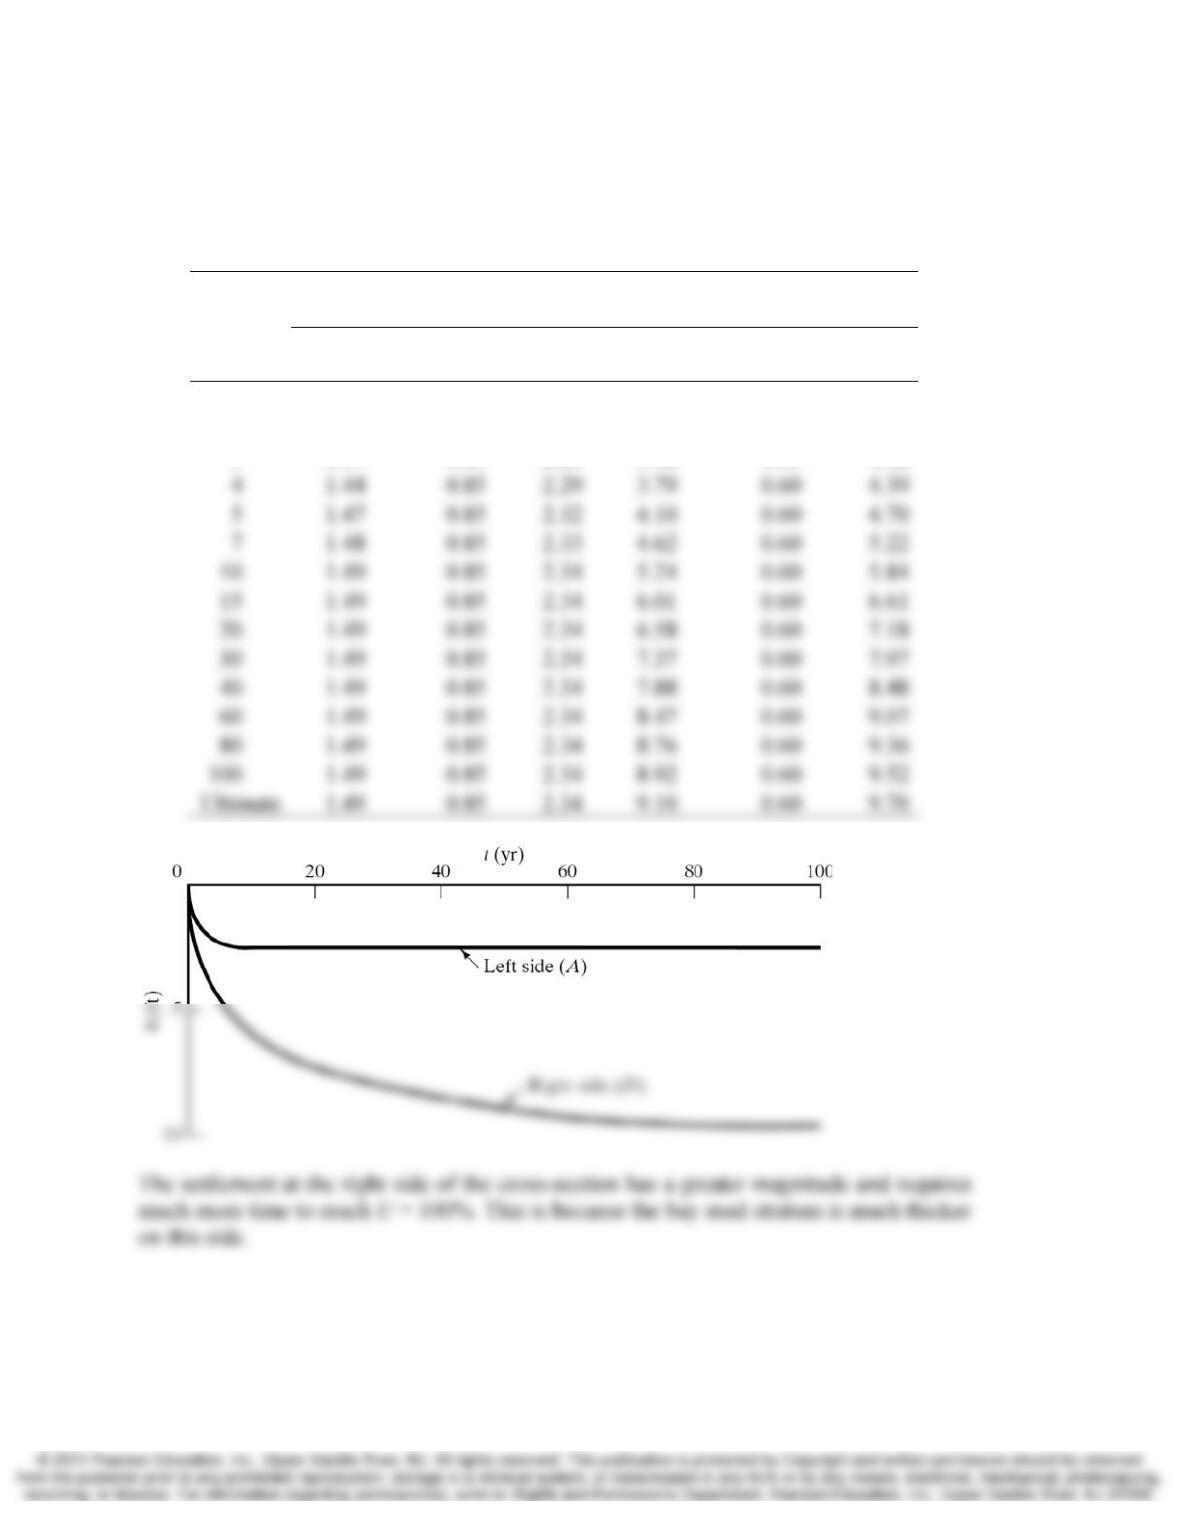
(c) Per consolidation analysis, the vast majority of the settlement occurs in the bay mud
stratum. Therefore, for time-settlement computations, assume the settlement in all the
other strata occurs immediately after the fill is placed.
t (yrs)
δc at left side of cross section
(ft)
δ
c at right side of cross section
(ft)
Bay
Mud Other Strata Total
Bay
Mud Other Strata Total
1 1.04 0.85 1.89 2.32 0.60 2.92
2 1.29 0.85 2.14 2.97 0.60 3.57
3 1.39 0.85 2.24 3.42 0.60 4.02

Chap. 11 Rate of Consolidation 11-29
11.21 The information presented in Figure 11.31 has the following uncertainties:
Depth to bottom of proposed fill ±1 ft
Depth to bottom of SW stratum ±1 ft
Depth to bottom of CH stratum ±2ft
Unit weights ±10%
Relative density ±15% (i.e., Dr = 68-92%)
Cc/(1+e0) ±20%
cv ±35%
Considering these tolerances, compute the lower bound solution and upper bound
solution for δc at t = 10 yr and δc,ult. The lower bound solution is that which uses the best
possible combination of factors, while the upper bound uses the worst possible
combination.
Solution
Parameter
Lower
Bound Average
Upper
Bound
Depth to bottom of fill (ft) 11 12 13
Depth to bottom of SW (ft) 21 20 19
Depth to bottom of CH (ft) 59 60 61
11-30 Rate of Consolidation Chap. 11
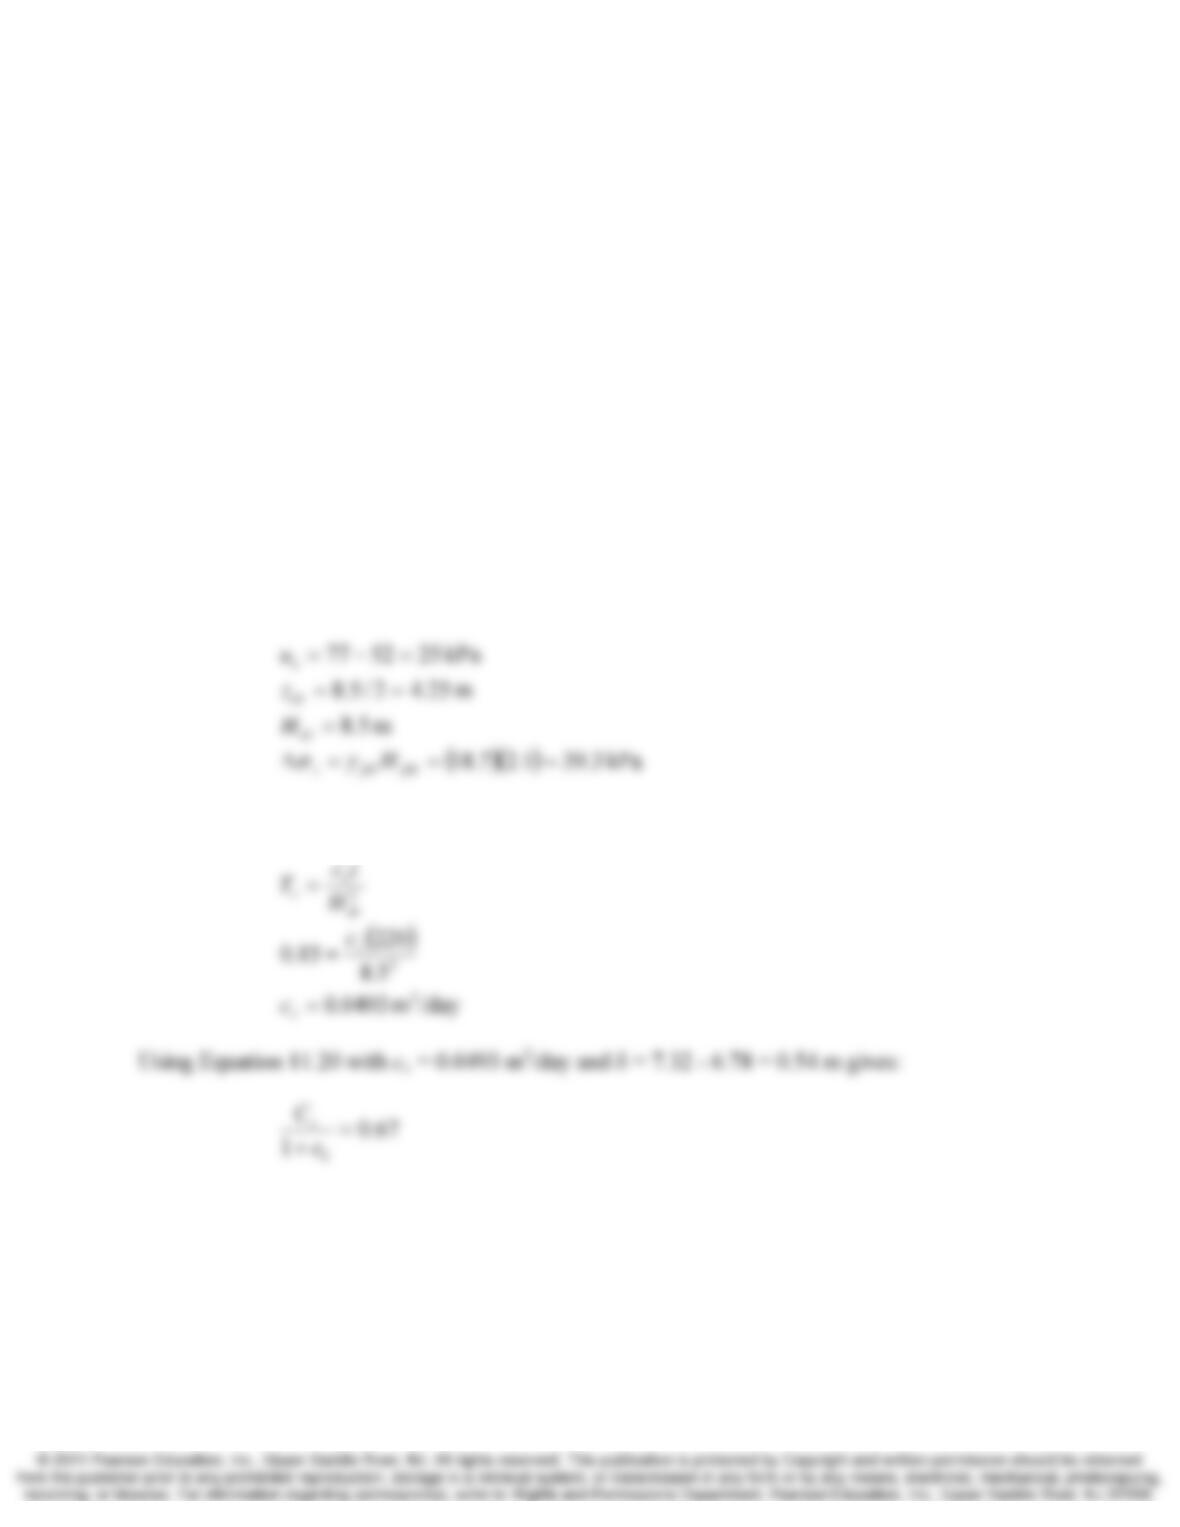
11.22 The soil profile at a certain site includes an 8.5-m thick stratum of saturated normally
consolidated medium silty clay. This soil has a unit weight of 16.4 kN/m3. A remote
reading settlement plate has been installed a short distance below the natural ground
surface and a remote reading piezometer has been installed at the midpoint of the silty
clay. The initial readings from these instruments indicate a ground surface elevation of
7.32 m and a pore water pressure of 52 kPa. The initial vertical effective stress at the top
of the silty clay stratum was 50 kPa.
Then a 2.1-m deep fill with a unit weight of 18.7 kN/m3 was placed on this site. A
second set of readings made 220 days after placement of this fill indicate an elevation of
6.78 m and a pore water pressure of 77 kPa. Assuming all of the other soil strata are
incompressible, and single drainage conditions exist in the silty clay, compute the values
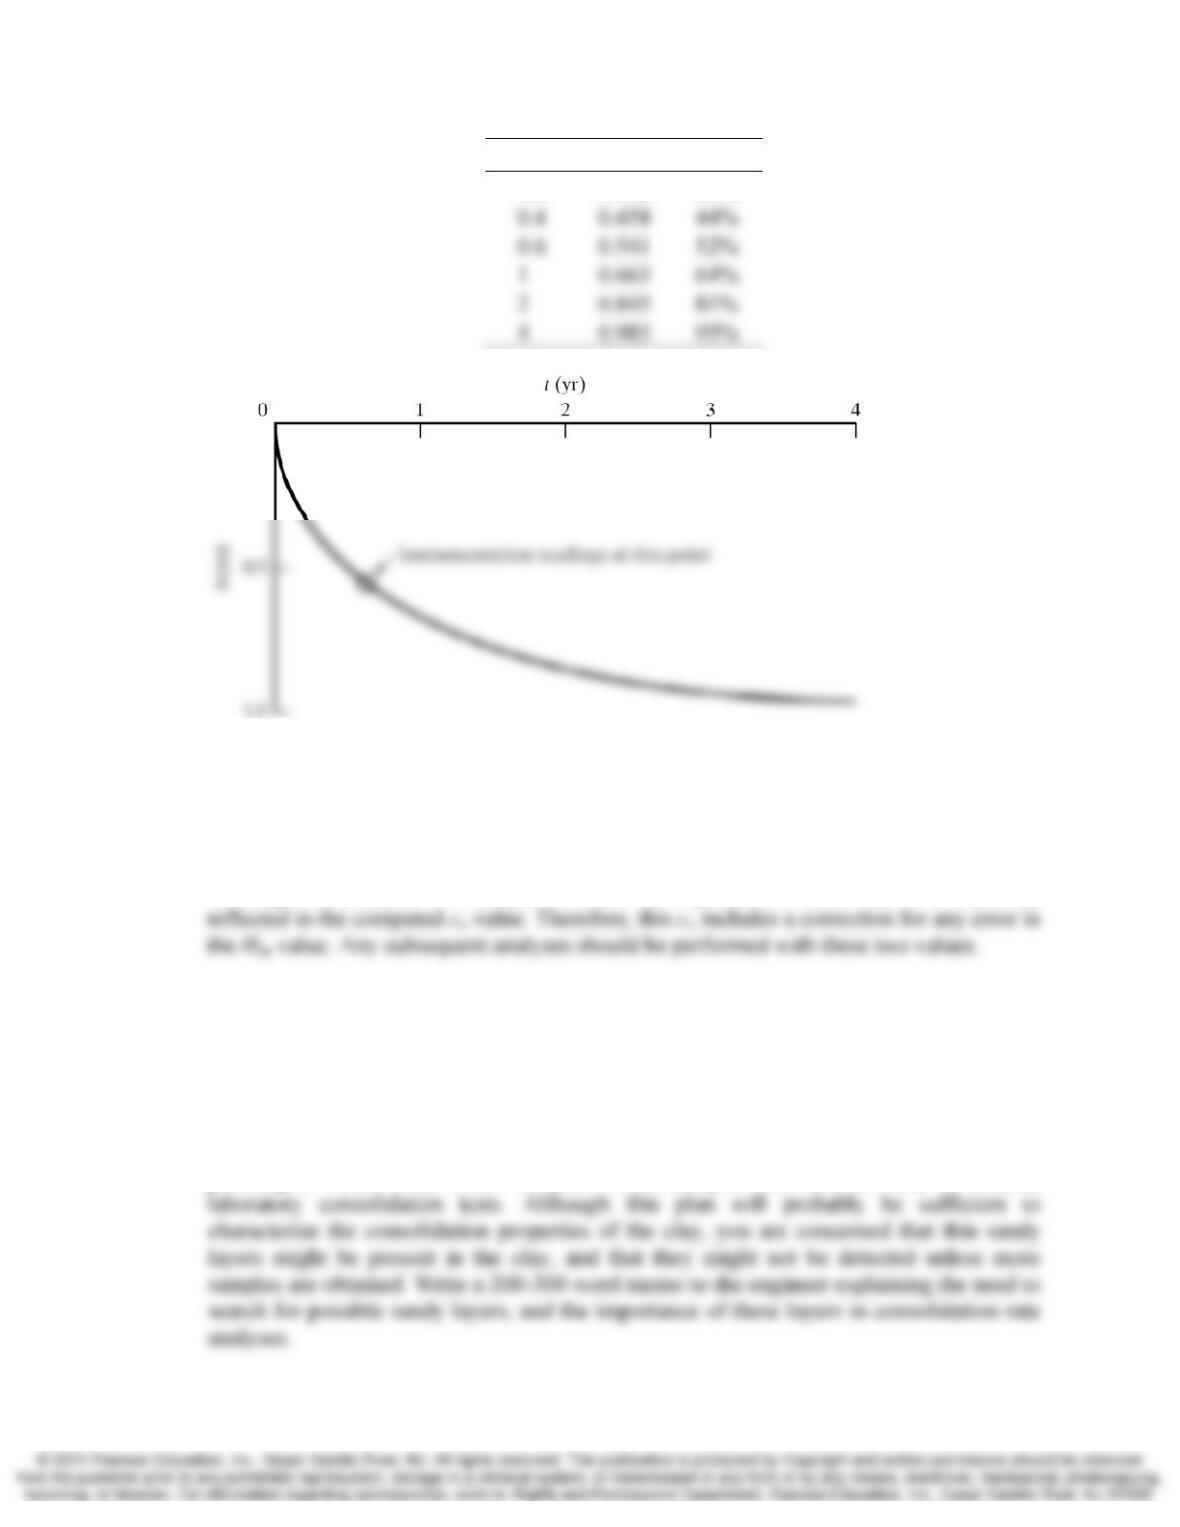
of Cc/(1+e0) and cv, then develop a plot of consolidation settlement versus time. This plot
should extend form U = 0% to U = 95%. Finally, mark the point on this plot that
represents the conditions present when the second set of readings was made.
Solution
Using Equation 11.17 with:
Gives Tv = 0.15
Chap. 11 Rate of Consolidation 11-31
t (yrs) δc (m) U
0.2 0.342 33%
11.23 The analysis in Example 11.5 did not explicitly consider the possibility that the drainage
distance Hdr used in the original analysis was not correct. Does the adjustment of cv based
on piezometer data, as described in this example, implicitly consider Hdr? Explain.
Solution
Although the analysis in Example 11.5 did not explicitly consider Hdr, it is implicitly
11.24 An engineer in your office is planning a drilling and sampling program at a site that has a
thick stratum of soft to medium clay. The information gathered from this program, along
with the associated laboratory test results, will be used in various geotechnical analyses,
including evaluations of consolidation rates. This engineer has submitted the plan to you
for your review and approval.
The engineer expects the clay stratum will be very uniform, and therefore is
planning to obtain only a few samples. These samples will then be used to conduct
11-32 Rate of Consolidation Chap. 11
Solution
Memorandum
To: Staff Engineer
From: Project manager
Re: Exploration program for the _____ project
Thank you for submitting the subsurface exploration plan for the _____ project.
Upon reviewing this plan, I see that you intend to drill few borings, and plan to obtain
only few samples, which then will be used to conduct consolidation tests. Since the soft
11.25 A piezometer has been installed near the center of a 20-m thick stratum of saturated clay.
A fill was then placed over the clay and the measured pore water pressure in the
piezometer increased accordingly. However, 6 months after the fill was placed, the
piezometer reading has not changed. Does this behavior make sense?
Solution
Yes, this behavior is reasonable. For a 20 m thick clay stratum with cv = 0.005 m2/day (a
typical value per Figure11.14), essentially none of the excess pore pressure at the middle

Chap. 11 Rate of Consolidation 11-33
11.26 Explain how a time-settlement analysis could be used to estimate how long a surcharge
fill must remain in place.
Solution
For a given loading event, the time to reach a given degree of consolidation is not