Chapter 10
Variance Analysis—A Tool for Cost Control and Performance
Evaluation
Concept Questions
1. (LO 1—Ideal vs. practical standards)
Ideal standards assume that every area of the production process is at peak
efficiency. While some managers believe that ideal standards are preferable
2. (LO 2—Static vs. flexible budgets)
3. (LO 2—Flexible budgets)
The value of the flexible budget is to allow management to analyze results at
4. (LO 3—Responsibility for sales price variance)
The marketing and sales department would most likely be responsible for sales
Solutions Manual
10-2
5. (LO 5—The standard quantity allowed)
The standard quantity allowed is the amount of direct material that should have
6. (LO 5, 6, and 7—Usage variances)
7. (LO 6—Causes of direct labor efficiency variances)
Potential causes of an unfavorable direct labor efficiency variance include low
8. (LO 7—Variable overhead efficiency variance)
9. (LO 8—Fixed overhead volume variance)
10. (LO 9—Management by exception)
Management by exception is the process of taking action only when actual
results deviate significantly from planned results. It is neither necessary nor
Chapter 10: Variance Analysis—A Tool for Cost Control and Performance Evaluation
10-3
Exercises
1. (LO 1—Standard costing)
a.
practical standard
b.
standard cost
c.
variance analysis
d.
standard price
e.
management by exception
Sales price variance:
2. (LO 2—Flexible budget preparation)
Revenue $277,500 (1,850 @ $150)
Variable expenses:
3. (LO 3—Flexible budget variance)
Flexible Flexible Budget Actual
Budget Variance Results
Sales revenue $277,500 $5,550 Under $271,950
4. (LO 3—Sales price variance)
The actual sales price was $7 per unit.
Solutions Manual
5. (LO 5—Direct materials price and usage variances)
A.
DM price variance = $49.50 F
DM usage variance = $1.50(990 – 1,100)
DM usage variance = $165 F
DM price variance = AQpurchased(AP – SP)
6. (LO 6—Labor rate and efficiency variances)
A.
DL rate variance = $121 U
DL efficiency variance = $12.00(2,420 – 2,200)
DL efficiency variance = $2,640 U
DL rate variance = AH(AR – SR)
7. (LO 7—Variable overhead spending and efficiency variances)
A.
VOHSV = Actual variable overhead – (AH × SVR)
Where variable overhead rate = $30,000 ÷ 40,000 hrs = $0.75 per DL hour
8. (LO 8—Fixed overhead volume and spending variances)
A.
FOHVV = Budgeted fixed overhead – Applied fixed overhead
Applied fixed overhead = $14,800 ($0.40 × 37,000)
overhead spending variance is $120 U.
10-5
9. (LO 9—Drawbacks of variance analysis)
There are several potential drawbacks to variance analysis:
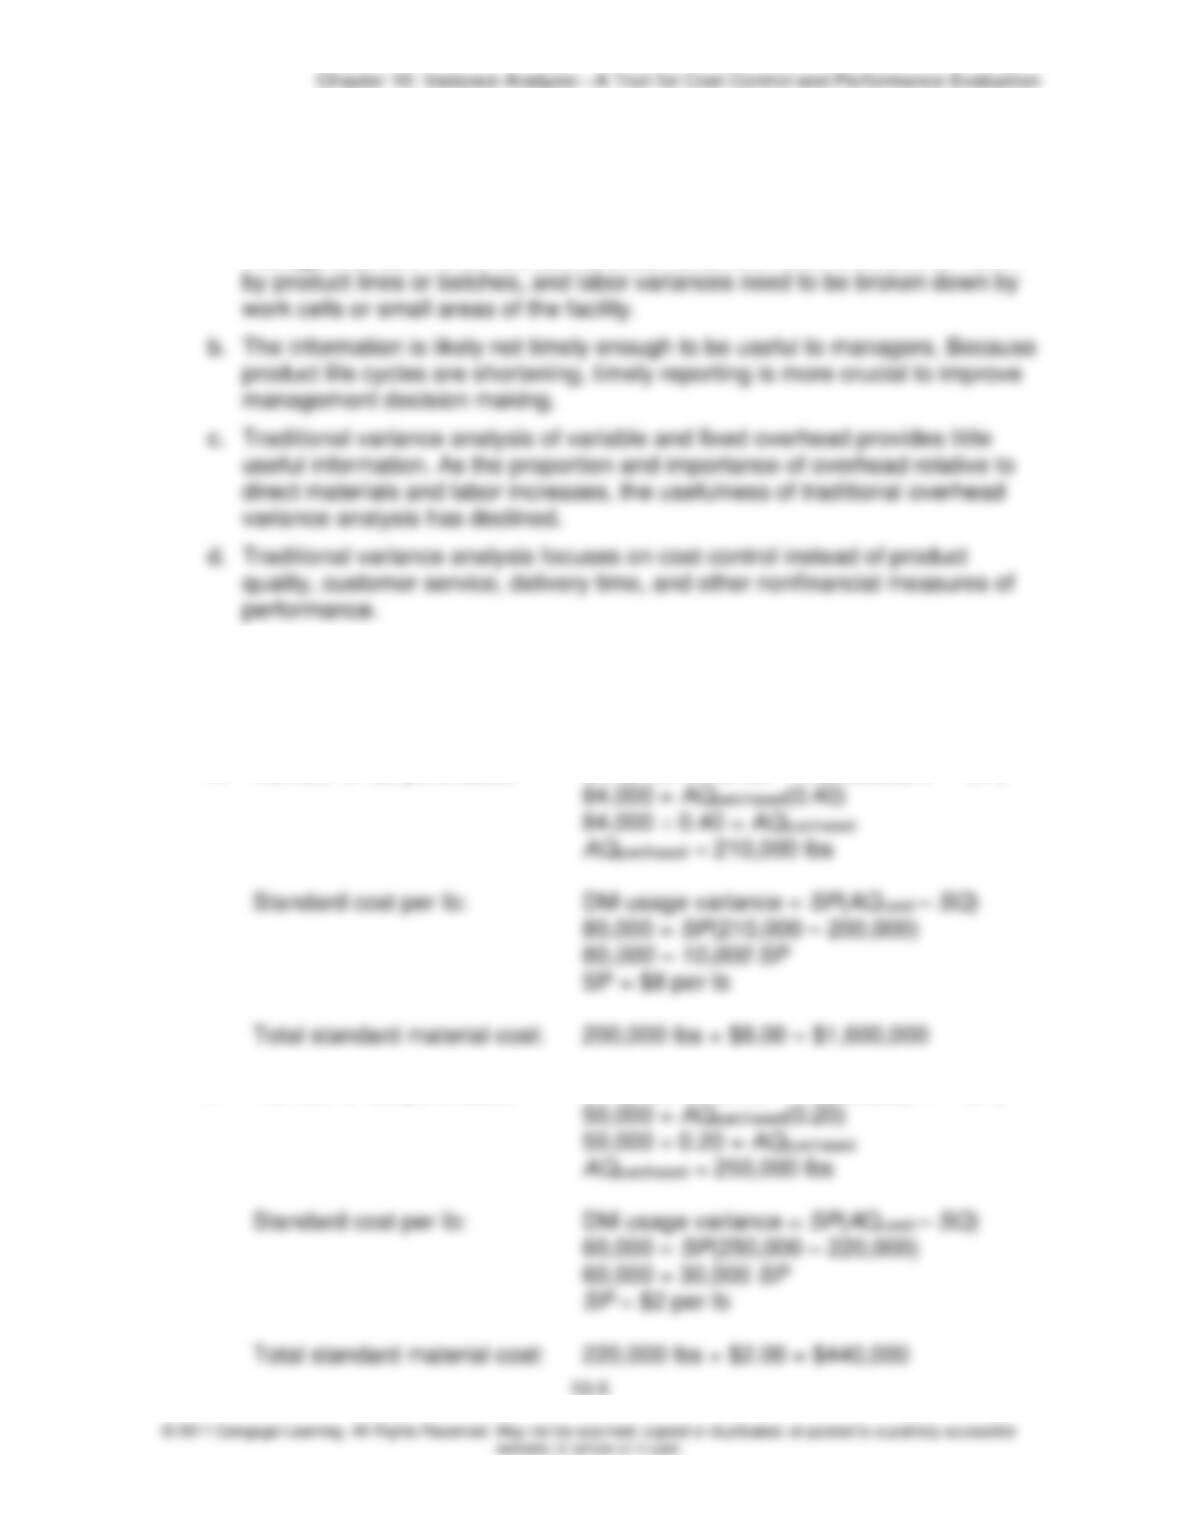
a. The information from the analysis is likely to be too aggregated for operating
managers to use. To be useful, materials variances need to be broken down
Problems
10. (LO 1—Standard costing)
A.
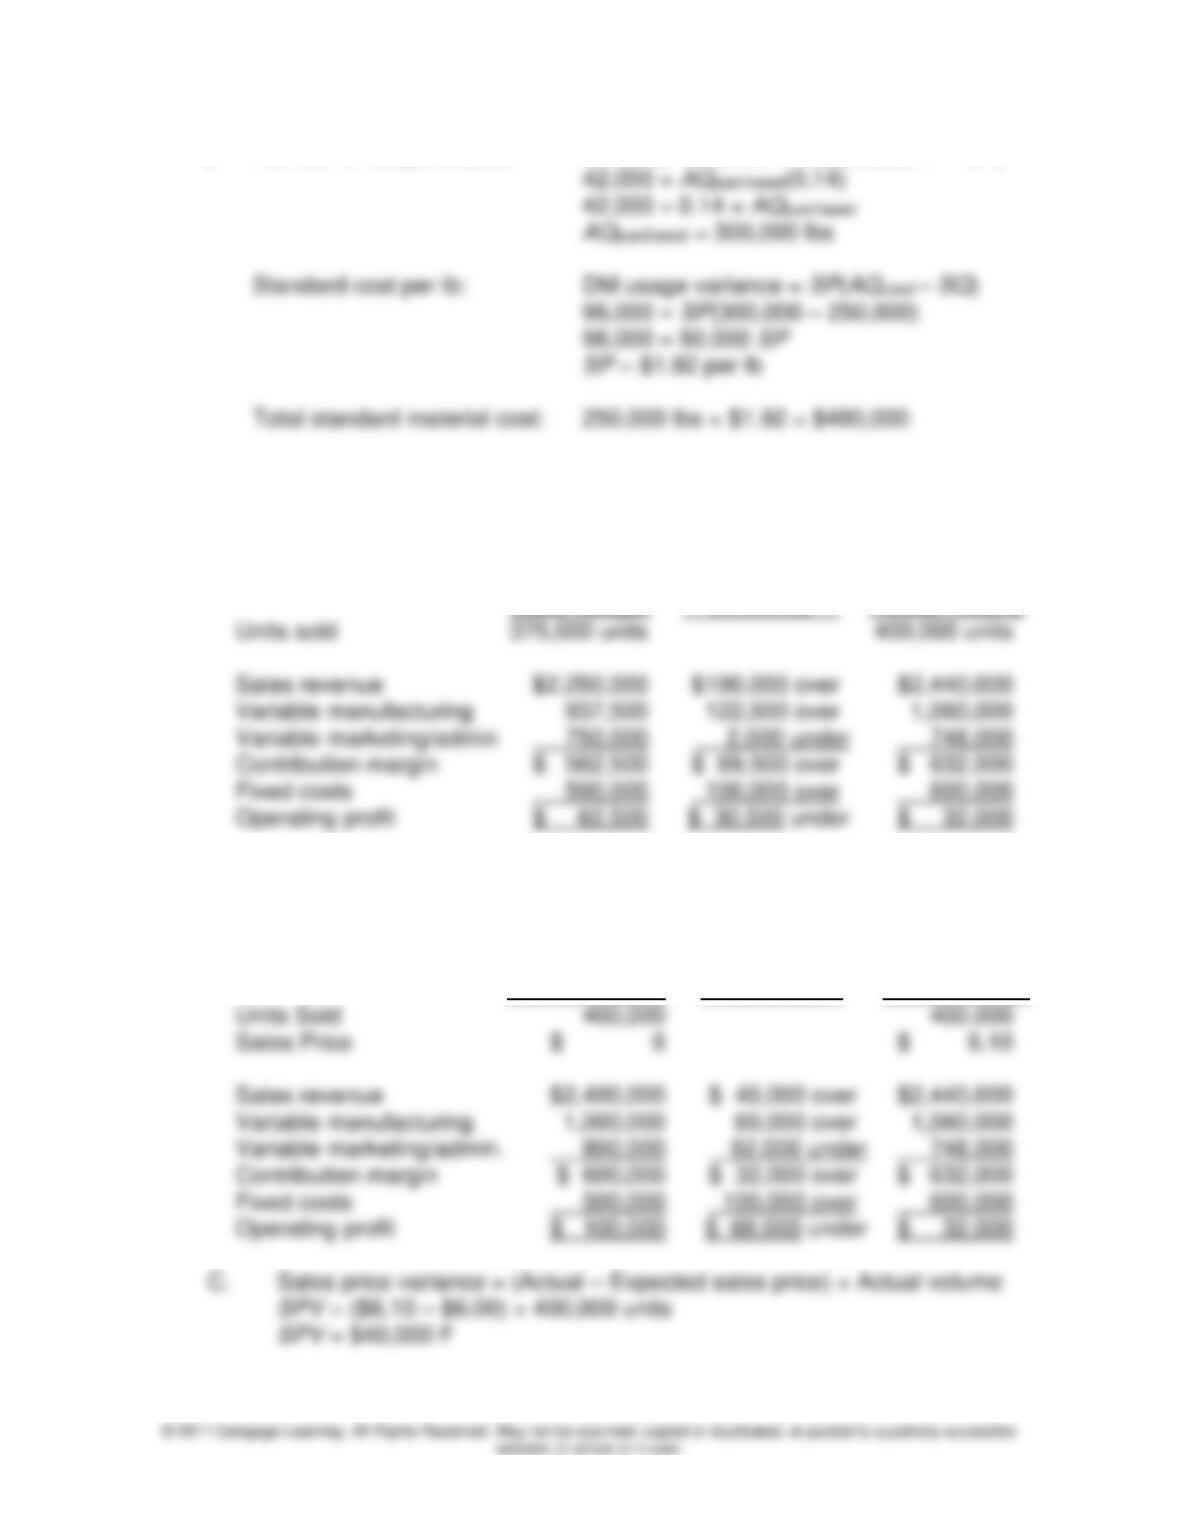
Number of lbs purchased:
SP = $8 per lb
Total standard material cost:
200,000 lbs × $8.00 = $1,600,000
DM price variance = AQpurchased(AP – SP)
B.
Number of lbs purchased:
Total standard material cost:
220,000 lbs × $2.00 = $440,000
DM price variance = AQpurchased(AP – SP)
Solutions Manual
10-6
C.
Number of lbs purchased:
Total standard material cost:
250,000 lbs × $1.92 = $480,000
DM price variance = AQpurchased(AP – SP)
11. (LO 2 and 3—Comprehensive variance analysis)
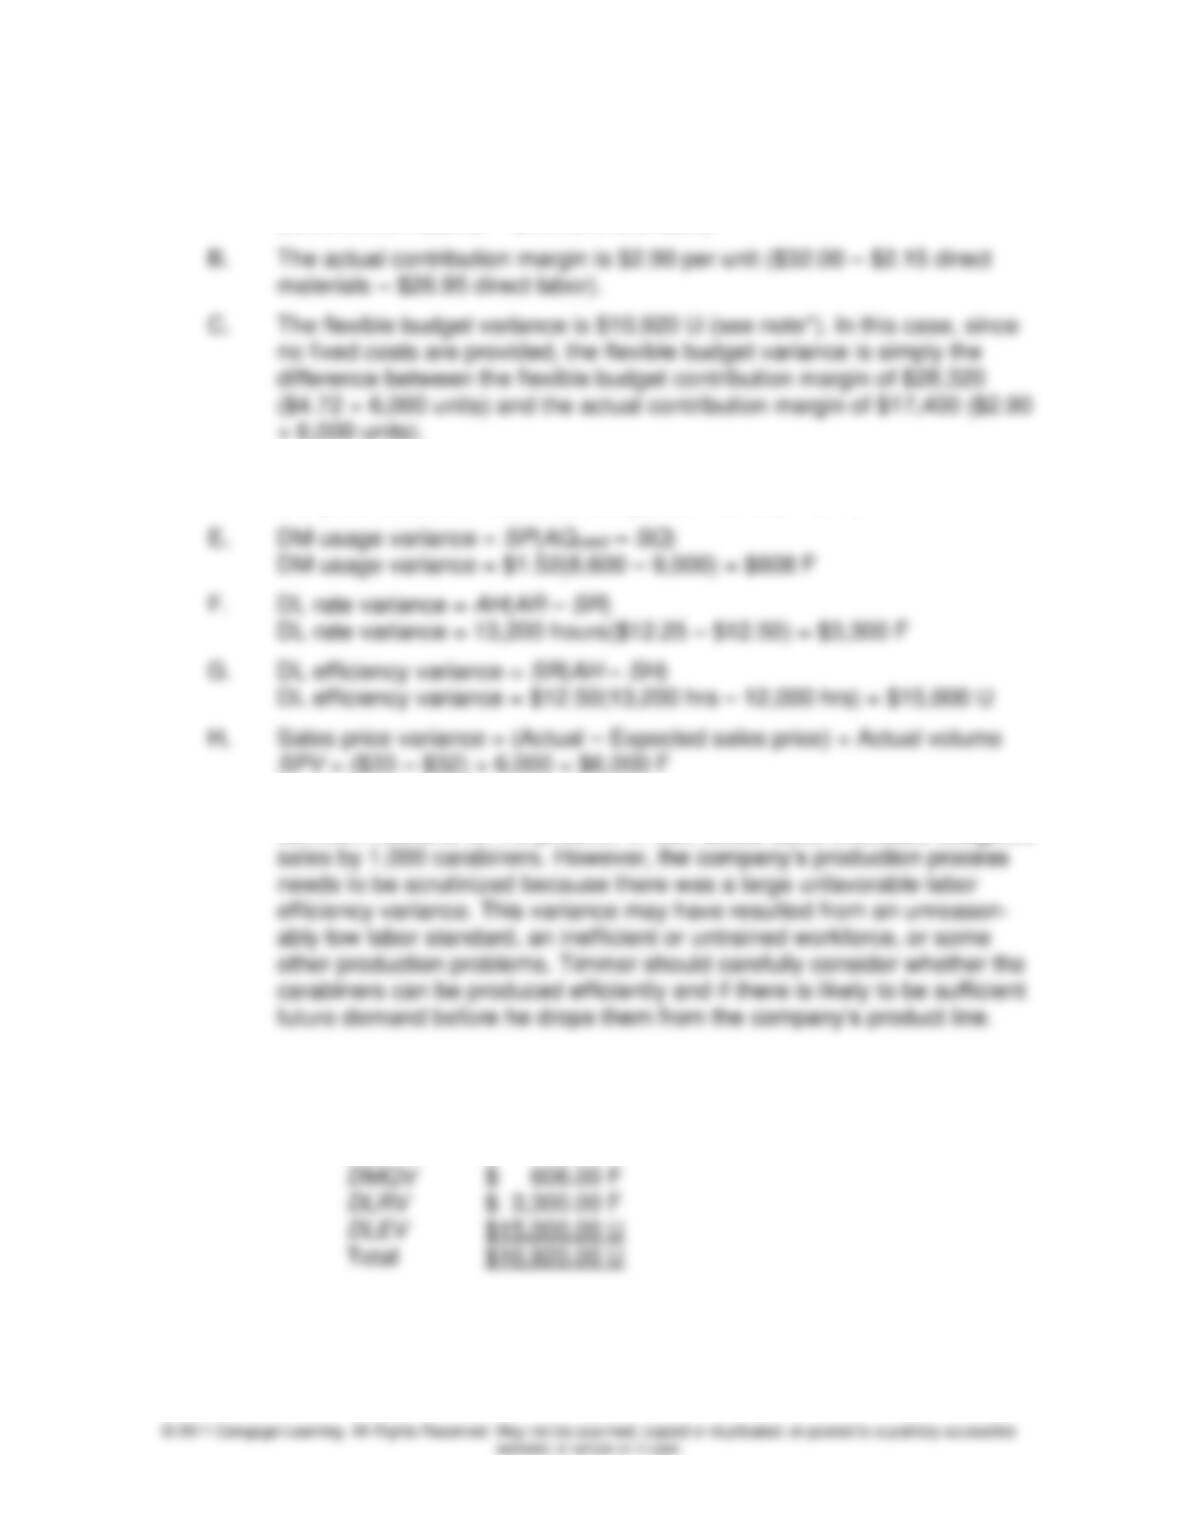
A. Byrd Company
Static Budget to Actual Results
For the quarter ended December 31, 2009
Static Budget
Difference
Actual Results
Units sold
Sales revenue
Variable manufacturing
Variable marketing/admin
Contribution margin
Fixed costs
Operating profit
B. Byrd Company
Flexible Budget to Actual Results
For the quarter ended December 31, 2009
Flexible Budget
Flexible Budget
Variance
Actual Results
Units Sold
Sales Price
Sales revenue
Variable manufacturing
Variable marketing/admin.
Contribution margin
Fixed costs
Operating profit
C. Sales price variance = (Actual – Expected sales price) × Actual volume
Chapter 10: Variance Analysis—A Tool for Cost Control and Performance Evaluation
10-7
12. (LO 3, 4, 5, and 6—Comprehensive variance analysis)
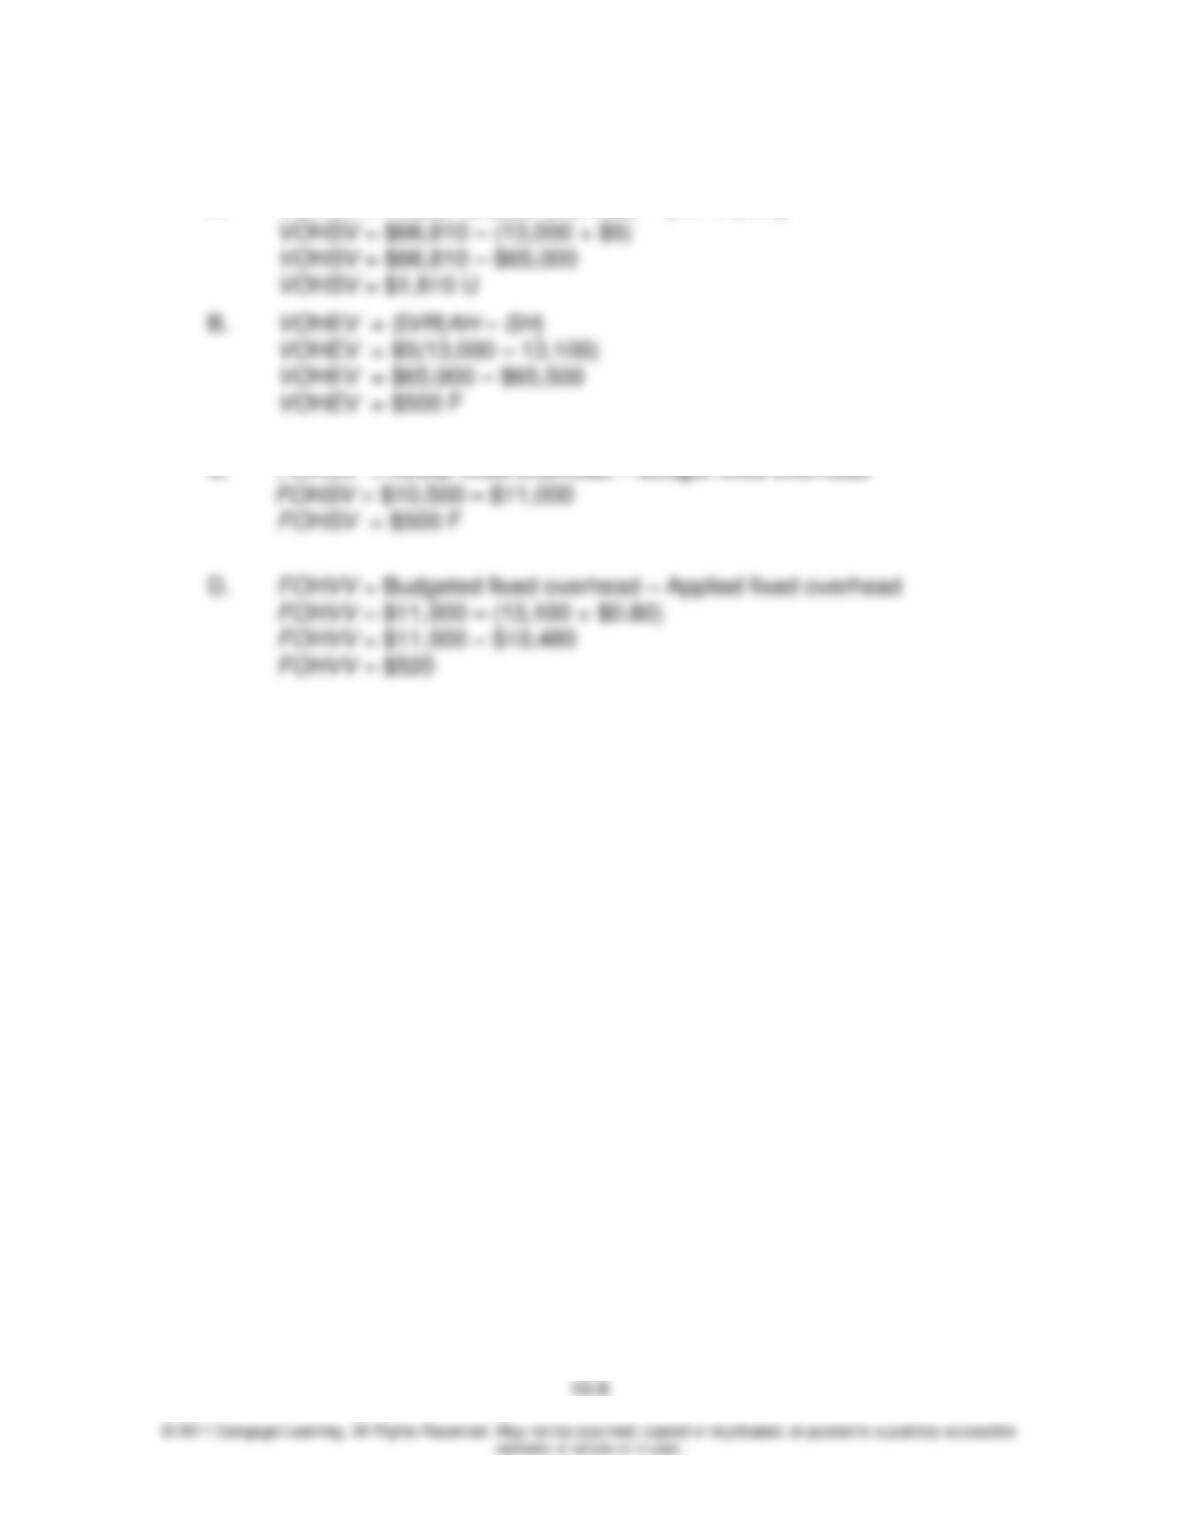
A. The budgeted contribution margin is $4.72 per unit ($32.00 sales price –
$2.28 direct material – $25.00 direct labor).
D. DM price variance = AQpurchased(AP – SP)
DM price variance = 8,600 ounces($1.50 – $1.52) = $172 F
I. The data do not conclusively suggest one answer. There appears to be
sufficient demand for the product. In fact, actual sales exceeded budgeted
* Note: The unfavorable flexible budget variance of $10,920 is the sum of
the following:
DMPV $ 172.00 F
Solutions Manual
13. (LO 7 and 8—Variable and fixed overhead variances)
A. VOHSV = Actual variable overhead – (AH × SVR)
C. FOHSV = Actual fixed overhead – Budget fixed overhead