1
Case #5
“Monterrey Manufacturing Company”
Harvard Business School Case: #9–197–023
(Rev. December 18, 1996)
Academic instructors who are registered with the publisher’s
website (http://www.hbsp.harvard.edu) may download the Teaching
Note #5–198–023 (August 28, 1997) for this case free of charge.
ABSTRACT
Monterrey Manufacturing Company has financial data for the
past nine months and estimates for the remaining three months of
TEACHING OBJECTIVES
The purpose of this simple case is to augment the topics of
T-accounts (Section 7.3 of text) and the preparation of financial
statements (Section 7.4 of text). The T–accounts for a
SUGGESTED QUESTIONS FOR CLASSROOM DISCUSSION
1. Using the financial data available, prepare the entries to
all T-accounts. Attach a code (such as 6b, 2a) to each entry so
that it can be readily identified and deliberated in class. Use
2
ANALYSIS
1. Entries to T–Accounts.
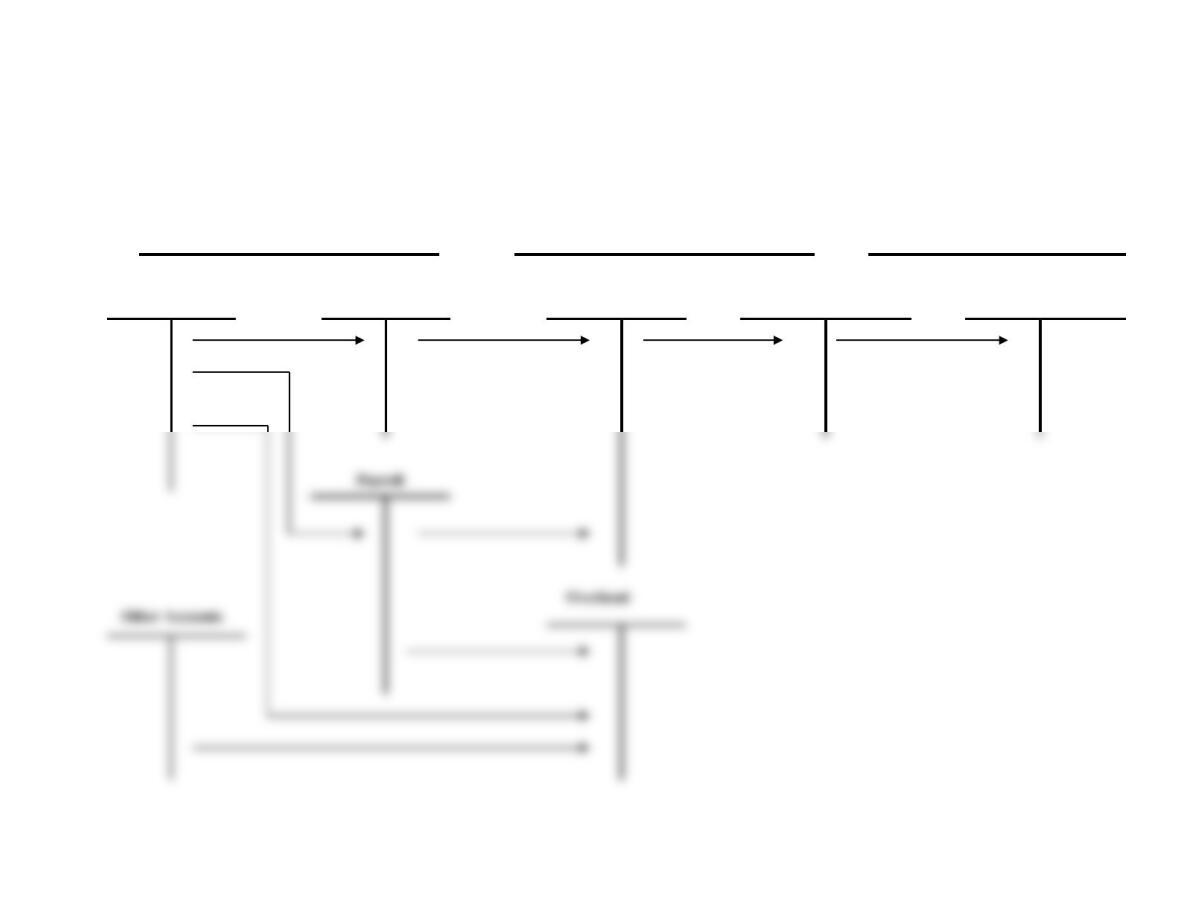
The cost flow chart for a manufacturing company is described
in Table c5–1, which is presented on the next page. This chart
Assets – Liabilities – Owner’s Equities = 0
Each activity is to be described by two financial entries. The
financial entry that causes the left hand side of this equation
to rise in value is to be debited to the applicable T–account.
Examples include those entries that produce an increase in
For example, paying $50 cash to buy pencils and papers for
use by employees requires that $50 is debited to the T–Account
for “Office Supplies” and $50 is credited to the T–Account for
“Cash.” If a piece of used equipment is sold at $1,000 to a
2. Entries to the Income Statement and Balance Sheet
Table C5–3 lists entries to the company’s Income statement.
Table C5-4 shows the financial entries to its balance sheet.
3
Table C5–1. Cost Flow Chart of a Manufacturing
Company
Reference: William J. Bruns, “Monterrery Manufacturing Company – Teaching Note,”
Harvard Business School #5-198-023 (August 28, 1997).
Acquiring Resources
Production
Sales of Products
Cash
Stores
Work in Progress
Finished Goods
Cost of Goods Sold
4
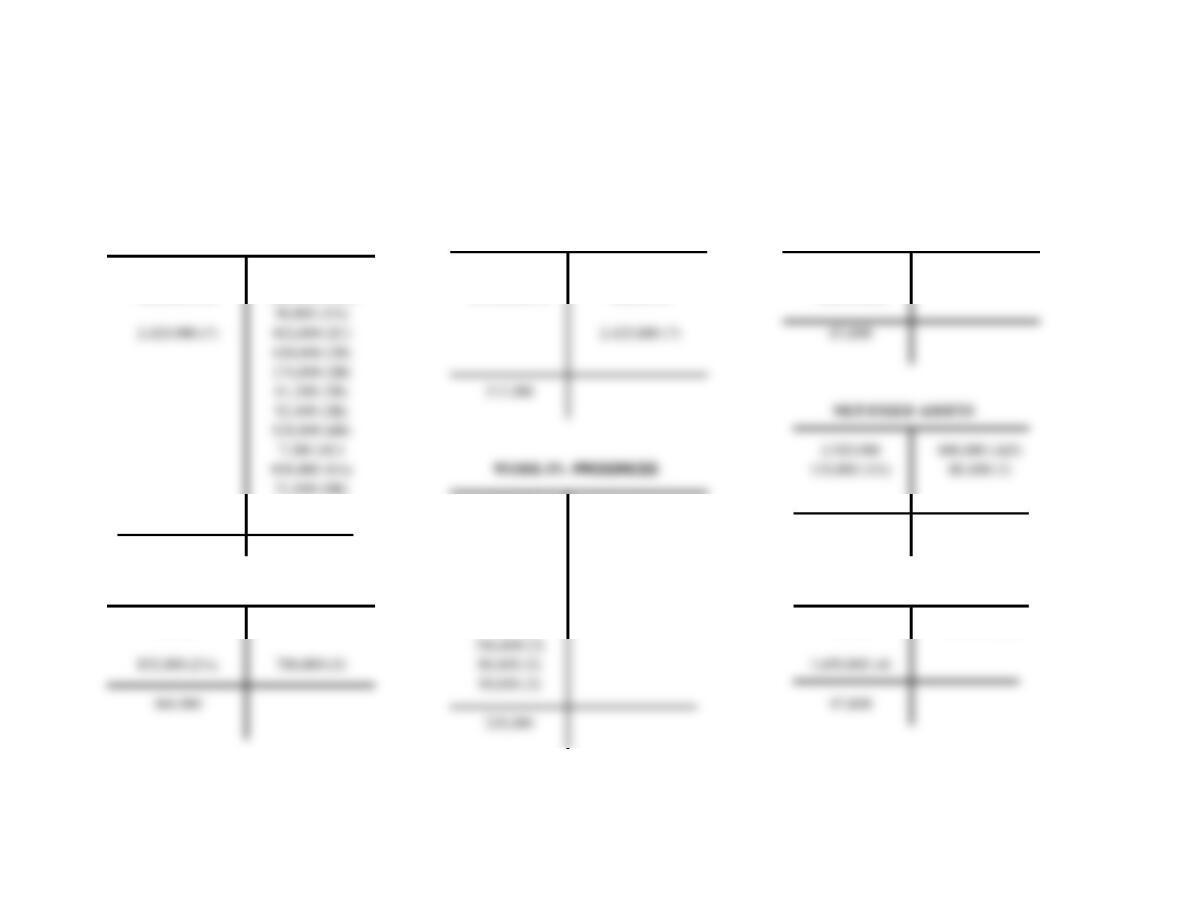
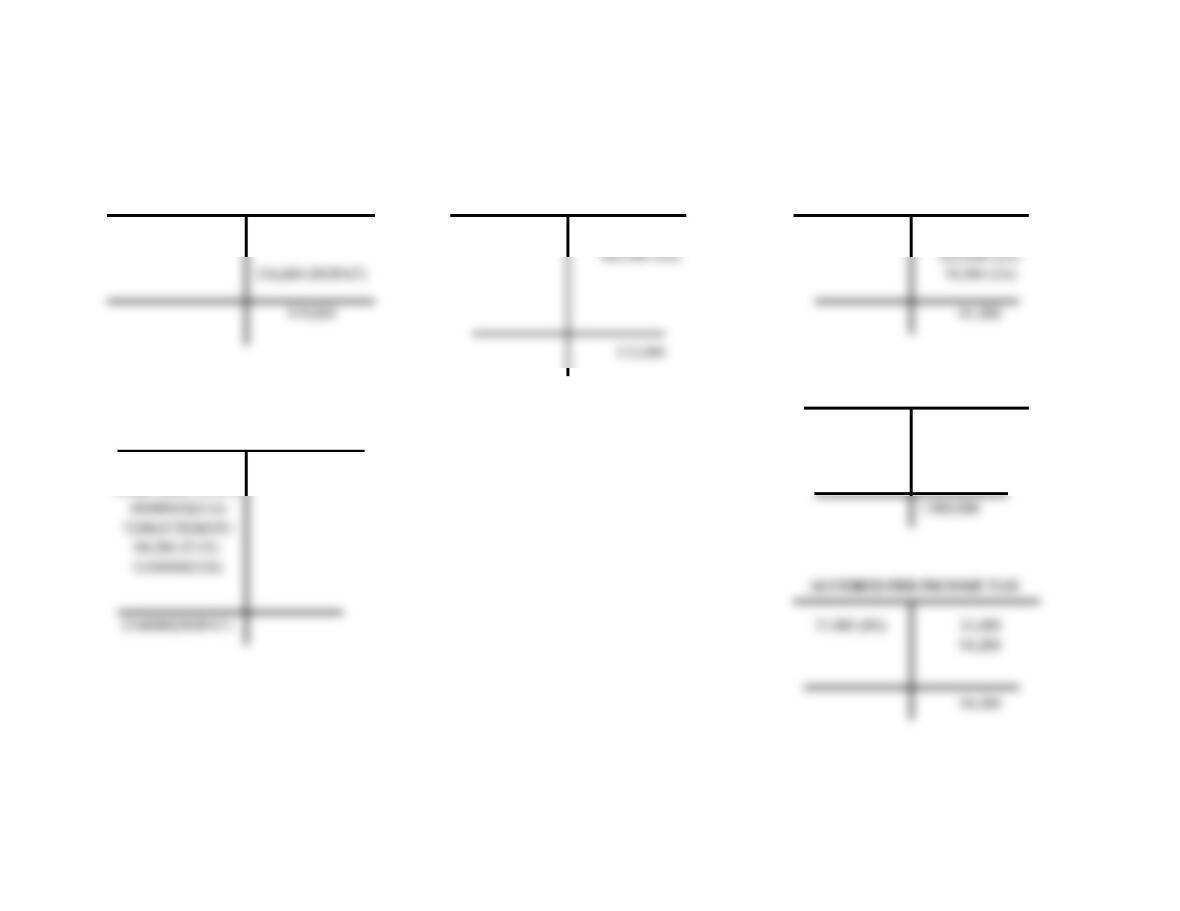
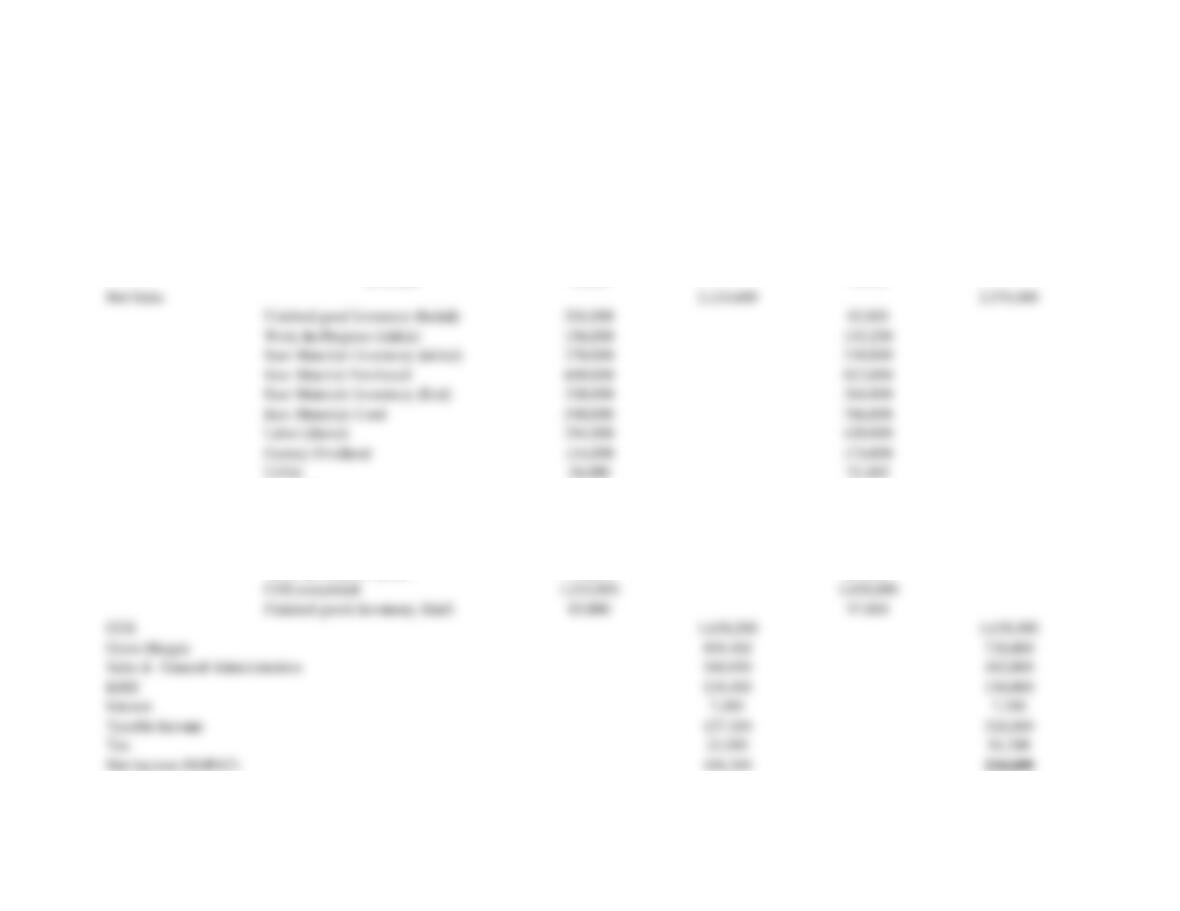
Table C5-2. T- Accounts of Monterrey
Manufacturing – HBS Case # 9-197-023
(Dr. C. M. Chang)
CASH
ACCOUNTS
RECEIVABLES
SUPPLIES
153,000
363,000
18,000 (1)
99,000
90,000 (3)
462,000 (6A)
120M000 (2A)
2,442,000 (1)
48,000 (1)
78,000 (2A)
126,000 (10)
145,000
1,650,000 (4)
1,359,000
94,200
420,000 (2B)
174,000 (2B)
RAW
MATERIALS
61,200 (2B)
FINISHED
GOODS
92,400 (2B))
330,000
30,000 (3)
85,800
1,638,000 (5)
366,000
97,800
229,200
402,000 (2C)
420,000 (2B)
174,000 (2B)
313,200
528,000 (6B)
958,800 (8A)
PROGRESS
120,000 (2A)
5
RETAINED EARNINGS
NOTES PAYABLE
ACCOUNTS PAYABLE
126,000 (10)
211,200
528,000(6B)
198,000
958,800 (8A)
120,000
CAPITAL STOCK
PROFIT AND LOSS SUMMARY
1,980,000
18000(RETURN)
2442,000 (11)
48000 (DISCOUNT)
ACCURED FED INCOME TAX
319,800
132,000
6
Table C5–3. Monterrey Manufacturing – HBS Case # 9–
197–023 (Dr. C. M. Chang)
Income Statement
1995
1995
1996
1996
Sales
Gross Sales
2,184,000
2,442,000
Return
16,800
18,000
Discount
42,600
48,000
Depreciation
76,800
80,400
Social Security Tax
45,000
61,200
Factory Insurance & Tax
30,000
30,000
Supplies
47,400
90,000
Work-In-Progress (End)
145,200
229,000
CGS completed
1,212,000
1,650,000
Finished goods Inventory (End)
85,800
97,800
CGS
Gross Margin
EBIT
Interest
Taxable Income
Tax
21,000
94,200
Net Income (NOPAT)
Net Sales
2,124,600
2,376,000
Finished good Inventory (Initial)
504,000
85,800
Work-In-Progress (initial)
156,000
145,200
Raw Materials Inventory (initial)
270,000
330,000
Raw Material Purchased
Raw Materials Inventory (End)
Raw Materials Used
786,000
Labor (direct)
294,000
420,000
Factory Overhead
114,000
174,000
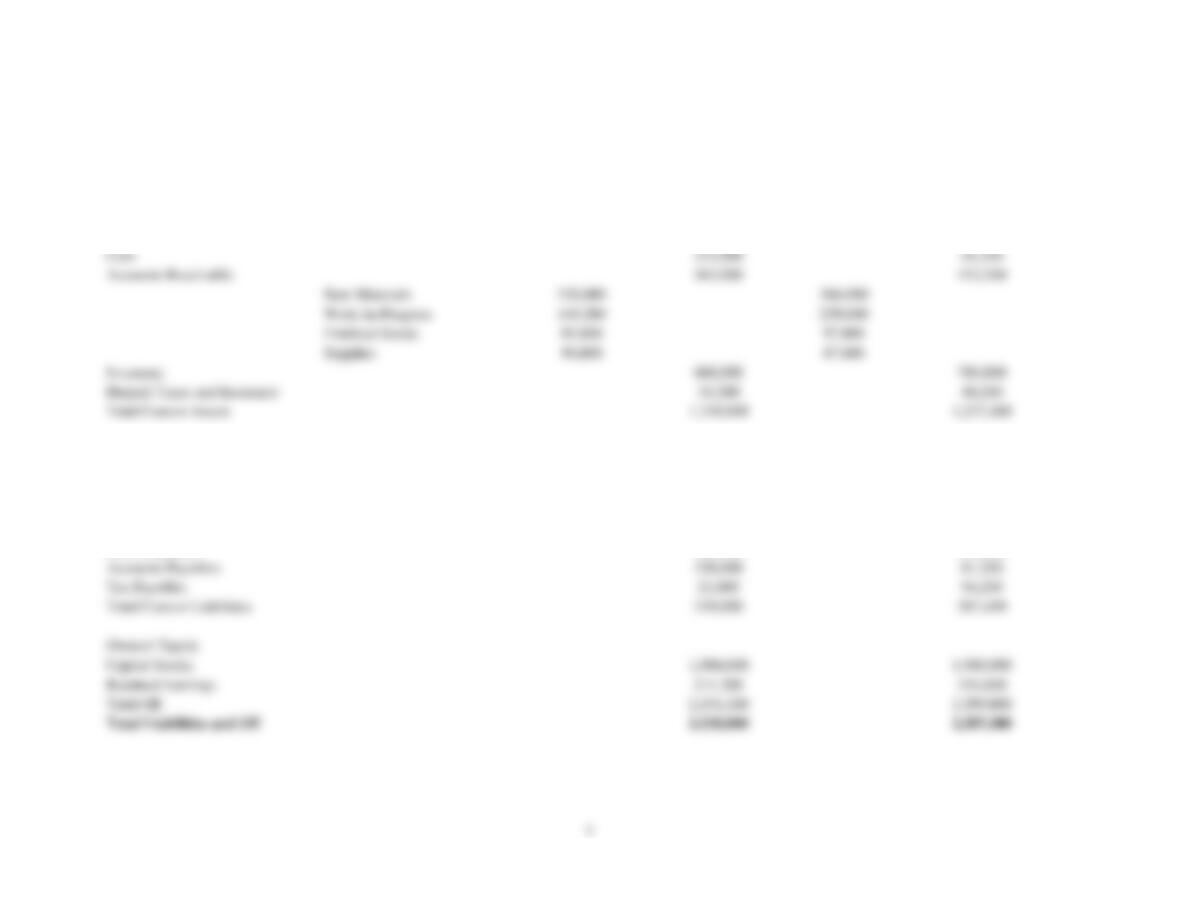
Table C5–4. Monterrey Manufacturing –
Balance Sheet
(Dr. C. M. Chang)
1995
1995
1996
1996
Assets
Cash
Accounts Receivable
Raw Materials
Finished Goods
Supplies
Inventory
Prepaid Taxes and Insurance
Total Current Assets
Original Assets Prices
1,920,000
2,040,000
Accumulated depreciation
600,000
680,400
Net Fixed Assets
1,320,000
1,359,600
Total Assets
2,530,000
2,587,000
Notes Payables
198,000
132,000
Accounts Payables
Tax Payables
Total Current Liabilities
Owners’ Equity
Retained Earnings
Total OE
2,191,200
2,299,800
Total Liabilities and OE
2,530,000
2,587,200