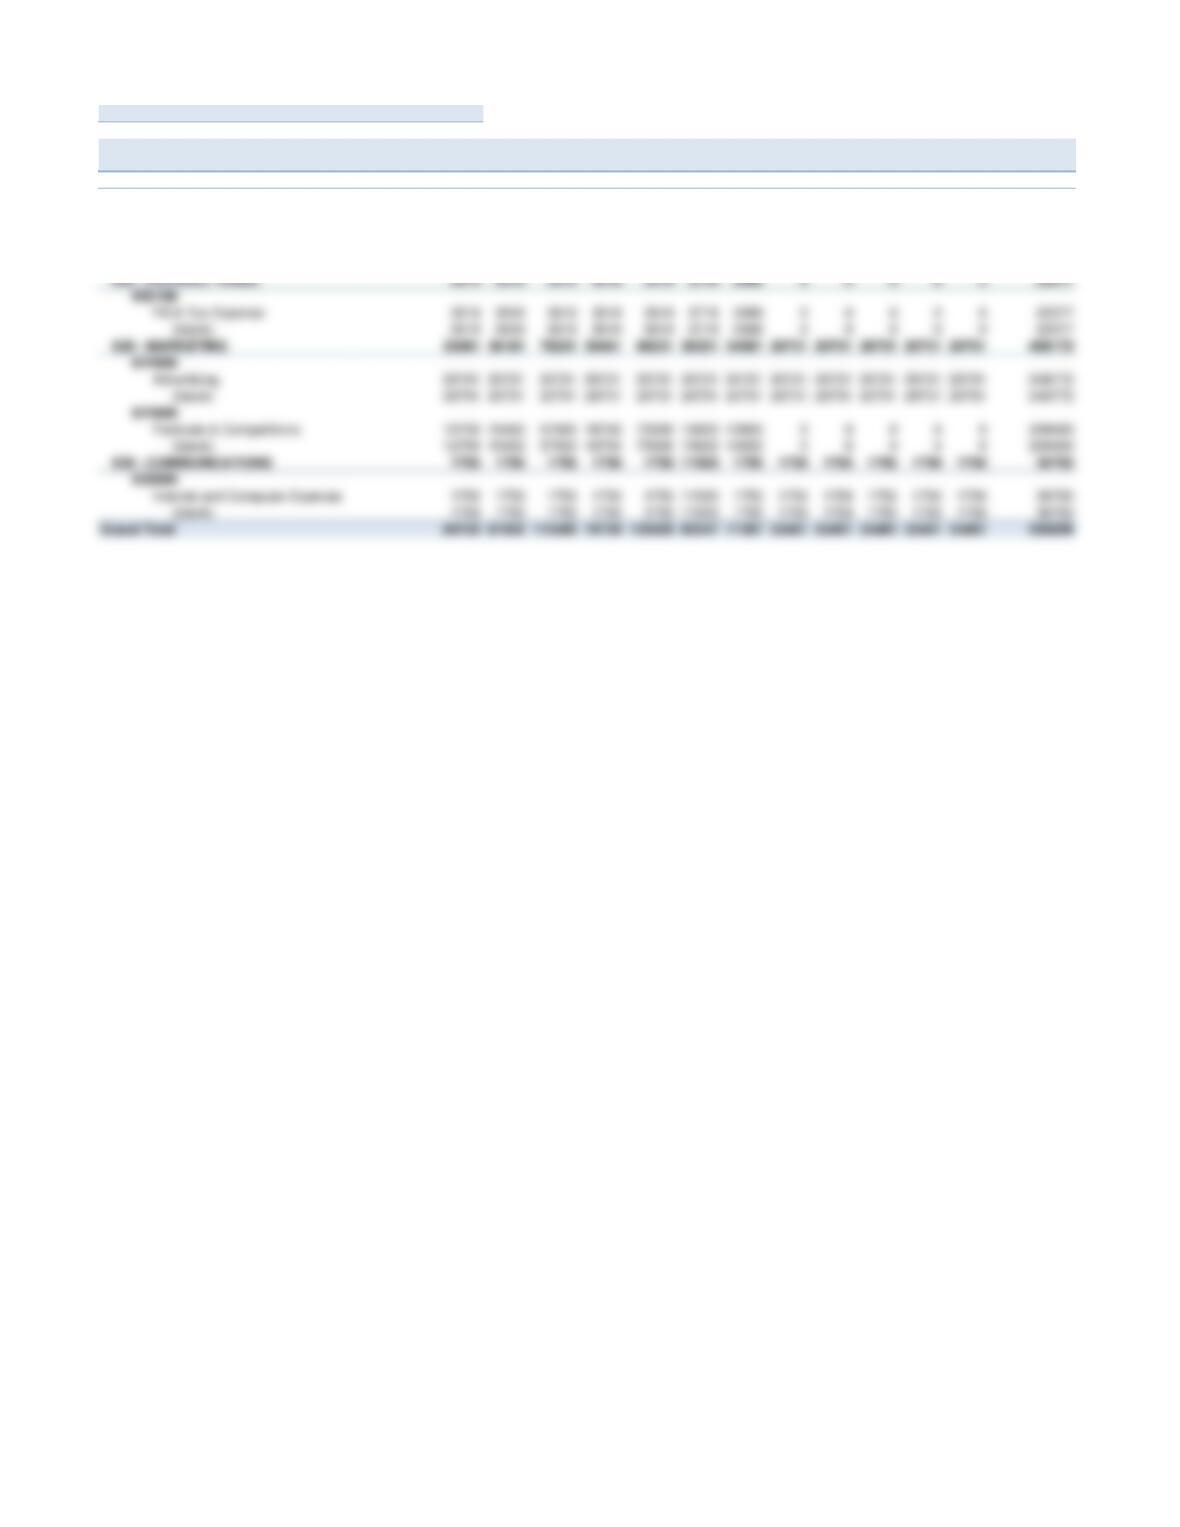
DEPT MKTG
Sum of REV_BUDGET Column Labels
Row Labels Jan Feb Mar Apr May Jun Jul Aug Sep Oct Nov Dec Grand Total
601 – SALARIES 46000 46000 32000 32000 32000 33000 33000 33000 33000 33000 33000 33000 419000
601000
Wages and Salaries 46000 46000 32000 32000 32000 33000 33000 33000 33000 33000 33000 33000 419000
CAMERON 14000 14000 14000 14000 14000 15000 15000 15000 15000 15000 15000 15000 175000
DANIEL 14000 14000 28000
TAYLOR 18000 18000 18000 18000 18000 18000 18000 18000 18000 18000 18000 18000 216000
602 – PAYROLL TAXES 3519 3519 3519 3519 3519 2716 2066 0 0 0 0 0 22377
602100
FICA Tax Expense 3519 3519 3519 3519 3519 2716 2066 0 0 0 0 0 22377
620 – MARKETING 33481 36181 78231 39481 96231 36331 34581 20731 20731 20731 20731 20731 458172
621000
624000
Festivals & Competitions 12750 15450 57500 18750 75500 15600 13850 0 0 0 0 0 209400
630 – COMMUNICATIONS 1750 1750 1750 1750 1750 11500 1750 1750 1750 1750 1750 1750 30750
632000
Internet and Computer Expense 1750 1750 1750 1750 1750 11500 1750 1750 1750 1750 1750 1750 30750
Grand Total 84750 87450 115500 76750 133500 83547 71397 55481 55481 55481 55481 55481 930299

DEPT OPS
Sum of REV_BUDGET Column Labels
Row Labels Jan Feb Mar Apr May Jun Jul Aug Sep Oct Nov Dec Grand Total
601 – SALARIES 26000 26000 26000 26000 26000 26000 26000 26000 26000 26000 26000 26000 312000
601000
602 – PAYROLL TAXES 1989 1989 1989 1989 1989 1645 689 689 689 689 574 014920
602100
Grand Total 27989 27989 27989 27989 27989 27645 26689 26689 26689 26689 26574 26000 326920
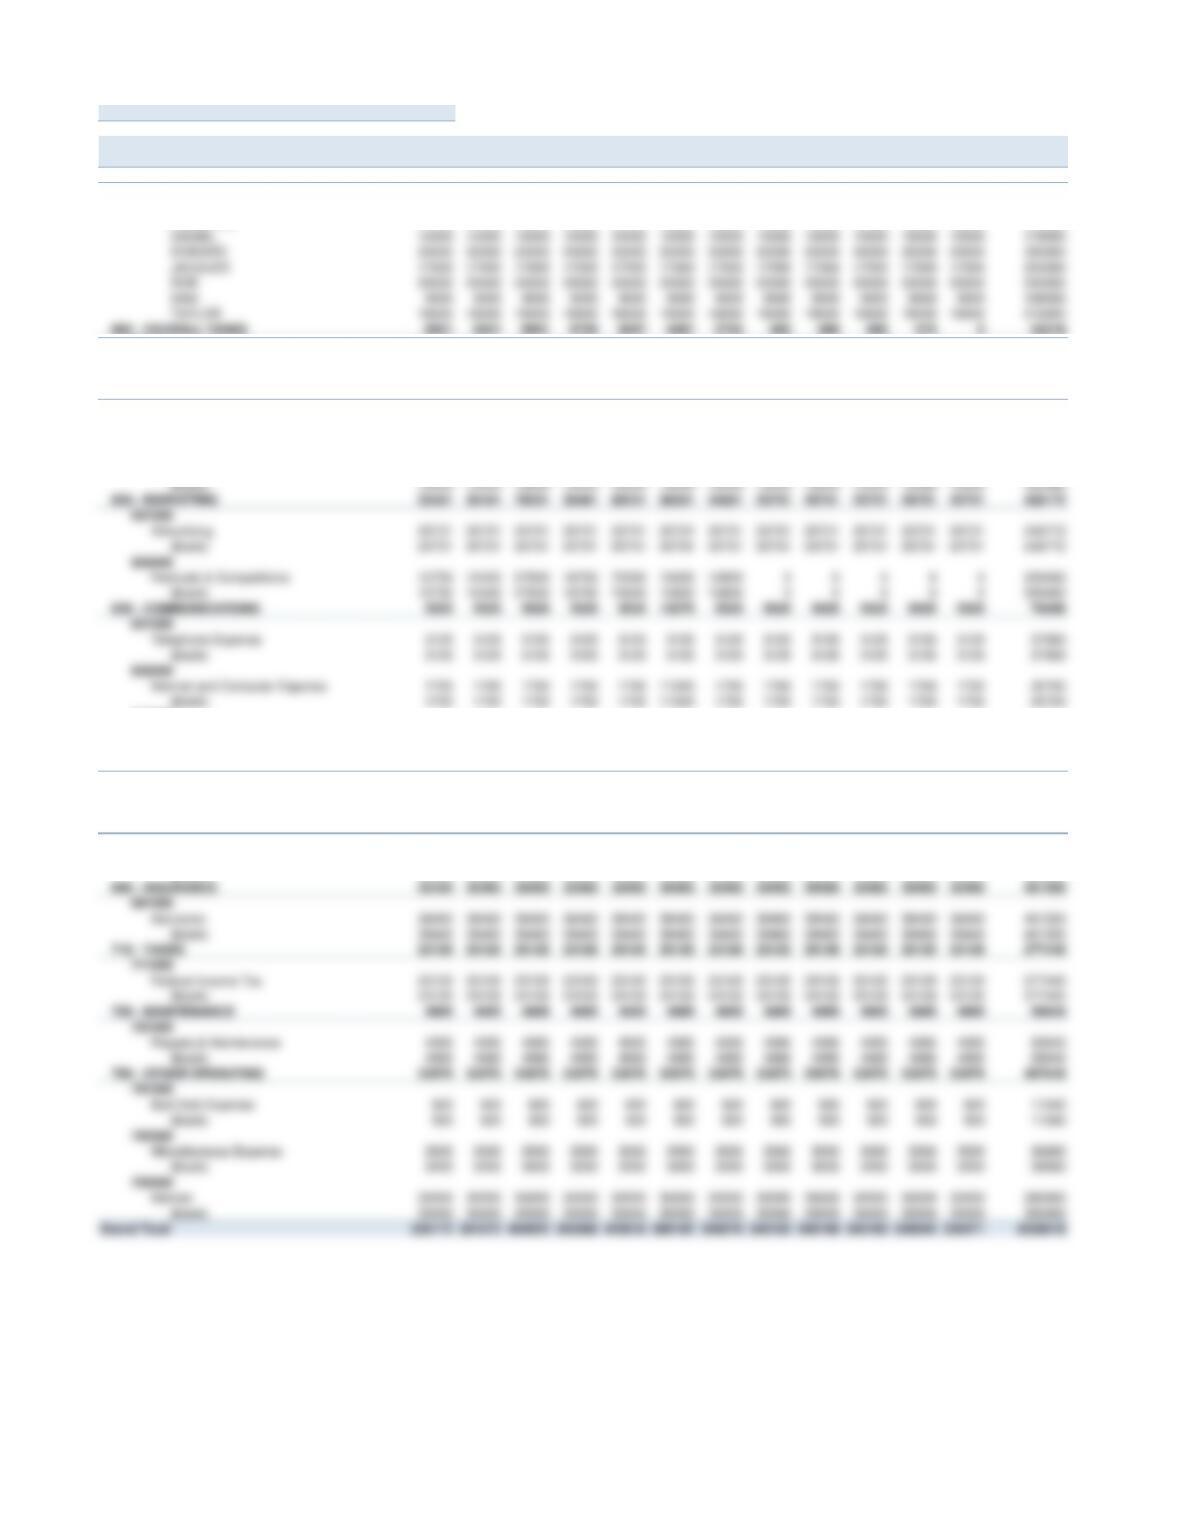
DEPT (All)
Sum of REV_BUDGET Column Labels
Row Labels Jan Feb Mar Apr May Jun Jul Aug Sep Oct Nov Dec Grand Total
601 – SALARIES 117000 117000 118000 118000 118000 119000 119000 119000 119000 119000 119000 119000 1421000
601000
Wages and Salaries 117000 117000 118000 118000 118000 119000 119000 119000 119000 119000 119000 119000 1421000
CAMERON 14000 14000 14000 14000 14000 15000 15000 15000 15000 15000 15000 15000 175000
602100
FICA Tax Expense 8951 8951 8951 8759 6847 4361 2755 689 689 689 574 052216
(blank) 8951 8951 8951 8759 6847 4361 2755 689 689 689 574 052216
610 – OCCUPANCY 43520 43520 43520 43520 43520 43520 43520 43520 43520 43520 43520 43520 522240
611000
Utilities 29980 29980 29980 29980 29980 29980 29980 29980 29980 29980 29980 29980 359760
(blank) 29980 29980 29980 29980 29980 29980 29980 29980 29980 29980 29980 29980 359760
612000
620 – MARKETING 33481 36181 78231 39481 96231 36331 34581 20731 20731 20731 20731 20731 458172
621000
624000
630 – COMMUNICATIONS 5525 5525 5525 5525 5525 15275 5525 5525 5525 5525 5525 5525 76050
631000
632000
Landscaping 13540 13540 13540 13540 13540 13540 13540 13540 13540 13540 13540 13540 162480
633000
Postage Expense 650 650 650 650 650 650 650 650 650 650 650 650 7800
(blank) 650 650 650 650 650 650 650 650 650 650 650 650 7800
650 – SUPPLIES 1800 1800 1800 1800 1800 1800 1800 1800 1800 1800 1800 1800 21600
651000
Office Supplies 1800 1800 1800 1800 1800 1800 1800 1800 1800 1800 1800 1800 21600
(blank) 1800 1800 1800 1800 1800 1800 1800 1800 1800 1800 1800 1800 21600
670 – DEPRECIATION 48350 48350 48350 48350 48350 48350 48350 48350 48350 48350 48350 48350 580200
671000
Depreciation – Buildings 48350 48350 48350 48350 48350 48350 48350 48350 48350 48350 48350 48350 580200
(blank) 48350 48350 48350 48350 48350 48350 48350 48350 48350 48350 48350 48350 580200
690 – INSURANCE 38460 38460 38460 38460 38460 38460 38460 38460 38460 38460 38460 38460 461520
691000
711000
720 – MAINTENANCE 4995 4995 4995 4995 4995 4995 4995 4995 4995 4995 4995 4995 59940
721000
790 – OTHER OPERATING 33970 33970 33970 33970 33970 33970 33970 33970 33970 33970 33970 33970 407640
791000
792000
793000
Grand Total 359172 361872 404922 365980 420818 369182 356076 340160 340160 340160 340045 339471 4338018
602 – PAYROLL TAXES 8951 8951 8951 8759 6847 4361 2755 689 689 689 574 052216

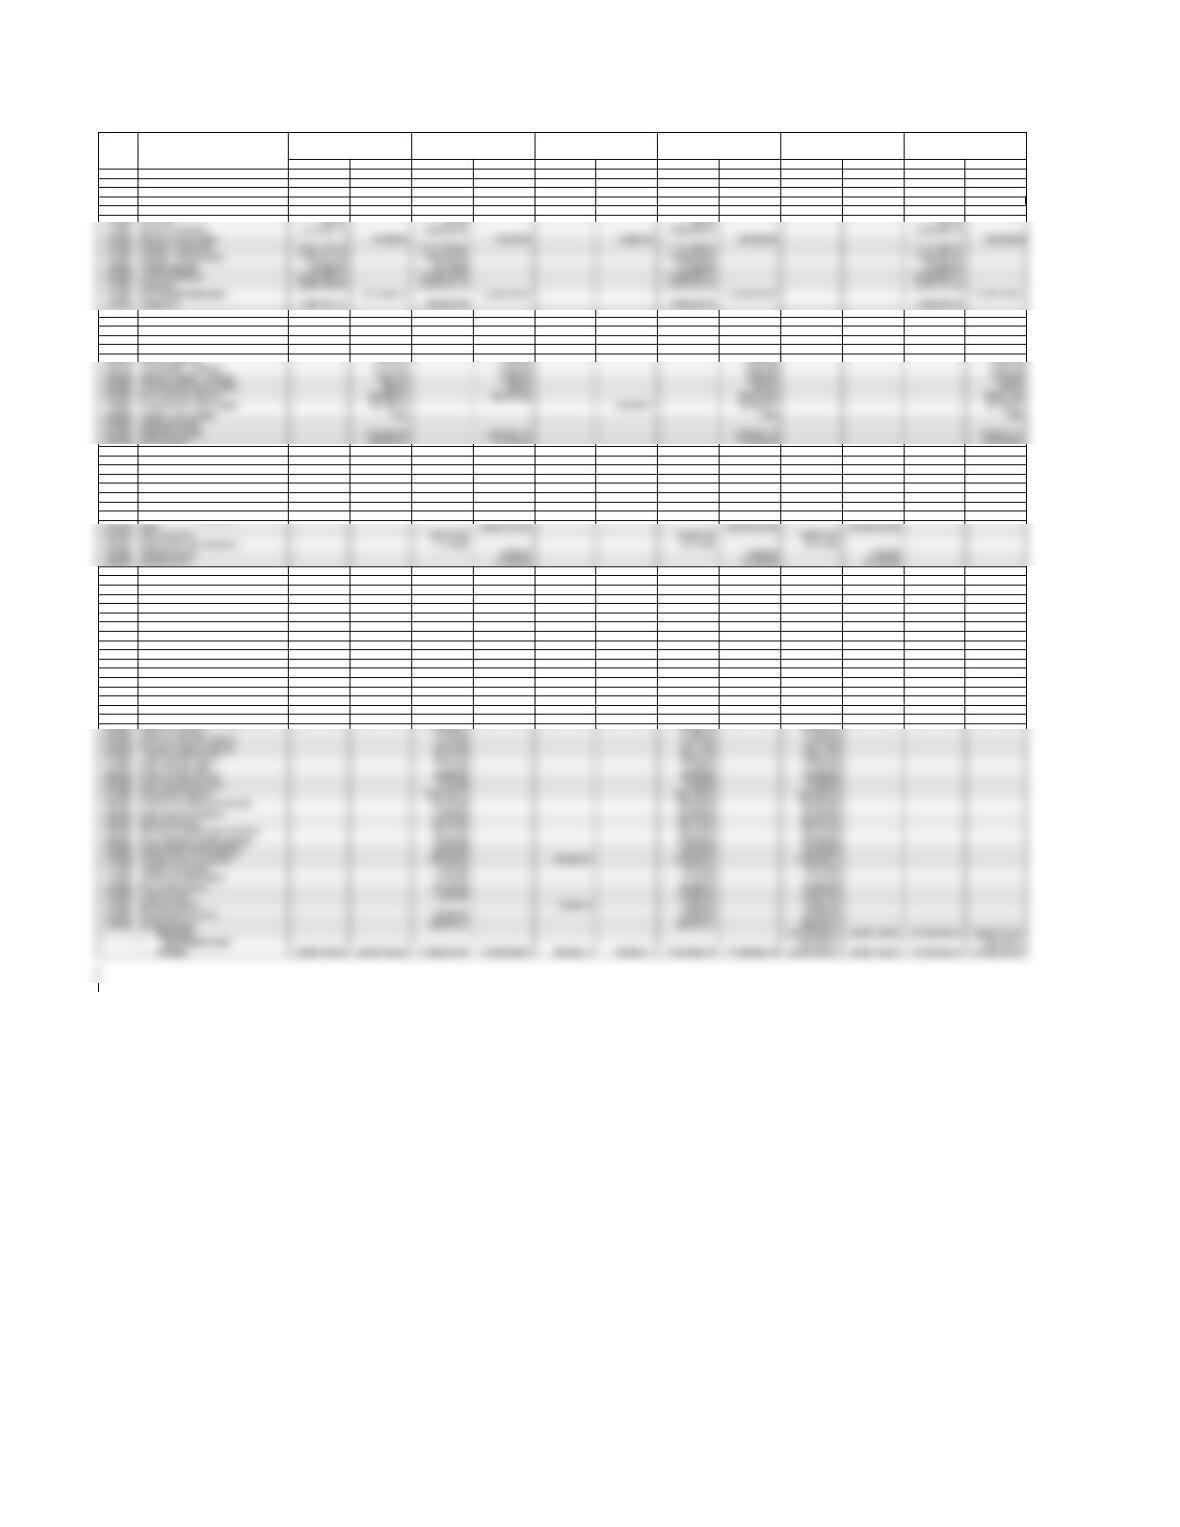
ACCT_TYPE ACCT_CODE ACCT_TITLE DEPT COST_CENTER YR MON BUDGET
EV_BUDG
EXPLANATIONS
601 – SALARIES 601000 Wages and Salaries MKTG TAYLOR 08 Jan 18000 18000
601 – SALARIES 601000 Wages and Salaries MKTG TAYLOR 08 Feb 18000 18000
601 – SALARIES 601000 Wages and Salaries MKTG TAYLOR 08 Mar 18000 18000
601 – SALARIES 601000 Wages and Salaries MKTG TAYLOR 08 Apr 18000 18000
601 – SALARIES 601000 Wages and Salaries MKTG TAYLOR 08 May 18000 18000
601 – SALARIES 601000 Wages and Salaries MKTG TAYLOR 08 Jun 18000 18000
601 – SALARIES 601000 Wages and Salaries MKTG TAYLOR 08 Jul 18000 18000
601 – SALARIES 601000 Wages and Salaries MKTG TAYLOR 08 Aug 18000 18000
601 – SALARIES 601000 Wages and Salaries MKTG TAYLOR 08 Sep 18000 18000
601 – SALARIES 601000 Wages and Salaries MKTG TAYLOR 08 Oct 18000 18000
601 – SALARIES 601000 Wages and Salaries MKTG TAYLOR 08 Nov 18000 18000
601 – SALARIES 601000 Wages and Salaries MKTG TAYLOR 08 Dec 18000 18000
601 – SALARIES 601000 Wages and Salaries MKTG DANIEL 08 Jan 14000 14000
601 – SALARIES 601000 Wages and Salaries MKTG CAMERON 08 Jan 14000 14000
601 – SALARIES 601000 Wages and Salaries MKTG CAMERON 08 Feb 14000 14000
601 – SALARIES 601000 Wages and Salaries MKTG CAMERON 08 Mar 14000 14000
601 – SALARIES 601000 Wages and Salaries MKTG CAMERON 08 Apr 14000 14000
601 – SALARIES 601000 Wages and Salaries OPS JACQUES 08 Apr 17000 17000
601 – SALARIES 601000 Wages and Salaries OPS JACQUES 08 May 17000 17000
601 – SALARIES 601000 Wages and Salaries OPS JACQUES 08 Jun 17000 17000
601 – SALARIES 601000 Wages and Salaries OPS JACQUES 08 Jul 17000 17000
601 – SALARIES 601000 Wages and Salaries OPS JACQUES 08 Aug 17000 17000
601 – SALARIES 601000 Wages and Salaries OPS JACQUES 08 Sep 17000 17000
601 – SALARIES 601000 Wages and Salaries OPS JACQUES 08 Oct 17000 17000
601 – SALARIES 601000 Wages and Salaries OPS JACQUES 08 Nov 17000 17000
601 – SALARIES 601000 Wages and Salaries ADMIN ROB 08 Jun 20000 20000
601 – SALARIES 601000 Wages and Salaries ADMIN ROB 08 Jul 20000 20000
601 – SALARIES 601000 Wages and Salaries ADMIN ROB 08 Aug 20000 20000
601 – SALARIES 601000 Wages and Salaries ADMIN ROB 08 Sep 20000 20000
601 – SALARIES 601000 Wages and Salaries ADMIN ROB 08 Oct 20000 20000
601 – SALARIES 601000 Wages and Salaries ADMIN ROB 08 Nov 20000 20000
601 – SALARIES 601000 Wages and Salaries ADMIN ROB 08 Dec 20000 20000
601 – SALARIES 601000 Wages and Salaries ADMIN EDWARD 08 Jan 25000 25000
602 – PAYROLL TAXES 602100 FICA Tax Expense ADMIN 08 Jan 3443 3443
602 – PAYROLL TAXES 602100 FICA Tax Expense ADMIN 08 Feb 3443 3443
602 – PAYROLL TAXES 602100 FICA Tax Expense ADMIN 08 Mar 3443 3443
602 – PAYROLL TAXES 602100 FICA Tax Expense ADMIN 08 Apr 3251 3251
602 – PAYROLL TAXES 602100 FICA Tax Expense MKTG 08 Apr 3519 3519
602 – PAYROLL TAXES 602100 FICA Tax Expense MKTG 08 May 3519 3519
602 – PAYROLL TAXES 602100 FICA Tax Expense MKTG 08 Jun 2716 2716
602 – PAYROLL TAXES 602100 FICA Tax Expense MKTG 08 Jul 2066 2066
602 – PAYROLL TAXES 602100 FICA Tax Expense MKTG 08 Aug 0 0
602 – PAYROLL TAXES 602100 FICA Tax Expense MKTG 08 Sep 0 0
602 – PAYROLL TAXES 602100 FICA Tax Expense MKTG 08 Oct 0 0
602 – PAYROLL TAXES 602100 FICA Tax Expense OPS 08 Jul 689 689
602 – PAYROLL TAXES 602100 FICA Tax Expense OPS 08 Aug 689 689
602 – PAYROLL TAXES 602100 FICA Tax Expense OPS 08 Sep 689 689
602 – PAYROLL TAXES 602100 FICA Tax Expense OPS 08 Oct 689 689
602 – PAYROLL TAXES 602100 FICA Tax Expense OPS 08 Nov 574 574
602 – PAYROLL TAXES 602100 FICA Tax Expense OPS 08 Dec 0 0
610 – OCCUPANCY 612000 Landscaping ADMIN 08 May 13540 13540
610 – OCCUPANCY 612000 Landscaping ADMIN 08 Jun 13540 13540
610 – OCCUPANCY 612000 Landscaping ADMIN 08 Jul 13540 13540
610 – OCCUPANCY 612000 Landscaping ADMIN 08 Aug 13540 13540
610 – OCCUPANCY 612000 Landscaping ADMIN 08 Sep 13540 13540
610 – OCCUPANCY 612000 Landscaping ADMIN 08 Oct 13540 13540
610 – OCCUPANCY 612000 Landscaping ADMIN 08 Nov 13540 13540
610 – OCCUPANCY 612000 Landscaping ADMIN 08 Dec 13540 13540
620 – MARKETING 621000 Advertising MKTG 08 Jan 20731 20731
620 – MARKETING 621000 Advertising MKTG 08 Feb 20731 20731
620 – MARKETING 621000 Advertising MKTG 08 Mar 20731 20731
620 – MARKETING 621000 Advertising MKTG 08 Apr 20731 20731
620 – MARKETING 621000 Advertising MKTG 08 May 20731 20731
630 – COMMUNICATIONS 631000 Telephone Expense ADMIN 08 Jan 3125 3125
630 – COMMUNICATIONS 631000 Telephone Expense ADMIN 08 Feb 3125 3125
630 – COMMUNICATIONS 631000 Telephone Expense ADMIN 08 Mar 3125 3125
630 – COMMUNICATIONS 631000 Telephone Expense ADMIN 08 Apr 3125 3125
630 – COMMUNICATIONS 631000 Telephone Expense ADMIN 08 May 3125 3125
630 – COMMUNICATIONS 631000 Telephone Expense ADMIN 08 Jun 3125 3125
630 – COMMUNICATIONS 631000 Telephone Expense ADMIN 08 Jul 3125 3125
630 – COMMUNICATIONS 631000 Telephone Expense ADMIN 08 Aug 3125 3125
630 – COMMUNICATIONS 631000 Telephone Expense ADMIN 08 Sep 3125 3125
630 – COMMUNICATIONS 631000 Telephone Expense ADMIN 08 Oct 3125 3125
630 – COMMUNICATIONS 631000 Telephone Expense ADMIN 08 Nov 3125 3125
630 – COMMUNICATIONS 631000 Telephone Expense ADMIN 08 Dec 3125 3125
630 – COMMUNICATIONS 632000 Internet and Computer Expense MKTG 08 Jan 1750 1750
630 – COMMUNICATIONS 632000 Internet and Computer Expense MKTG 08 Feb 1750 1750
630 – COMMUNICATIONS 632000 Internet and Computer Expense MKTG 08 Mar 1750 1750
630 – COMMUNICATIONS 632000 Internet and Computer Expense MKTG 08 Apr 1750 1750
630 – COMMUNICATIONS 632000 Internet and Computer Expense MKTG 08 May 1750 1750
630 – COMMUNICATIONS 632000 Internet and Computer Expense MKTG 08 Jun 11500 11500 Set up b2b site
630 – COMMUNICATIONS 632000 Internet and Computer Expense MKTG 08 Jul 1750 1750

650 – SUPPLIES 651000 Office Supplies ADMIN 08 Oct 1800 1800
650 – SUPPLIES 651000 Office Supplies ADMIN 08 Nov 1800 1800
650 – SUPPLIES 651000 Office Supplies ADMIN 08 Dec 1800 1800
670 – DEPRECIATION 671000 Depreciation – Buildings ADMIN 08 Jan 48350 48350
670 – DEPRECIATION 671000 Depreciation – Buildings ADMIN 08 Feb 48350 48350
670 – DEPRECIATION 671000 Depreciation – Buildings ADMIN 08 Mar 48350 48350
670 – DEPRECIATION 671000 Depreciation – Buildings ADMIN 08 Apr 48350 48350
670 – DEPRECIATION 671000 Depreciation – Buildings ADMIN 08 May 48350 48350
670 – DEPRECIATION 671000 Depreciation – Buildings ADMIN 08 Jun 48350 48350
670 – DEPRECIATION 671000 Depreciation – Buildings ADMIN 08 Jul 48350 48350
690 – INSURANCE 691000 Insurance ADMIN 08 Jul 38460 38460
690 – INSURANCE 691000 Insurance ADMIN 08 Aug 38460 38460
690 – INSURANCE 691000 Insurance ADMIN 08 Sep 38460 38460
690 – INSURANCE 691000 Insurance ADMIN 08 Oct 38460 38460
710 – TAXES 711000 Federal Income Tax ADMIN 08 Oct 23120 23120
710 – TAXES 711000 Federal Income Tax ADMIN 08 Nov 23120 23120
710 – TAXES 711000 Federal Income Tax ADMIN 08 Dec 23120 23120
720 – MAINTENANCE 721000 Repairs & Maintenance ADMIN 08 Jan 4995 4995
790 – OTHER OPERATING 791000 Bad Debt Expense ADMIN 08 Jan 920 920
790 – OTHER OPERATING 791000 Bad Debt Expense ADMIN 08 Feb 920 920
790 – OTHER OPERATING 791000 Bad Debt Expense ADMIN 08 Mar 920 920
790 – OTHER OPERATING 791000 Bad Debt Expense ADMIN 08 Apr 920 920
790 – OTHER OPERATING 791000 Bad Debt Expense ADMIN 08 May 920 920
790 – OTHER OPERATING 791000 Bad Debt Expense ADMIN 08 Jun 920 920
790 – OTHER OPERATING 791000 Bad Debt Expense ADMIN 08 Jul 920 920
790 – OTHER OPERATING 791000 Bad Debt Expense ADMIN 08 Aug 920 920
790 – OTHER OPERATING 791000 Bad Debt Expense ADMIN 08 Sep 920 920
790 – OTHER OPERATING 791000 Bad Debt Expense ADMIN 08 Oct 920 920
790 – OTHER OPERATING 791000 Bad Debt Expense ADMIN 08 Nov 920 920
790 – OTHER OPERATING 791000 Bad Debt Expense ADMIN 08 Dec 920 920
790 – OTHER OPERATING 792000 Miscellaneous Expense ADMIN 08 Jan 3050 3050
790 – OTHER OPERATING 792000 Miscellaneous Expense ADMIN 08 Feb 3050 3050
790 – OTHER OPERATING 792000 Miscellaneous Expense ADMIN 08 Mar 3050 3050
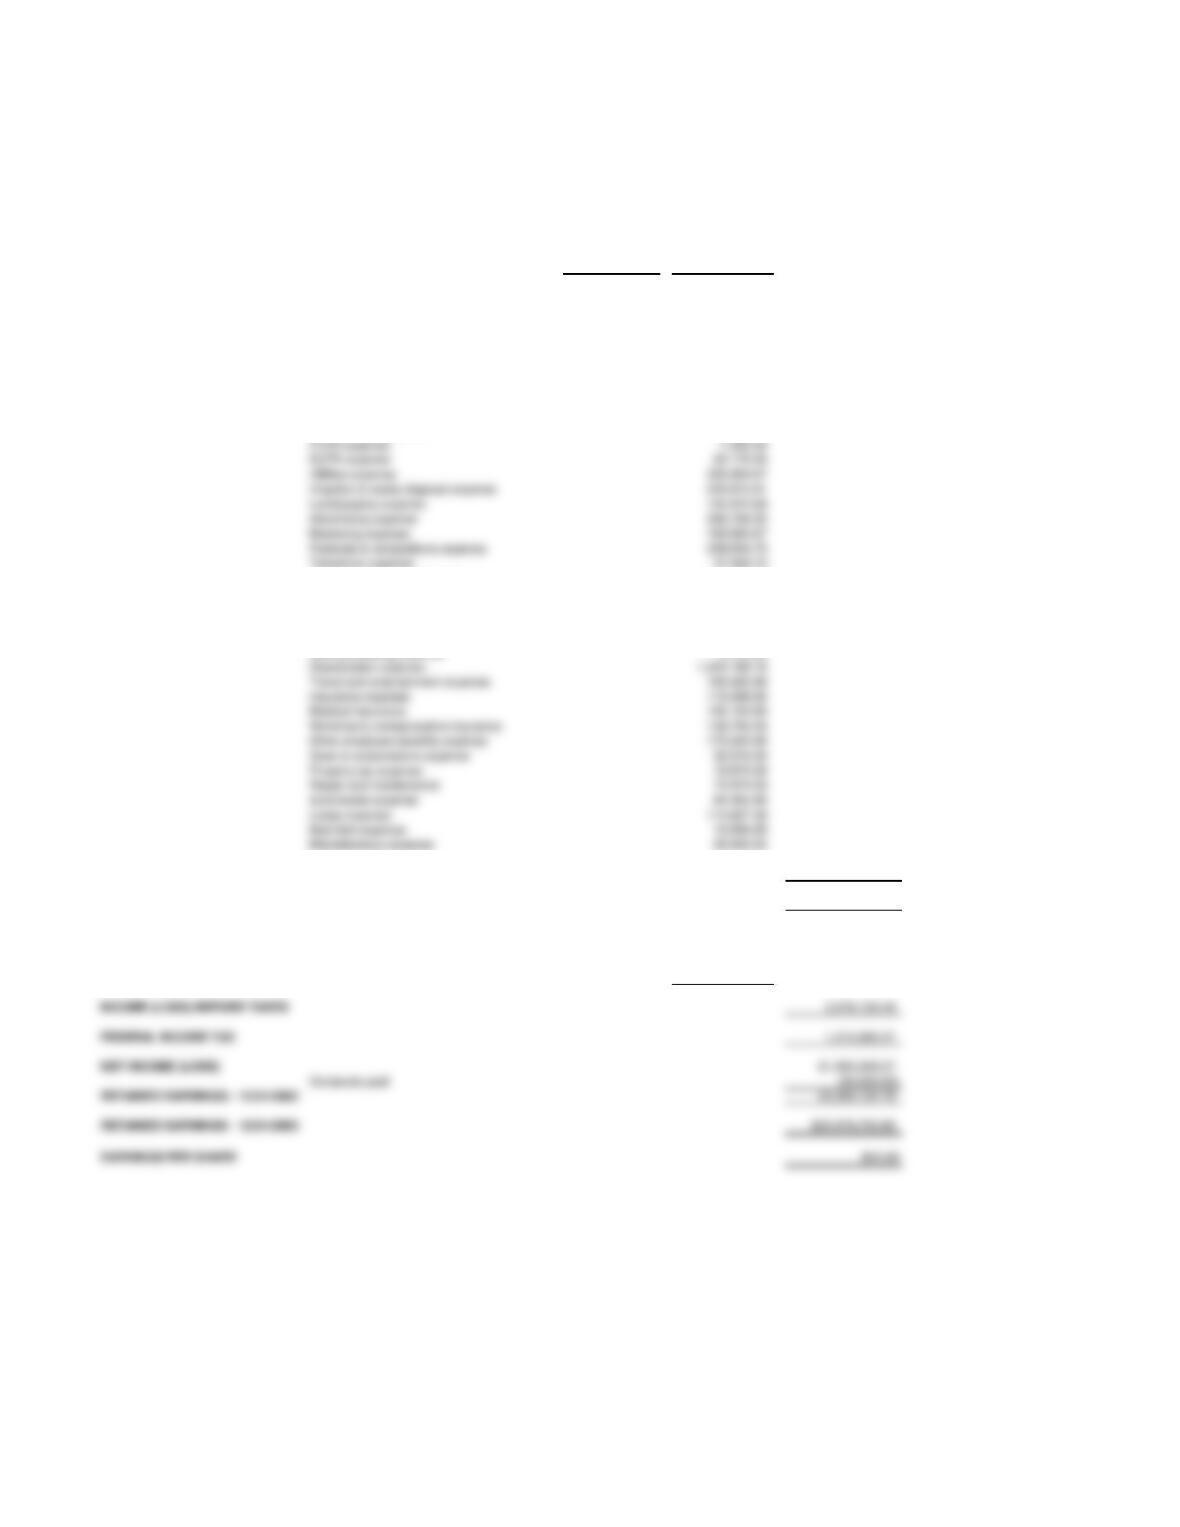
CHATEAU AMERICANA
YEAR-END WORKSHEET
12/31/2010
ACCT ACCOUNT
NO. TITLE
DEBIT CREDIT DEBIT CREDIT DEBIT CREDIT DEBIT CREDIT DEBIT CREDIT DEBIT CREDIT
ASSETS
111000 General checking account 2,138,784.99 2,142,990.31 2,142,990.31 2,142,990.31
112000 Payroll checking account 28,726.39 1,000.00 1,000.00 1,000.00
113000 Money market account 775,549.73 782,546.49 782,546.49 782,546.49
114000 Savings account 48,576.82 51,745.56 51,745.56 51,745.56
LIABILITIES
210000 Accounts payable 3,682,954.12 4,987,975.79 4,987,975.79 4,987,975.79
222100 Federal income tax withheld 64,442.36 67,385.78 67,385.78 67,385.78
222200 FICA withheld 12,107.35 12,681.48 12,681.48 12,681.48
222300 Medicare withheld 2,831.56 2,965.82 2,965.82 2,965.82
223100 FICA payable – employer 12,107.35 12,681.48 12,681.48 12,681.48
223200 Medicare payable – employer 2,831.56 2,965.82 2,965.82 2,965.82
223300 Unemployment taxes payable 846.39 943.57 943.57 943.57
230000 Other accrued expenses 568,998.06 599,411.86 599,411.86 599,411.86
235000 Federal income taxes payable 157,448.31 154,969.61 154,969.61 154,969.61
236000 Property taxes payable 0.00 0.00 0.00
239000 Dividends payable
240000 Mortgages payable 7,442,445.94 7,639,067.73 7,639,067.73 7,639,067.73
261000 Notes payable 654,000.00 816,500.00 816,500.00 816,500.00
STOCKHOLDERS’ EQUITY
310000 Common stock 90,000.00 90,000.00 90,000.00 90,000.00
311000 Paid-in capital in excess of par – common 3,567,265.00 3,567,265.00 3,567,265.00 3,567,265.00
312000 Dividends – common 0.00 50,000.00 50,000.00 50,000.00
390000 Retained earnings 22,064,134.78 22,064,134.78 22,064,134.78 22,064,134.78
REVENUE
410000 Sales 22,353,157.95 22,353,157.95 22,353,157.95
420000 Sales discounts 348,437.86 348,437.86 348,437.86
430000 Sales returns and allowances 15,718.26 15,718.26 15,718.26
491000 Dividend income 4,000.00 4,000.00 4,000.00
492000 Interest income 24,332.56 24,332.56 24,332.56
COST OF GOODS SOLD
510000 Cost of goods sold 11,569,808.59 11,569,808.59 11,569,808.59
EXPENSES
601000 Wages and salaries expense 1,972,322.74 1,972,322.74 1,972,322.74
601500 Sales commissions expense 771,665.60 771,665.60 771,665.60
602100 FICA tax expense 244,568.36 244,568.36 244,568.36
602200 Medicare tax expense 57,197.43 57,197.43 57,197.43
602300 FUTA expense 7,392.00 7,392.00 7,392.00
602400 SUTA expense 22,176.00 22,176.00 22,176.00
611000 Utilities expense 325,954.67 325,954.67 325,954.67
611300 Irrigation & waste disposal expense 230,910.91 230,910.91 230,910.91
612000 Landscaping expense 142,475.69 142,475.69 142,475.69
621000 Advertising expense 296,794.33 296,794.33 296,794.33
623000 Marketing expense 192,865.67 192,865.67 192,865.67
624000 Festivals & competitions expense 238,654.75 238,654.75 238,654.75
631000 Telephone expense 37,584.73 37,584.73 37,584.73
632000 Internet & computer expense 14,475.00 14,475.00 14,475.00
633000 Postage & shipping expense 35,117.66 35,117.66 35,117.66
641000 Legal & accounting fees 88,425.50 88,425.50 88,425.50
643000 Other consulting fees 12,500.00 12,500.00 12,500.00
651000 Office supplies expense 58,689.68 58,689.68 58,689.68
660000 Data processing expense 9,743.89 9,743.89 9,743.89
670000 Depreciation expense 1,201,199.16 1,201,199.16 1,201,199.16
680000 Travel and entertainment expense 169,405.86 169,405.86 169,405.86
691000 Other insurance expense 115,058.55 115,058.55 115,058.55
692000 Medical insurance 192,154.80 192,154.80 192,154.80
693000 Workmen‘s compensation insurance 139,750.00 139,750.00 139,750.00
699000 Other employee benefits expense 175,643.90 175,643.90 175,643.90
700000 Dues & subscriptions expense 32,076.00 32,076.00 32,076.00
711000 Federal income tax expense 857,595.76 154,969.61 1,012,565.37 1,012,565.37
712000 Property tax expense 19,875.00 19,875.00 19,875.00
721000 Repairs and maintenance 71,974.93 71,974.93 71,974.93
731000 Automobile expense 81,493.45 81,493.45 81,493.45
740000 Lease expense 113,607.56 113,607.56 113,607.56
791000 Bad debt expense 10,994.50 10,994.50 10,994.50
792000 Miscellaneous expense 26,665.63 26,665.63 26,665.63
793000 Interest expense 359,978.41 359,978.41 359,978.41
12-31-2009
12-31-2010
POST CLOSING
UNADJUSTED
ADJUSTMENTS
INCOME
BALANCE
TRIAL BALANCE
TRIAL BALANCE
TRIAL BALANCE
STATEMENT
SHEET
ADJUSTED
119000 Petty cash 500.00 500.00 500.00 500.00
121000 Accounts receivable 4,913,697.13 5,366,569.32 5,366,569.32 5,366,569.32
129000 Allowance for bad debts 97,459.89 95,401.58 10,994.50 106,396.08 106,396.08
141000 Inventory – production 10,407,164.74 11,577,948.87 11,577,948.87 11,577,948.87
145000 Inventory – finished goods 3,902,457.04 3,988,329.83 3,988,329.83 3,988,329.83
150000 Prepaid expenses 84,636.54 142,465.96 142,465.96 142,465.96
160000 Land and buildings 15,350,295.73 16,358,487.34 16,358,487.34 16,358,487.34
170000 Equipment 12,829,549.56 13,875,131.10 13,875,131.10 13,875,131.10
180000 Accumulated depreciation 14,140,830.31 15,342,029.47 15,342,029.47 15,342,029.47
191000 Investments 2,080,764.31 3,095,227.56 3,095,227.56 3,095,227.56
REVENUE
Sales $22,353,157.95
Less: Sales Discounts Taken $348,437.86
Sales Returns and Allowances 15,718.26 364,156.12
NET SALES $21,989,001.83
COST OF GOODS SOLD 11,569,808.59
GROSS MARGIN 10,419,193.24
OPERATING EXPENSES
Wages and salaries expense 1,972,322.74
Sales commissions expense 771,665.60
FICA tax expense 244,568.36
Medicare tax expense 57,197.43
Telephone expense 37,584.73
Internet & computer expense 14,475.00
Postage expense 35,117.66
Legal & accounting fees 88,425.50
Other consulting fees 12,500.00
Office supplies expense 58,689.68
Data processing expense 9,743.89
Depreciation expense 1,201,199.16
Travel and entertainment expense 169,405.86
Insurance expense 115,058.55
Medical insurance 192,154.80
Workmen‘s compensation insurance 139,750.00
Other employee benefits expense 175,643.90
Dues & subscriptions expense 32,076.00
Property tax expense 19,875.00
Repair and maintenance 71,974.93
Lease expense 113,607.56
Bad debt expense 10,994.50
Miscellaneous expense 26,665.63
TOTAL OPERATING EXPENSE 7,109,413.95
INCOME FROM OPERATIONS 3,309,779.29
OTHER INCOME AND EXPENSES
Dividend Income 4,000.00
Interest Income 24,332.56
Interest Expense 359,978.41 (331,645.85)
INCOME (LOSS) BEFORE TAXES 2,978,133.44
FEDERAL INCOME TAX 1,012,565.37
NET INCOME (LOSS) $1,965,568.07
Dividends paid (50,000.00)
RETAINED EARNINGS – 12/31/2002 22,064,134.78
CHATEAU AMERICANA
Statement of Income and Retained Earnings
For the Year Ended 12-31-10
FUTA expense 7,392.00
SUTA expense 22,176.00
Utilities expense 325,954.67
Irrigation & waste disposal expense 230,910.91
Landscaping expense 142,475.69
Advertising expense 296,794.33
Marketing expense 192,865.67
Festivals & competitions expense 238,654.75
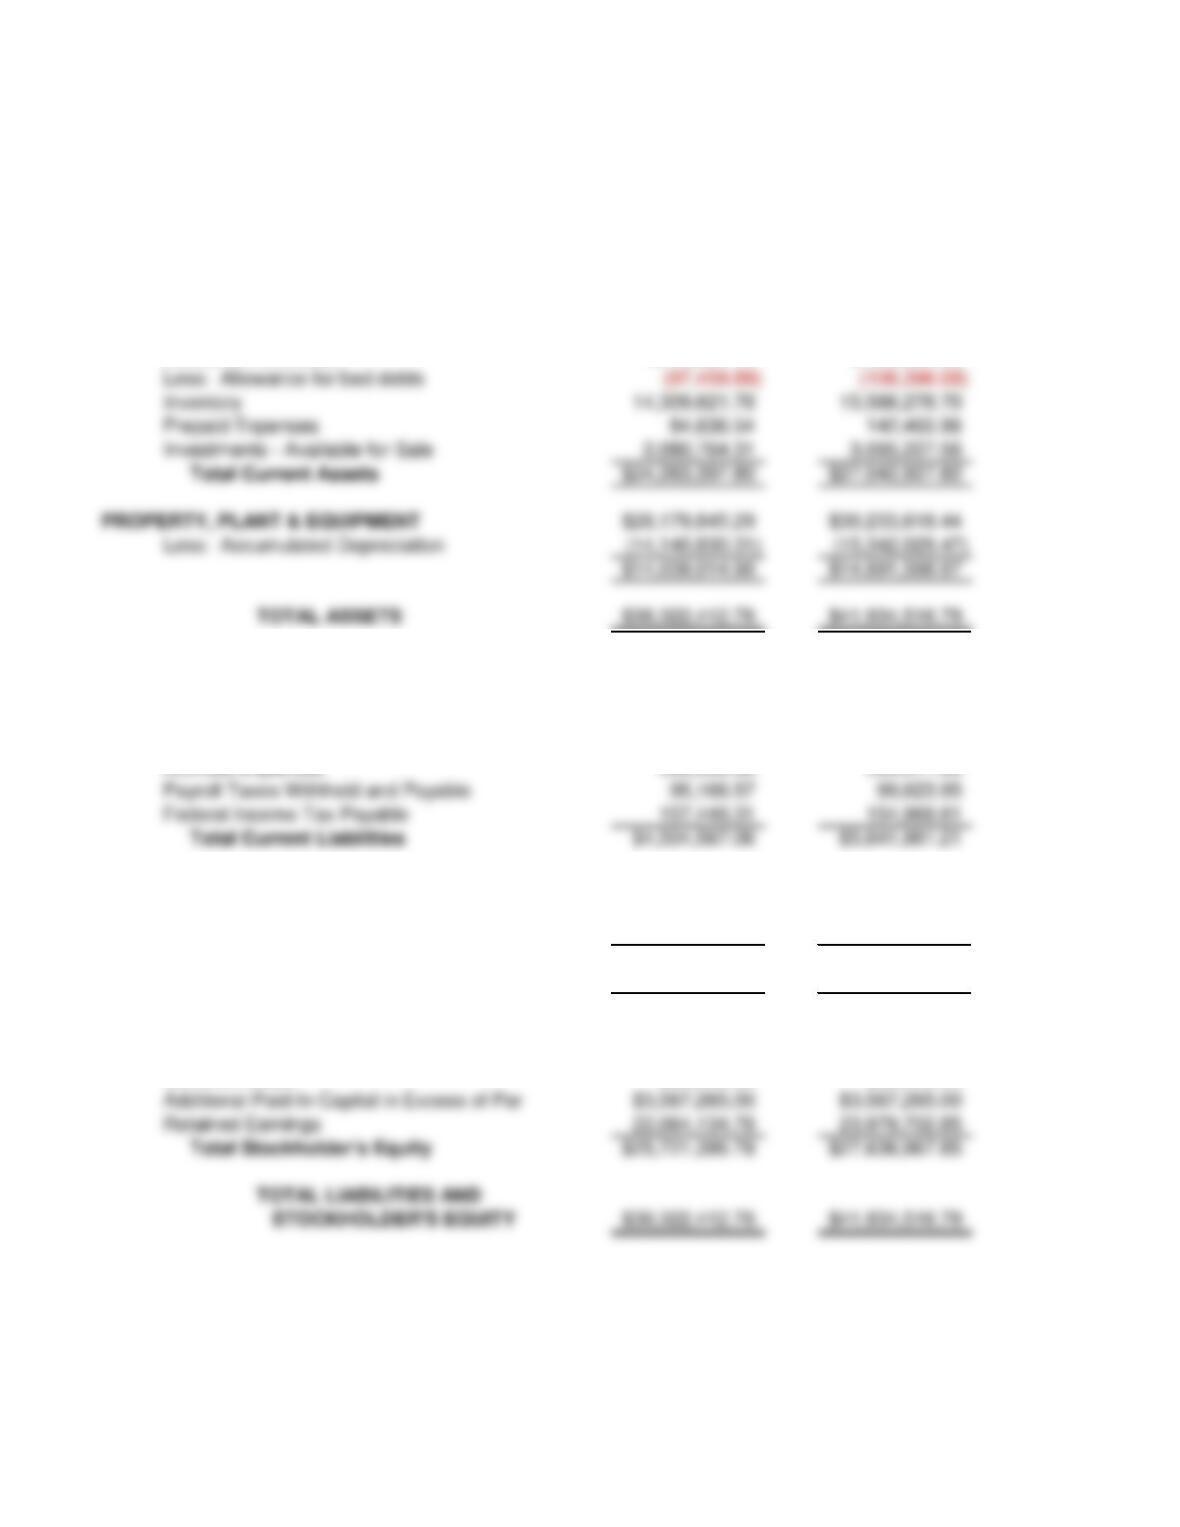
2009 2010
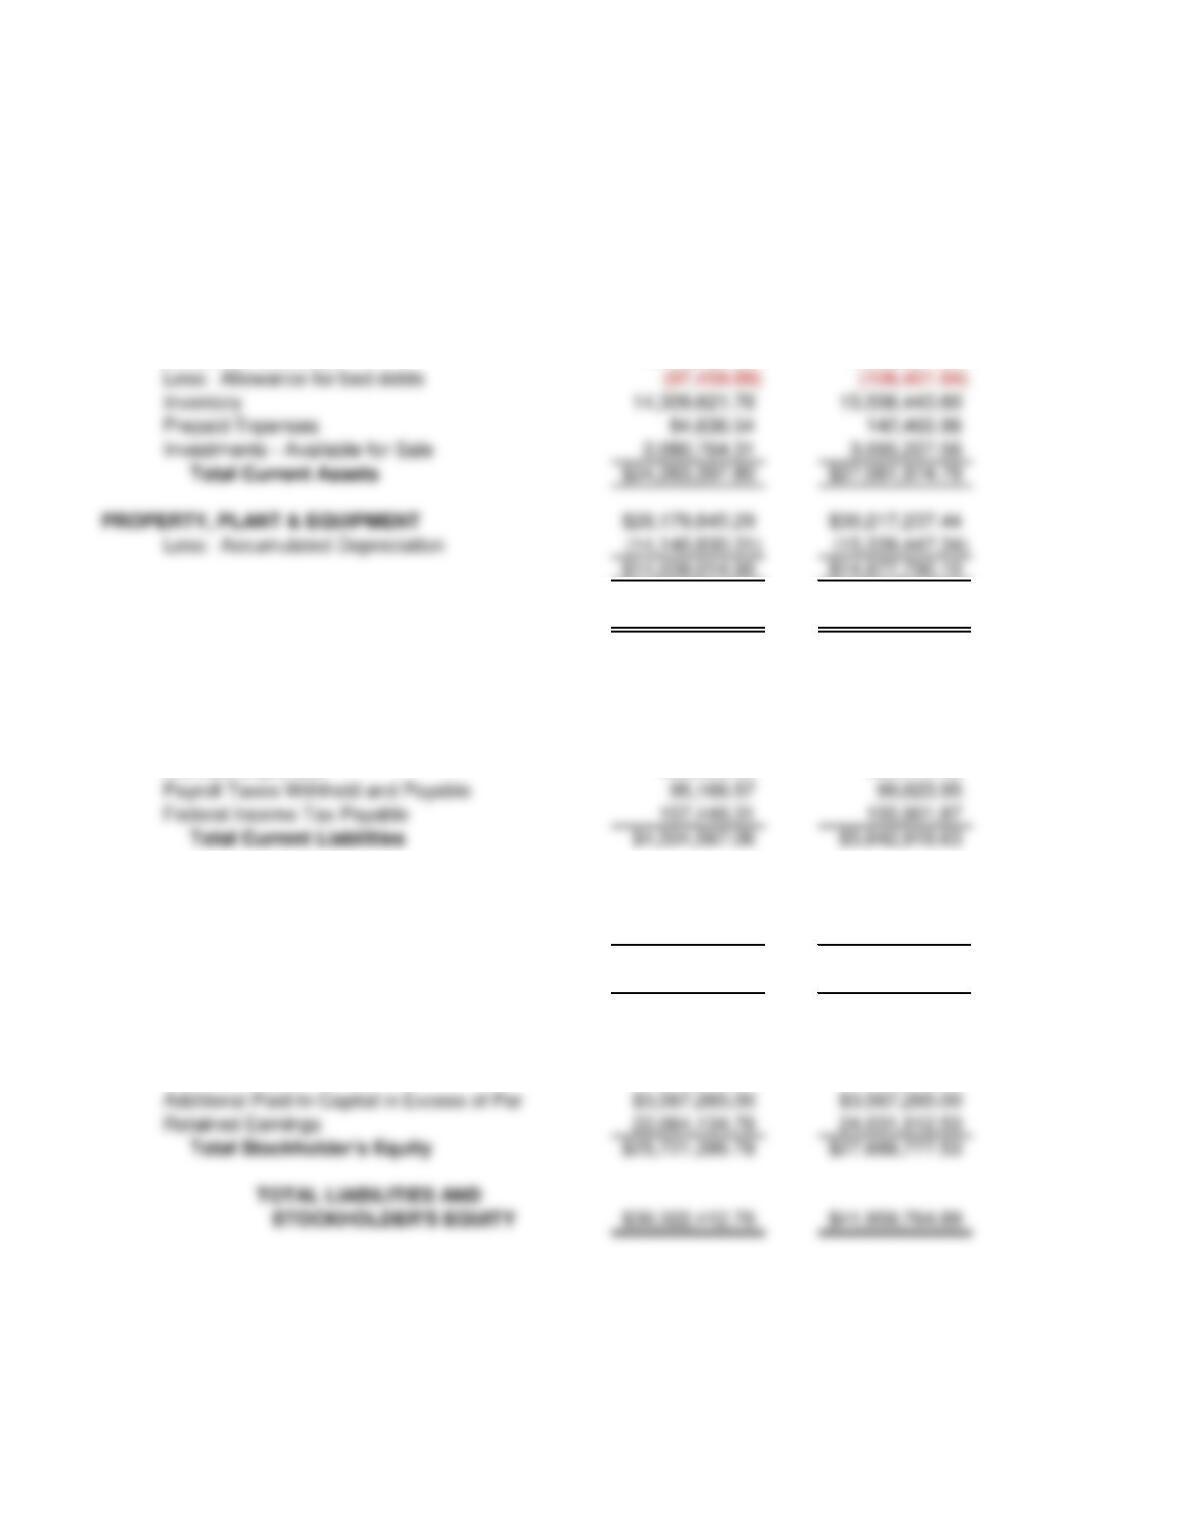
ASSETS
CURRENT ASSETS
Cash & Cash Equivalents $2,992,137.93 $2,978,782.36
Accounts Receivable
4,913,697.13 5,366,569.32
LIABILITIES AND STOCKHOLDER‘S EQUITY
CURRENT LIABILITIES
Accounts Payable $3,682,954.12 $4,987,975.79
Total Current Liabilities $4,504,567.06 $5,841,981.21
Accrued Expenses 568,998.06 599,411.86
LONG-TERM LIABILITIES
Mortgage Payable $7,442,445.94 $7,639,067.73
Note payable 654,000.00 816,500.00
Total Long-Term Liabilities
$8,096,445.94 $8,455,567.73
Total Liabilities $12,601,013.00 $14,297,548.94
STOCKHOLDERS’ EQUITY
Common Stock $90,000.00 $90,000.00
Total Stockholder’s Equity $25,721,399.78 $27,636,967.85
CHATEAU AMERICANA
Balance Sheet
For the Year Ending 12-31-10
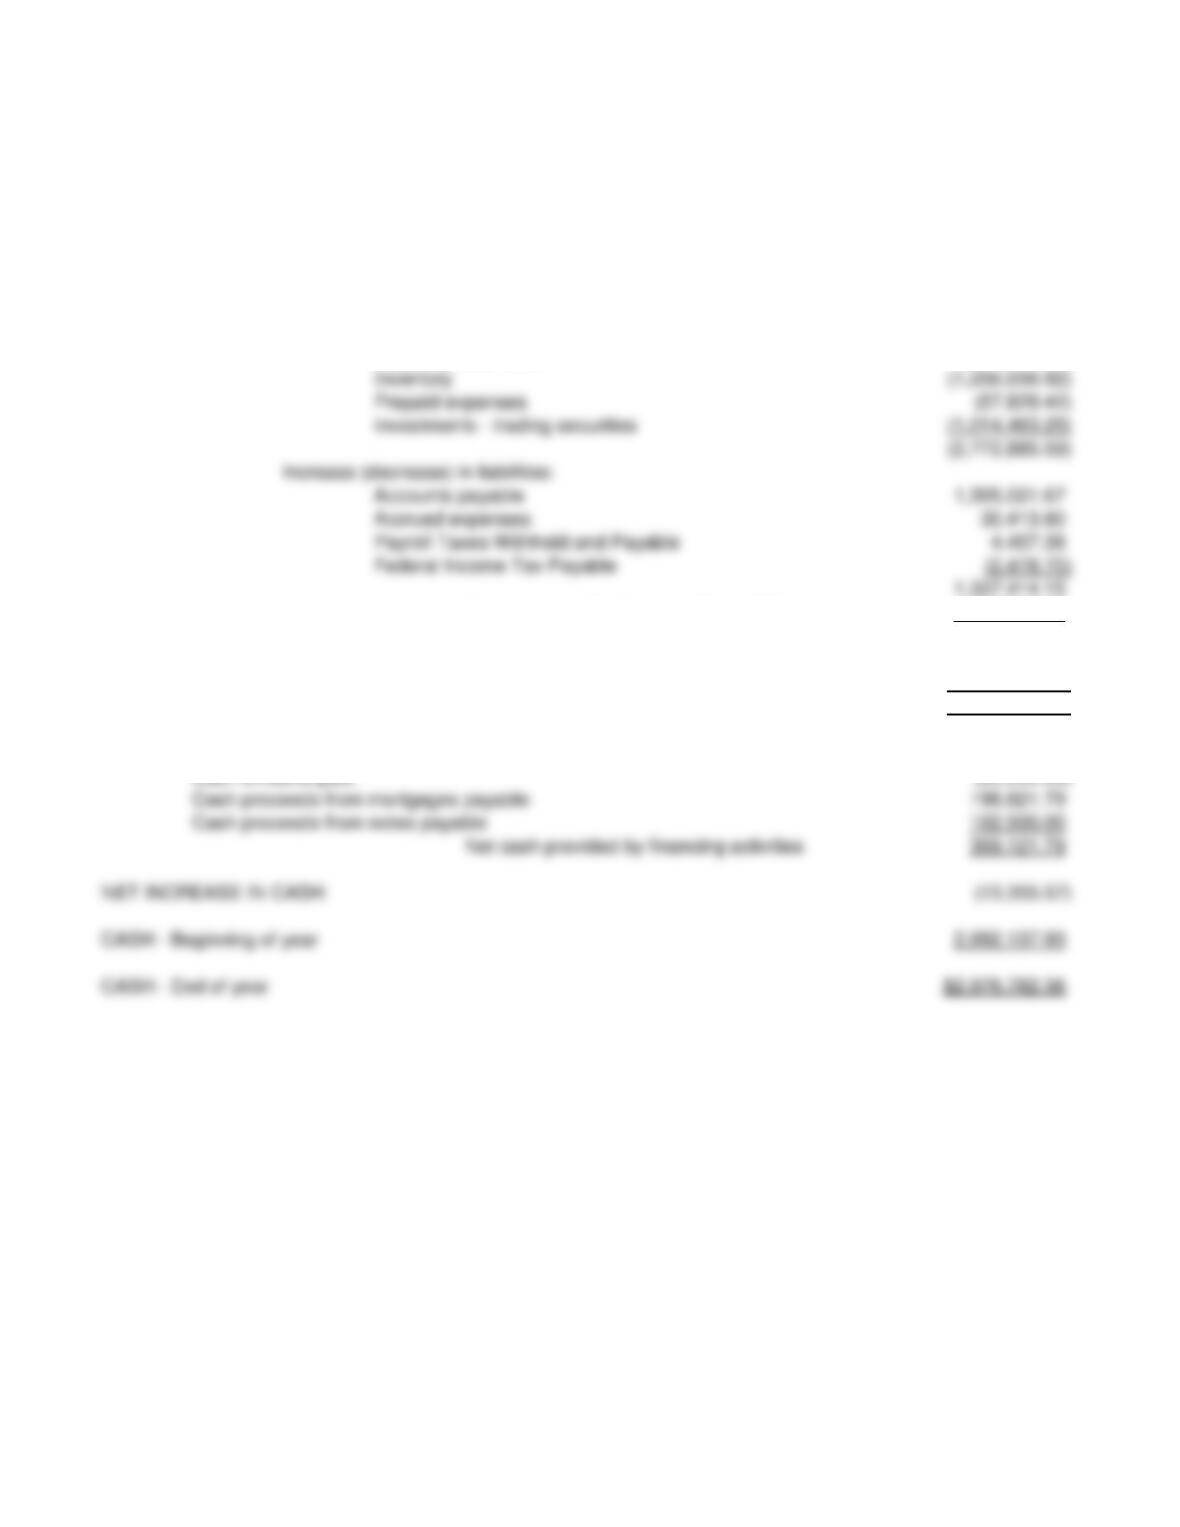
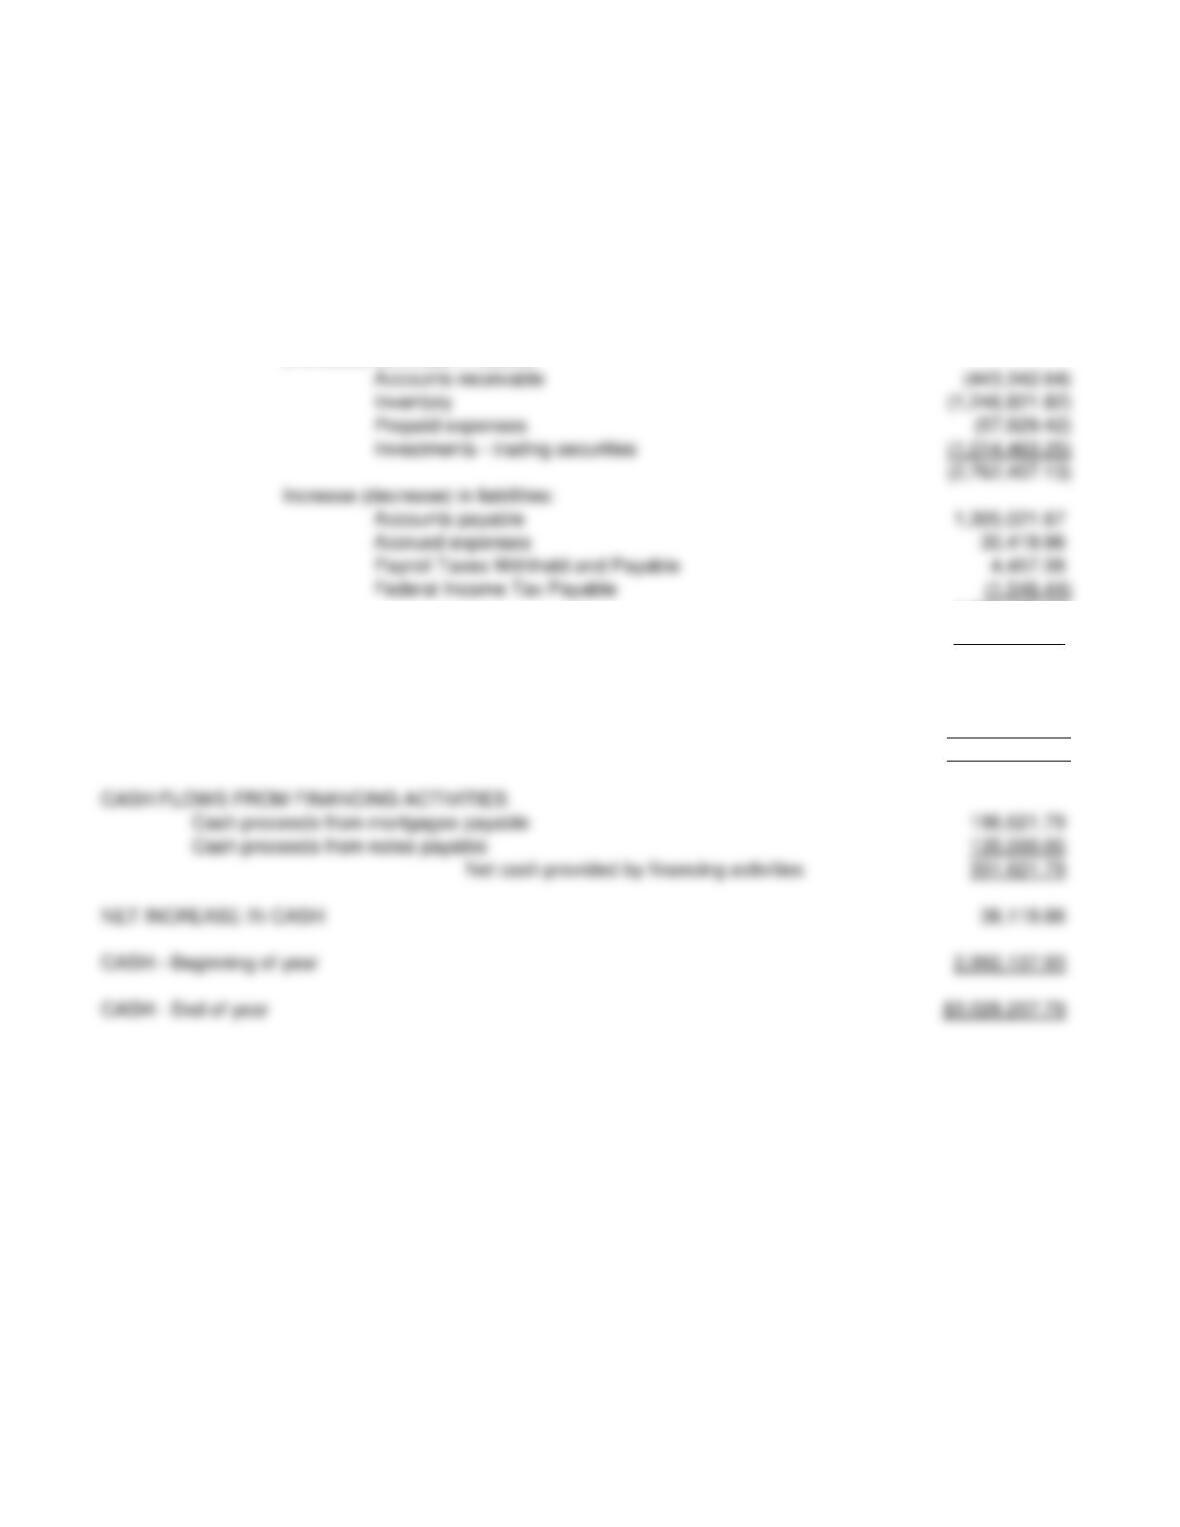
CASH FLOWS FROM OPERATING ACTIVITIES
Net income $1,965,568.07
Adjustments from operating activities
Depreciation 1,201,199.16
(Increase) decrease in assets:
Accounts receivable (443,936.00)
Net cash provided by operating activities 1,731,295.79
CASH FLOWS FROM INVESTING ACTIVITIES
Purchase of fixed assets (2,053,773.15)
Net cash used in investing activities (2,053,773.15)
CASH FLOWS FROM FINANCING ACTIVITIES
CHATEAU AMERICANA
Statement of Cash Flows
For the Year Ending 12-31-10

Preparer: Laura Ingraham
Date: 3/16/2023
Current Ratio 4.63
CHATEAU AMERICANA
Financial Statement Analysis
For the Year Ended 12/31/2010

CHATEAU AMERICANA
YEAR-END WORKSHEET
12/31/2010
ACCT ACCOUNT
NO. TITLE
DEBIT CREDIT DEBIT CREDIT DEBIT CREDIT DEBIT CREDIT DEBIT CREDIT DEBIT CREDIT
ASSETS
111000 General checking account 2,138,784.99 2,192,465.74 2,192,465.74 2,192,465.74
112000 Payroll checking account 28,726.39 1,000.00 1,000.00 1,000.00
113000 Money market account 775,549.73 782,546.49 782,546.49 782,546.49
114000 Savings account 48,576.82 51,745.56 51,745.56 51,745.56
119000 Petty cash 500.00 500.00 500.00 500.00
121000 Accounts receivable 4,913,697.13 5,365,981.82 5,365,981.82 5,365,981.82
129000 Allowance for bad debts 97,459.89 95,401.58 11,000.36 106,401.94 106,401.94
141000 Inventory – production 10,407,164.74 11,579,640.97 11,579,640.97 11,579,640.97
145000 Inventory – finished goods 3,902,457.04 3,976,802.63 3,976,802.63 3,976,802.63
150000 Prepaid expenses 84,636.54 142,465.96 142,465.96 142,465.96
160000 Land and buildings 15,350,295.73 16,358,487.34 16,358,487.34 16,358,487.34
170000 Equipment 12,829,549.56 13,858,750.10 13,858,750.10 13,858,750.10
180000 Accumulated depreciation 14,140,830.31 15,339,447.34 15,339,447.34 15,339,447.34
191000 Investments 2,080,764.31 3,095,227.56 3,095,227.56 3,095,227.56
LIABILITIES
210000 Accounts payable 3,682,954.12 4,987,975.79 4,987,975.79 4,987,975.79
222100 Federal income tax withheld 64,442.36 67,385.78 67,385.78 67,385.78
222200 FICA withheld 12,107.35 12,681.48 12,681.48 12,681.48
STOCKHOLDERS’ EQUITY
310000 Common stock 90,000.00 90,000.00 90,000.00 90,000.00
311000 Paid-in capital in excess of par – common 3,567,265.00 3,567,265.00 3,567,265.00 3,567,265.00
312000 Dividends – common 0.00 0.00 0.00
390000 Retained earnings 22,064,134.78 22,064,134.78 22,064,134.78 22,064,134.78
REVENUE
410000 Sales 22,365,119.35 22,365,119.35 22,365,119.35
420000 Sales discounts 348,667.11 348,667.11 348,667.11
430000 Sales returns and allowances 15,736.88 15,736.88 15,736.88
451000 Gain/Loss – Fixed Assets 2,257.08 2,257.08 2,257.08
491000 Dividend income 4,000.00 4,000.00 4,000.00
492000 Interest income 24,332.56 24,332.56 24,332.56
COST OF GOODS SOLD
510000 Cost of goods sold 11,581,335.79 11,581,335.79 11,581,335.79
EXPENSES
601000 Wages and salaries expense 1,972,322.74 1,972,322.74 1,972,322.74
601500 Sales commissions expense 771,665.60 771,665.60 771,665.60
602100 FICA tax expense 244,568.36 244,568.36 244,568.36
602200 Medicare tax expense 57,197.43 57,197.43 57,197.43
602300 FUTA expense 7,392.00 7,392.00 7,392.00
602400 SUTA expense 22,176.00 22,176.00 22,176.00
611000 Utilities expense 326,338.17 326,338.17 326,338.17
611300 Irrigation & waste disposal expense 230,910.91 230,910.91 230,910.91
612000 Landscaping expense 142,475.69 142,475.69 142,475.69
621000 Advertising expense 296,794.33 296,794.33 296,794.33
623000 Marketing expense 192,865.67 192,865.67 192,865.67
624000 Festivals & competitions expense 238,654.75 238,654.75 238,654.75
631000 Telephone expense 37,584.73 37,584.73 37,584.73
632000 Internet & computer expense 14,475.00 14,475.00 14,475.00
633000 Postage & shipping expense 35,117.66 35,117.66 35,117.66
641000 Legal & accounting fees 88,425.50 88,425.50 88,425.50
643000 Other consulting fees 12,500.00 12,500.00 12,500.00
651000 Office supplies expense 58,689.68 58,689.68 58,689.68
660000 Data processing expense 9,743.89 9,743.89 9,743.89
670000 Depreciation expense 1,200,505.11 1,200,505.11 1,200,505.11
680000 Travel and entertainment expense 169,405.86 169,405.86 169,405.86
691000 Other insurance expense 115,058.55 115,058.55 115,058.55
692000 Medical insurance 192,154.80 192,154.80 192,154.80
693000 Workmen‘s compensation insurance 139,750.00 139,750.00 139,750.00
699000 Other employee benefits expense 175,643.90 175,643.90 175,643.90
700000 Dues & subscriptions expense 32,076.00 32,076.00 32,076.00
711000 Federal income tax expense 857,595.76 155,901.87 1,013,497.63 1,013,497.63
712000 Property tax expense 19,875.00 19,875.00 19,875.00
721000 Repairs and maintenance 71,974.93 71,974.93 71,974.93
731000 Automobile expense 81,493.45 81,493.45 81,493.45
740000 Lease expense 113,607.56 113,607.56 113,607.56
791000 Bad debt expense 11,000.36 11,000.36 11,000.36
792000 Miscellaneous expense 26,665.63 26,665.63 26,665.63
793000 Interest expense 359,984.57 359,984.57 359,984.57
12-31-2009
12-31-2010
POST CLOSING
UNADJUSTED
ADJUSTMENTS
INCOME
BALANCE
TRIAL BALANCE
TRIAL BALANCE
TRIAL BALANCE
STATEMENT
SHEET
ADJUSTED
222300 Medicare withheld 2,831.56 2,965.82 2,965.82 2,965.82
223100 FICA payable – employer 12,107.35 12,681.48 12,681.48 12,681.48
223200 Medicare payable – employer 2,831.56 2,965.82 2,965.82 2,965.82
223300 Unemployment taxes payable 846.39 943.57 943.57 943.57
230000 Other accrued expenses 568,998.06 599,418.02 599,418.02 599,418.02
235000 Federal income taxes payable 157,448.31 155,901.87 155,901.87 155,901.87
236000 Property taxes payable 0.00 0.00 0.00
239000 Dividends payable 0.00 0.00 0.00
240000 Mortgages payable 7,442,445.94 7,639,067.73 7,639,067.73 7,639,067.73
261000 Notes payable 654,000.00 789,000.00 789,000.00 789,000.00
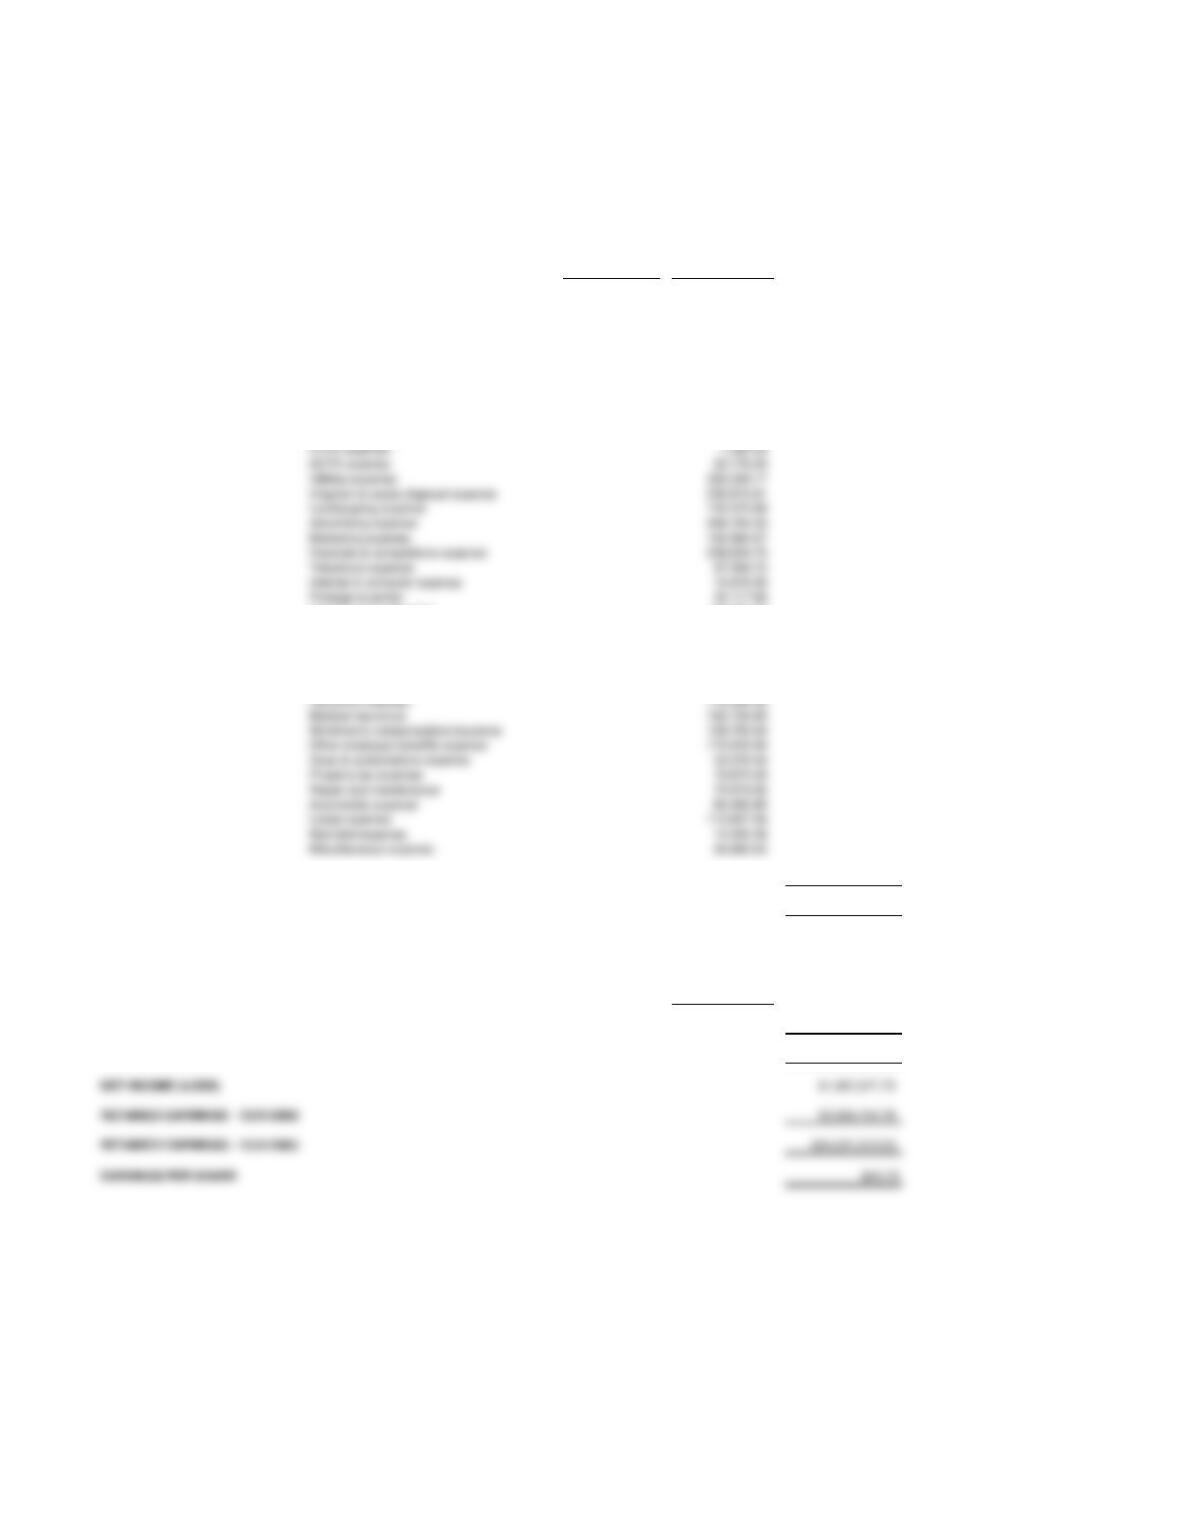
REVENUE
Sales $22,365,119.35
Less: Sales Discounts Taken $348,667.11
Sales Returns and Allowances 15,736.88 364,403.99
NET SALES $22,000,715.36
COST OF GOODS SOLD 11,581,335.79
GROSS MARGIN 10,419,379.57
OPERATING EXPENSES
Wages and salaries expense 1,972,322.74
Sales commissions expense 771,665.60
FICA tax expense 244,568.36
Medicare tax expense 57,197.43
Legal & accounting fees 88,425.50
Other consulting fees 12,500.00
Office supplies expense 58,689.68
Data processing expense 9,743.89
Depreciation expense 1,200,505.11
Travel and entertainment expense 169,405.86
Insurance expense 115,058.55
Medical insurance 192,154.80
Workmen‘s compensation insurance 139,750.00
Other employee benefits expense 175,643.90
Dues & subscriptions expense 32,076.00
Property tax expense 19,875.00
Repair and maintenance 71,974.93
Automobile expense 81,493.45
Lease expense 113,607.56
Bad debt expense 11,000.36
Miscellaneous expense 26,665.63
TOTAL OPERATING EXPENSE 7,109,109.26
INCOME FROM OPERATIONS 3,310,270.31
OTHER INCOME AND EXPENSES
Gain/Loss – Fixed Assets 2,257.08
Dividend Income 4,000.00
Interest Income 24,332.56
Interest Expense 359,984.57 (329,394.93)
INCOME (LOSS) BEFORE TAXES 2,980,875.38
FEDERAL INCOME TAX 1,013,497.63
NET INCOME (LOSS) $1,967,377.75
RETAINED EARNINGS – 12/31/2002 22,064,134.78
CHATEAU AMERICANA
Statement of Income and Retained Earnings
For the Year Ended 12-31-10
FUTA expense 7,392.00
SUTA expense 22,176.00
Irrigation & waste disposal expense 230,910.91
Landscaping expense 142,475.69
Advertising expense 296,794.33
Marketing expense 192,865.67
Festivals & competitions expense 238,654.75
Telephone expense 37,584.73
Internet & computer expense 14,475.00
Postage expense 35,117.66
2009 2010
ASSETS
CURRENT ASSETS
Cash & Cash Equivalents $2,992,137.93 $3,028,257.79
Accounts Receivable
4,913,697.13 5,365,981.82
TOTAL ASSETS $38,322,412.78 $41,959,764.89
LIABILITIES AND STOCKHOLDER‘S EQUITY
CURRENT LIABILITIES
Accounts Payable $3,682,954.12 $4,987,975.79
Total Current Liabilities $4,504,567.06 $5,842,919.63
Accrued Expenses 568,998.06 599,418.02
LONG-TERM LIABILITIES
Mortgage Payable $7,442,445.94 $7,639,067.73
Note payable 654,000.00 789,000.00
Total Long-Term Liabilities
$8,096,445.94 $8,428,067.73
Total Liabilities $12,601,013.00 $14,270,987.36
STOCKHOLDERS’ EQUITY
Common Stock $90,000.00 $90,000.00
Total Stockholder’s Equity $25,721,399.78 $27,688,777.53
STOCKHOLDER’S EQUITY $38,322,412.78 $41,959,764.89
CHATEAU AMERICANA
Balance Sheet
For the Year Ending 12-31-10
CASH FLOWS FROM OPERATING ACTIVITIES
Net income $1,967,377.75
Adjustments from operating activities
Depreciation 1,200,505.11
Gain/loss on sale of fixed assets (2,257.08)
(Increase) decrease in assets:
1,338,352.57
Net cash provided by operating activities 1,741,521.22
CASH FLOWS FROM INVESTING ACTIVITIES
Proceeds from sale of fixed assets 19,250.00
Purchase of fixed assets (2,056,273.15)
Net cash used in investing activities (2,037,023.15)
CHATEAU AMERICANA
Statement of Cash Flows
For the Year Ending 12-31-10
Preparer: Laura Ingraham
Date: 3/16/2023
Current Ratio 4.64
CHATEAU AMERICANA
Financial Statement Analysis
For the Year Ended 12/31/2010