
4-13
Chapter 4: Communicating with Visuals
Point out to your students the discussion concerning chartjunk in the Communication Matters box titled
“Avoiding Chartjunk.”
Slide 4-40
You Make the Call
Challenge students to consider the ethical issues behind selecting and constructing visuals.
Placing Visuals
Slide 4-41
You can use this slide to discuss placement of graphics.
Place graphics as near as possible to the text coverage of the graphic’s contents. If the graphic is small
(less than one page), place it within the text layout after first reference to it. If the graphic is large (one
page), place it on the page following the first reference to it.
Place graphics in the appendix if they do not directly support the text. Do not force readers to flip to an
appendix to see graphics that should support textual analysis. Omit graphics that serve no useful purpose.
Connect Assignment 4-2 (a-e): Improving Communication at Oakdale Hospital
4-2a
Learning Objectives: 4-01, 4-02

4-14
Chapter 4: Communicating with Visuals
4-2b
Learning Objectives: 4-01, 4-02
4-2c
Learning Objectives: 4-01, 4-03, 4-04
4-2d
Learning Objective: 4-06
4-2e
Learning Objective: 4-01
Difficulty: Hard
AACSB: Analytical Thinking
Blooms: Understand
Slide 4-42
You can use this quote from Yale professor and graphics authority Edward Tufte to close the presentation
Power Charge Your Professionalism: Use Numbers Correctly
Numbers, like capitalization, probably have the most variation in standards for their use. Reference
Chapter A presents standards that are common to business. Keep in mind that if you work in health care
or the humanities, these standards may be different, but for this exercise, be sure you use Reference
2. Our shareholders are meeting on March _____.

4-15
Chapter 4: Communicating with Visuals
3. The graduation rate for students who are involved in campus organizations is _____ percent greater
than it is for those who are not.
4. You can receive _____ off on your next order if you take our online survey.
5. Your checked bag should not weight more than _____ pounds.
6. The deadline for submitting applications is the _____ of June.
7. The closet in my office is _____ feet long and _____ feet wide.
8. Our division’s staff consists of _____ manager, _____ supervisors, _____ administrative assistants,
_____ senior accountants, and _____ junior accountants.
Number use is important because…
.
– Using numbers correctly will ensure that your reader does not misinterpret or misunderstand
your meaning.
For further instruction on using the right word, see “Numbers” in the “Grammar” section of LearnSmart
Achieve.

4-16
Chapter 4: Communicating with Visuals
Critical-Thinking Questions
1. For the past 20 years, Professor Clark Kupenheimer has required that his students include
five visuals in the long, formal report he assigns. Evaluate this requirement. (LO1)
2. Because it was easier to do, a report writer prepared each of the visuals on a full page. Some
of these visuals were extremely complex; some were very simple. Comment on this practice.
(LO1, LO6)
3. A report has five maps, four tables, one chart, one diagram, and one photograph. How would
you number these visuals? (LO2)
4. How would you number these visuals in a report: seven tables, six charts, and nine maps?
(LO2)
5. Discuss the techniques that may be used to show quantitative differences between areas on a
statistical map. (LO4)
6. Give examples of data that are suited for presentation in three dimensions. (LO4)
7. Discuss the advantages and disadvantages of using pictographs. (LO4)

4-17
Chapter 4: Communicating with Visuals
8. Find a graph that uses scale breaks. Discuss the possible effects of its use on the reader.
(LO5)
9. Find a visual with errors in format. Tell how you would correct the errors to present the
chart’s data more clearly to the reader. (LO5)
10. “I have placed every visual near the place I write about it. The reader can see the visual
without any additional help from me. It just doesn’t make sense to direct the reader’s
attention to the visuals with words.” Evaluate this comment. (LO6)
Skills-Building Exercises
1. Construct a complete, concise title for a line chart representing employment placement
rates for graduates in your major at your school from 2014 to the present. (LO2)
2. The chart prepared in Exercise 1 requires an explanation for the academic years 2015 and
2016. In each of those years, data were collected in January (mid-academic year) rather
than June (end of the academic year). Provide the necessary explanation. (LO6)
3. For each of the types of information described below, which form of visual would you use?
Explain your decision. (LO1–4)
a. Record of annual sales for Kenyon Company for the past 20 years.
b. Comparison of Kenyon Company sales, by product, for this year and last year.

4-18
Chapter 4: Communicating with Visuals
4-19
Chapter 4: Communicating with Visuals
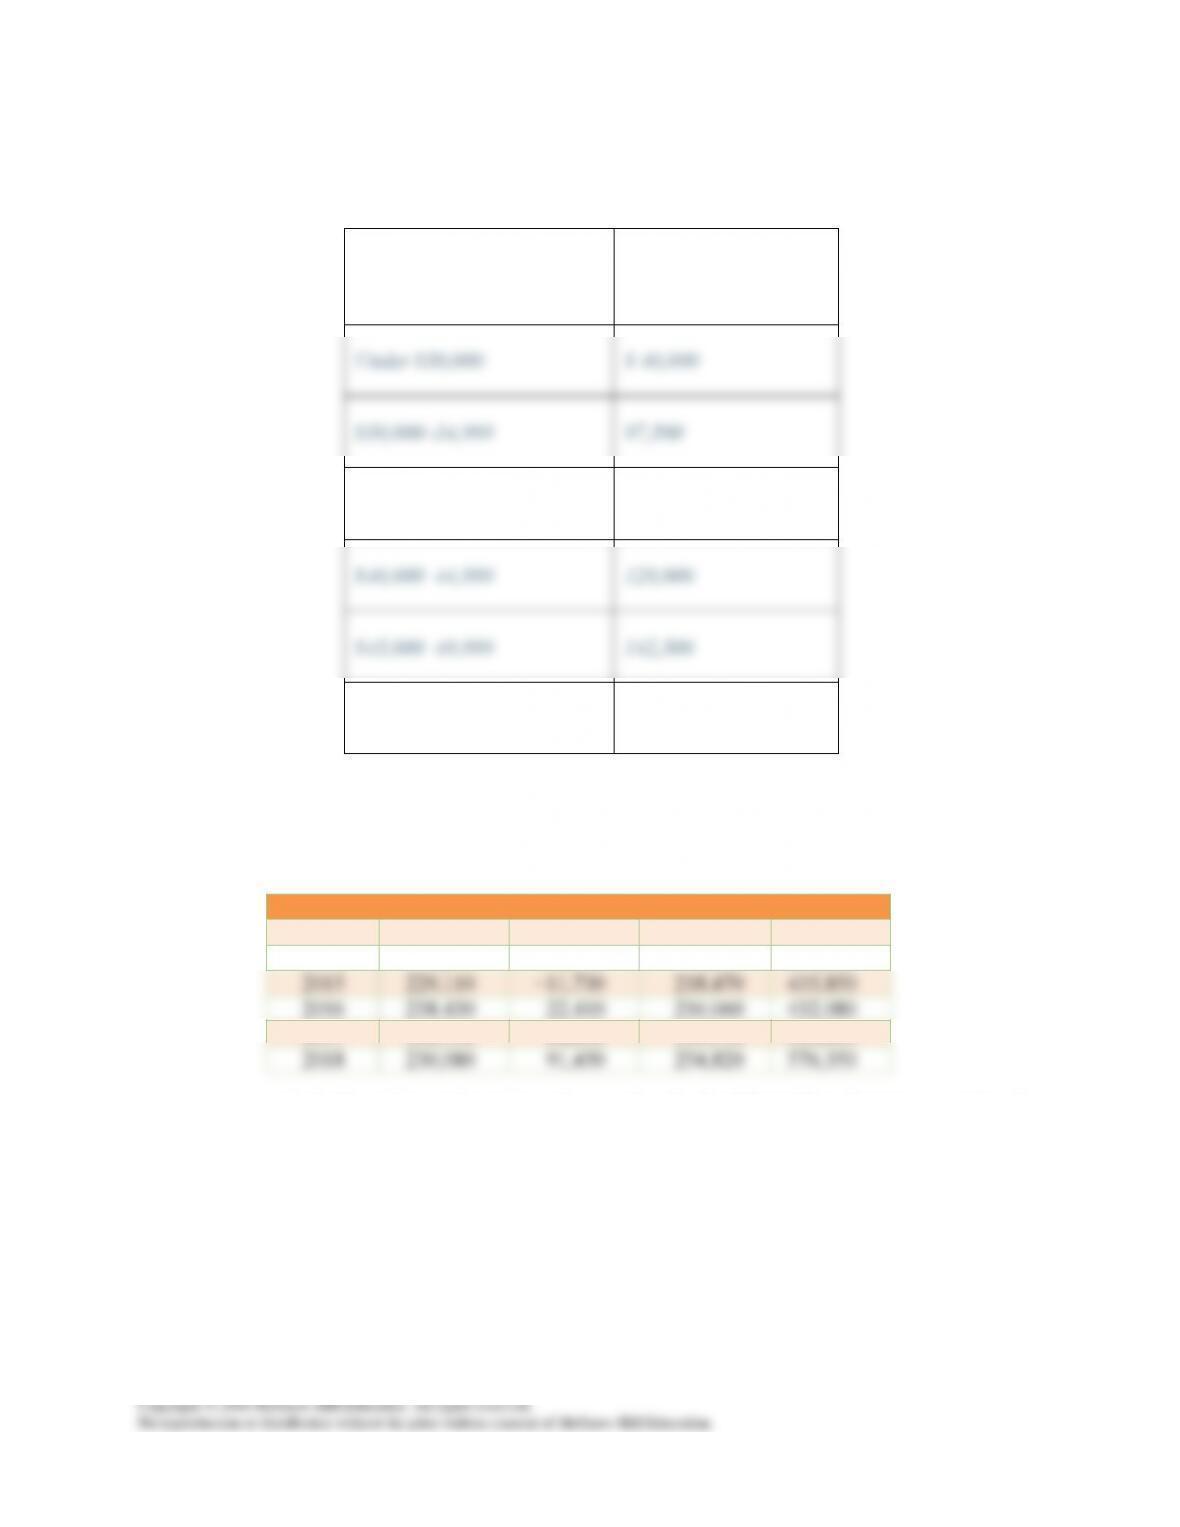
a. Average (mean) amount of life insurance owned by Mutual Life Insurance
Company policyholders; classification is by annual income
Income
Average Life
Insurance
Under $30,000
$ 40,000
$30,000–34,999
97,500
$35,000–39,999
112,500
$40,000–44,999
129,000
$45,000–49,999
142,500
$50,000 and over
225,000
A simple bar chart is probably best here since the data consist of a single series (value of
insurance) classified on one basis (income).
b. Profits and losses for Organic Whole Foods Stores, by store, 2014–2018, in dollars
Store
Year
Able City
Baker
Charleston
Total
2014
234,210
132,410
97,660
464,280
2015
229,110
−11,730
218,470
435,850
2016
238,430
−22,410
216,060
432,080
2017
226,730
68,650
235,510
530,890
2018
230,080
91,450
254,820
576,350
As both positive and negative values are involved, a bilateral bar chart is appropriate. It
would require multiple bars to show each of the cities for each year.
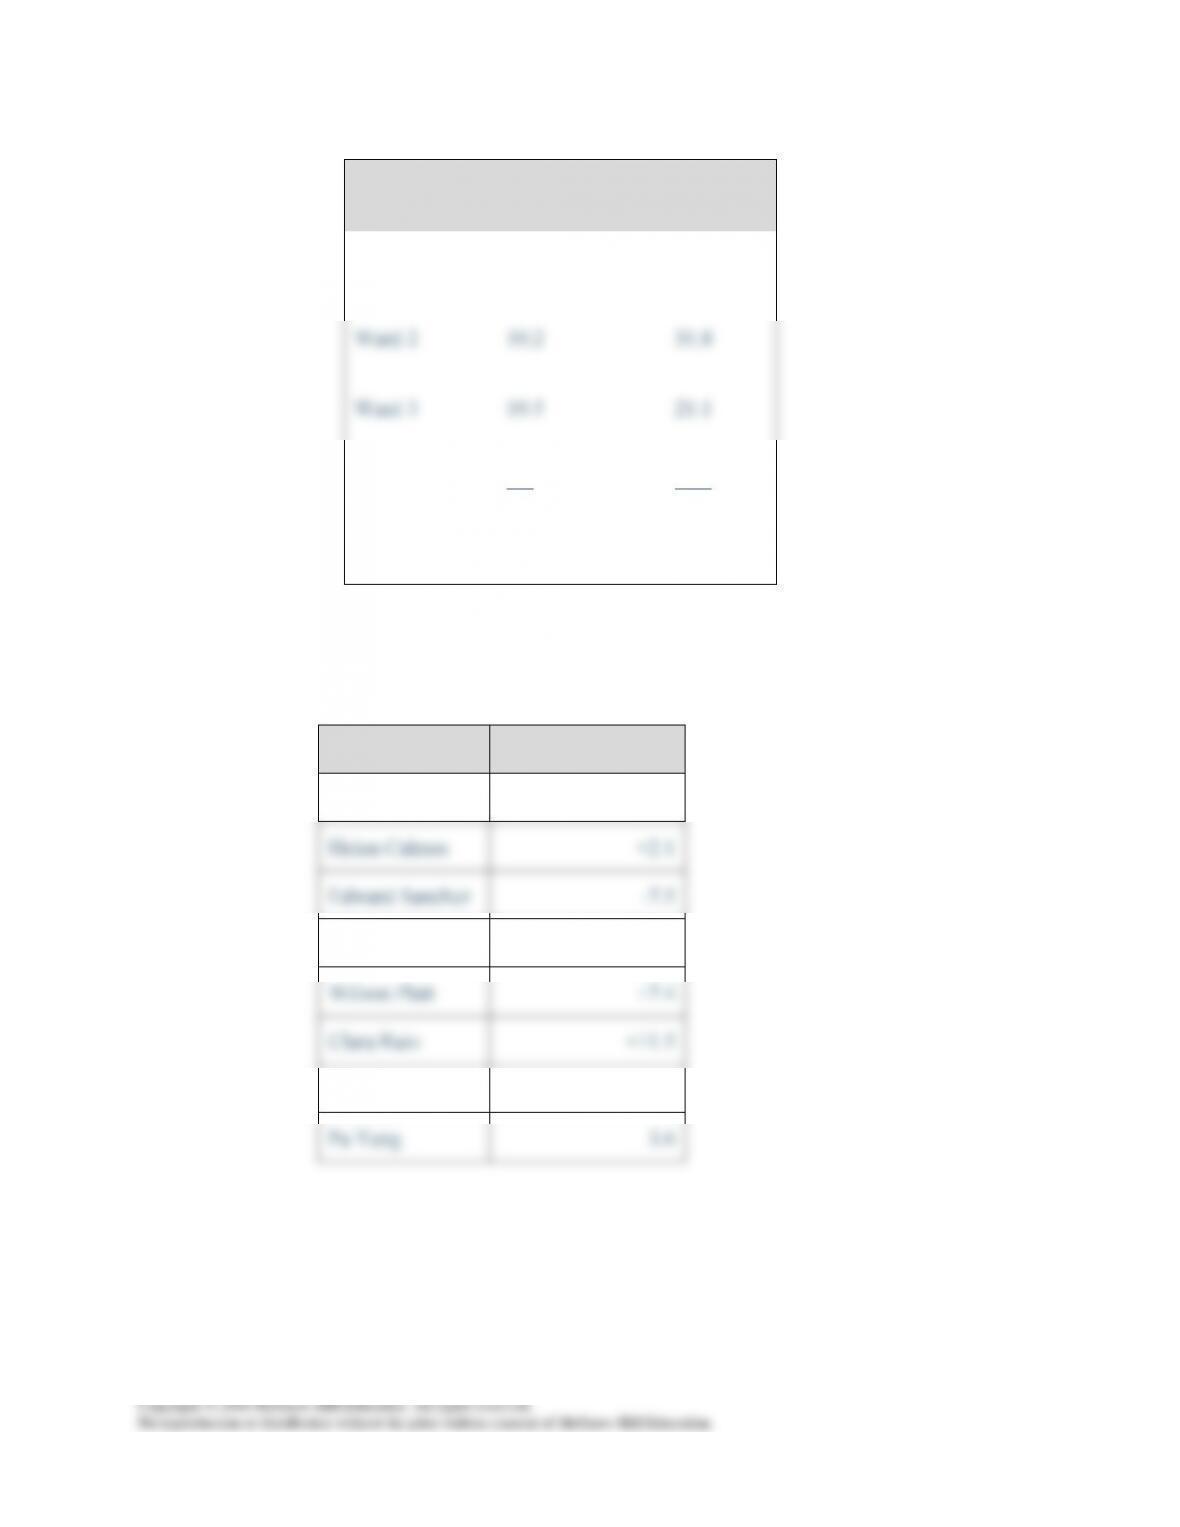
c. Share of real estate tax payments by ward for Bigg City, 2014 and 2018, in
thousands of dollars
4-20
Chapter 4: Communicating with Visuals
2014
2018
Ward 1
17.1
21.3
Ward 2
10.2
31.8
Ward 3
19.5
21.1
Ward 4
7.8
18.2
City total
54.6
92.4
A subdivided bar chart would work here. This chart shows the makeup and comparison
of totals, which is what is needed in this case.
d. Percentage change in sales by employee, 2018–2019, District IV, Abbott, Inc.
Employee
Percentage Change
Joan Abraham
+7.3
Helen Calmes
+2.1
Edward Sanchez
-7.5
Clifton Nevers
+41.6
Wilson Platt
+7.4
Clara Ruiz
+11.5
David Schlimmer
-4.8
Pa Yang
3.6
As both plus and minus percentages are involved, a bilateral bar chart is appropriate.
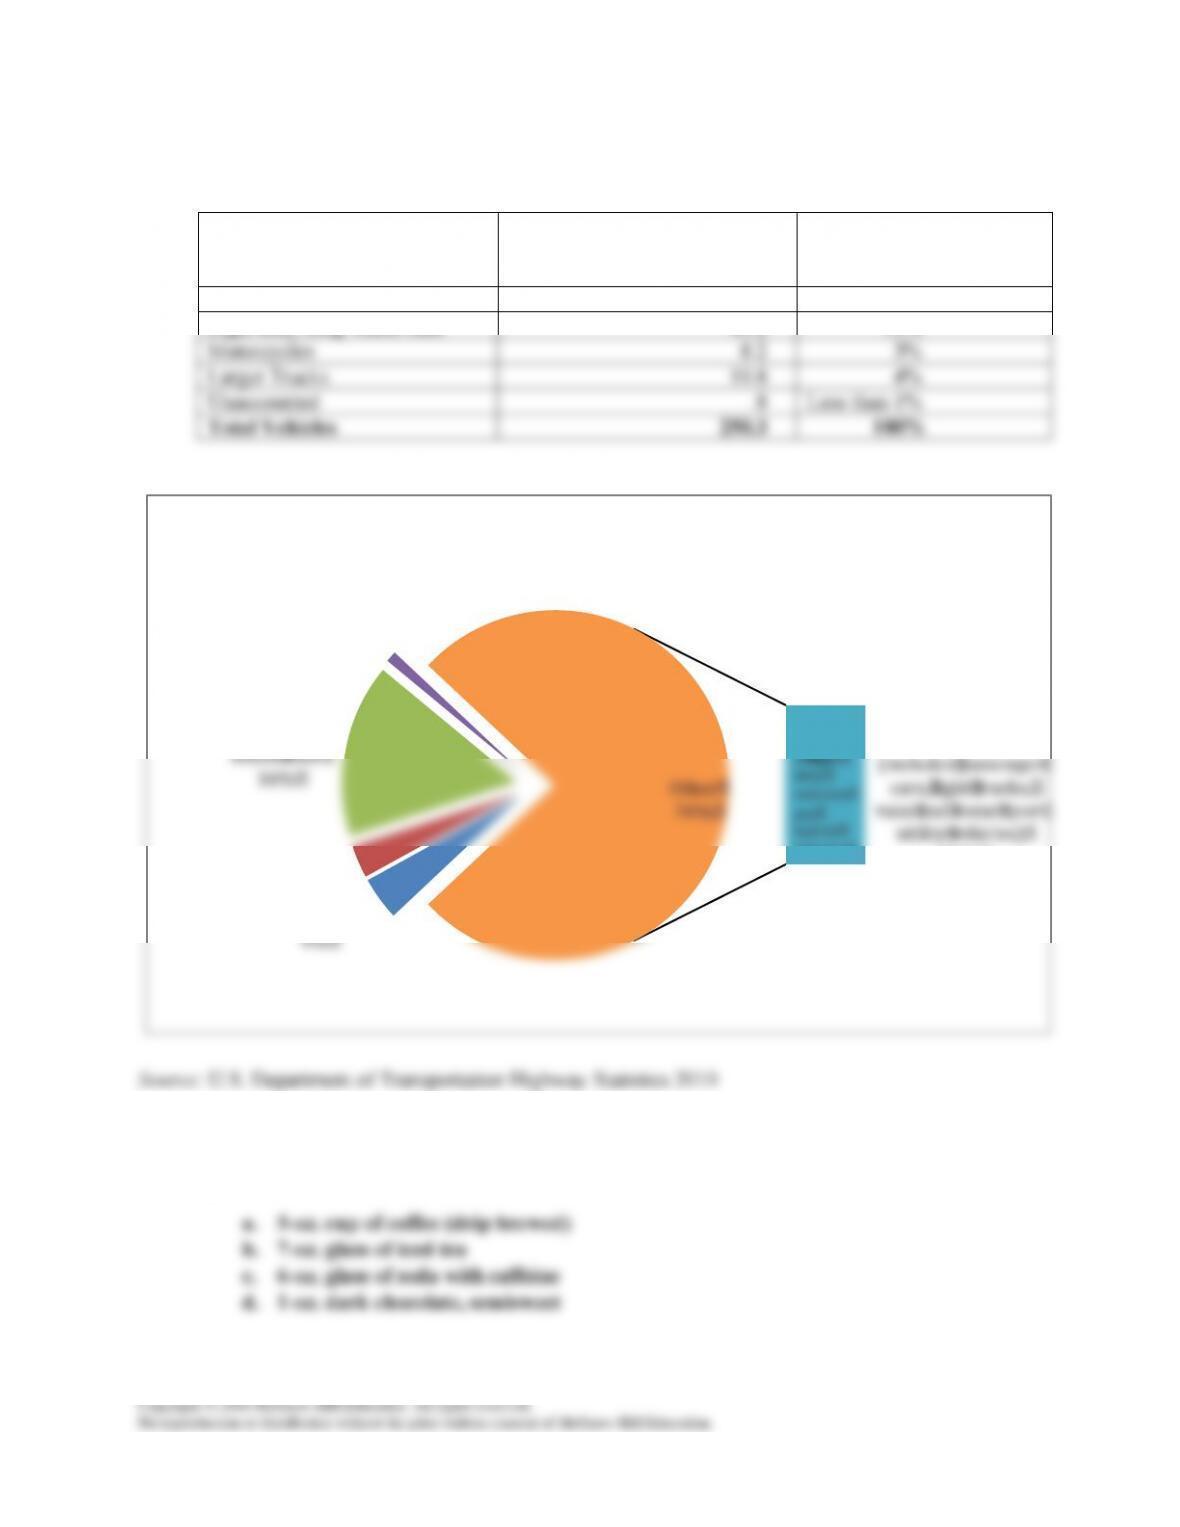
5. Determine what percentage of each type of registered vehicle is owned in the United States,
including hybrid vehicles as appropriate. Choose an appropriate visual type and create it to
convey the data. Consult the U.S. Department of Transportation for statistics. (LO1–5)
Visual: Pie Chart
4-21
Chapter 4: Communicating with Visuals
Data: U.S. Registered Passenger Vehicles
VEHICLE TYPES
AMOUNT
(rounded to nearest hundred
thousand)
PERCENTAGE
Light duty, short wheel base
190.2
76%
Light duty, long wheel base
40.2
16%
Motorcycles
8.2
3%
Larger Trucks
10.8
4%
Unaccounted
.8
Less than 1%
Total Vehicles
250.3
100%
LargerTrucks
4%
Motorcycles
3%
Lightduty,long
wheelbase
16%
Unaccounted
1%
Lightduty,short
wheelbase
(includespassenger
cars,lighttrucks,
vansandsomesport
utilityvehicles)
76%
Other
76%
U.S.RegisteredPassengerVehicles
Less
than1%
oflight
duty
vehicles
are
hybrid
vehicles
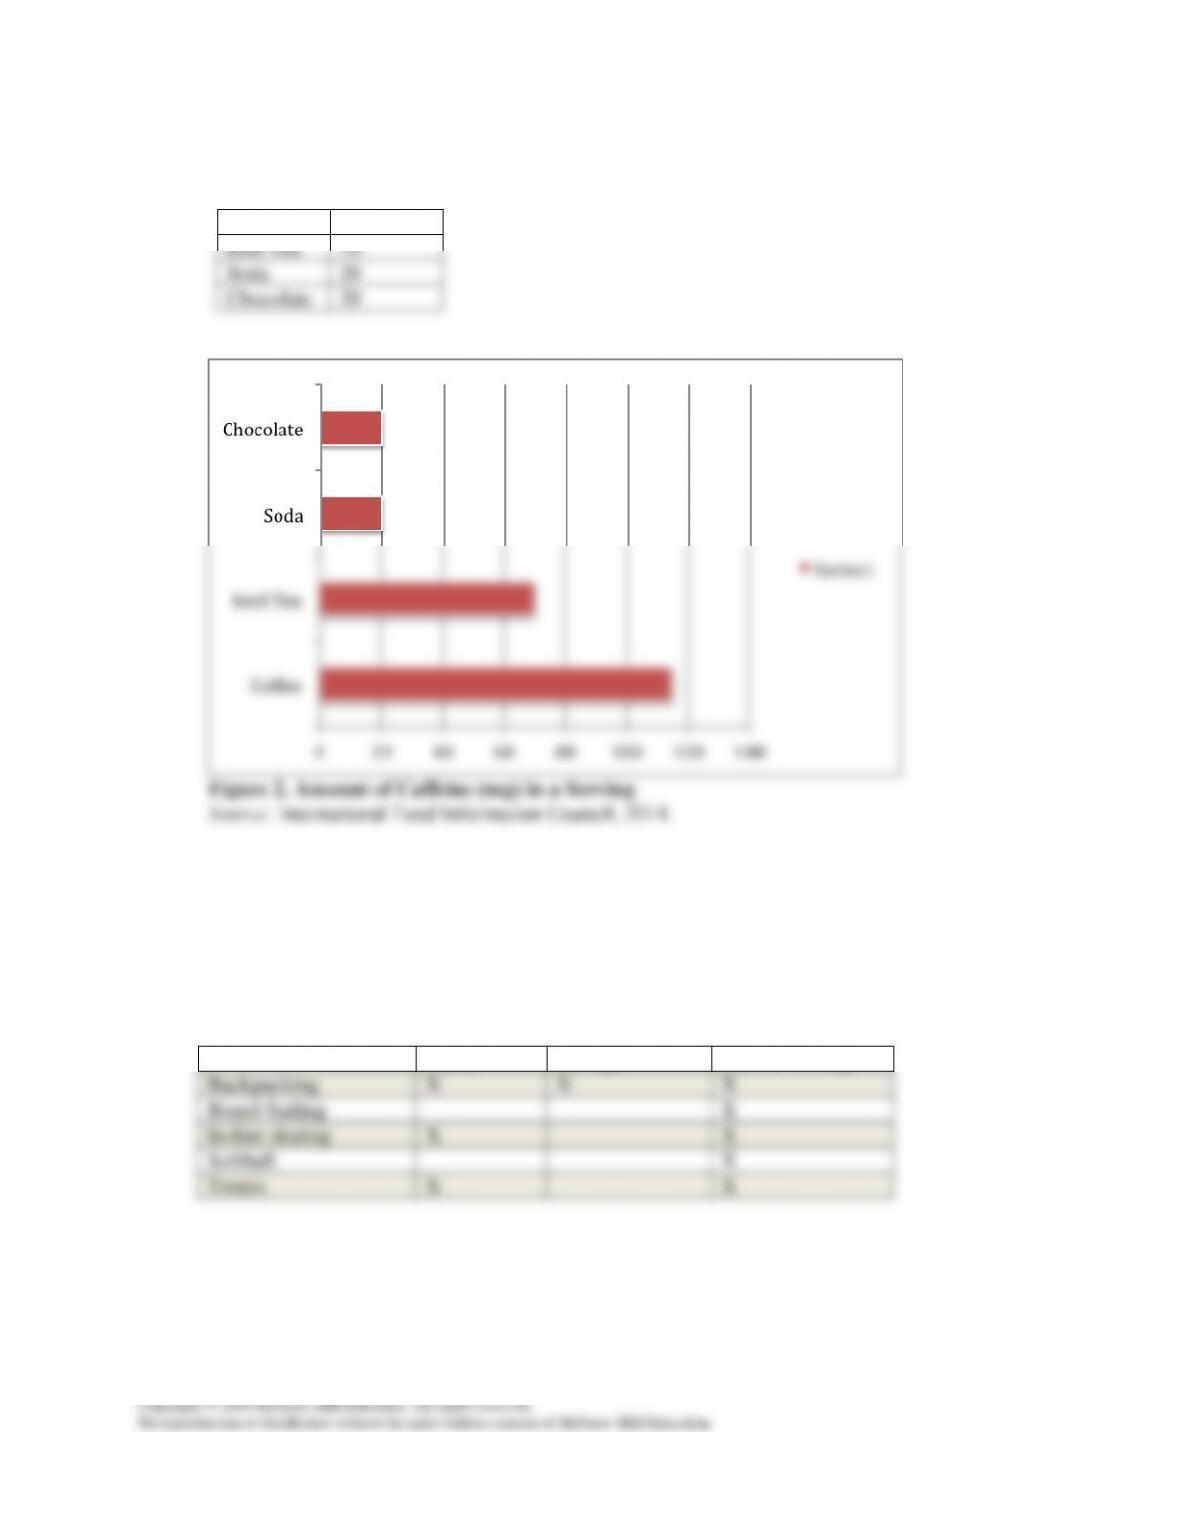
6. Through research, find the approximate milligrams of caffeine in the following items and
create an appropriate visual for Affiliated Food Products, Inc., to illustrate your findings.
(LO2–5)
Visual: Bar Chart
4-22
Chapter 4: Communicating with Visuals
Data:
Coffee
115 mg
Iced Tea
70
Soda
20
Chocolate
20
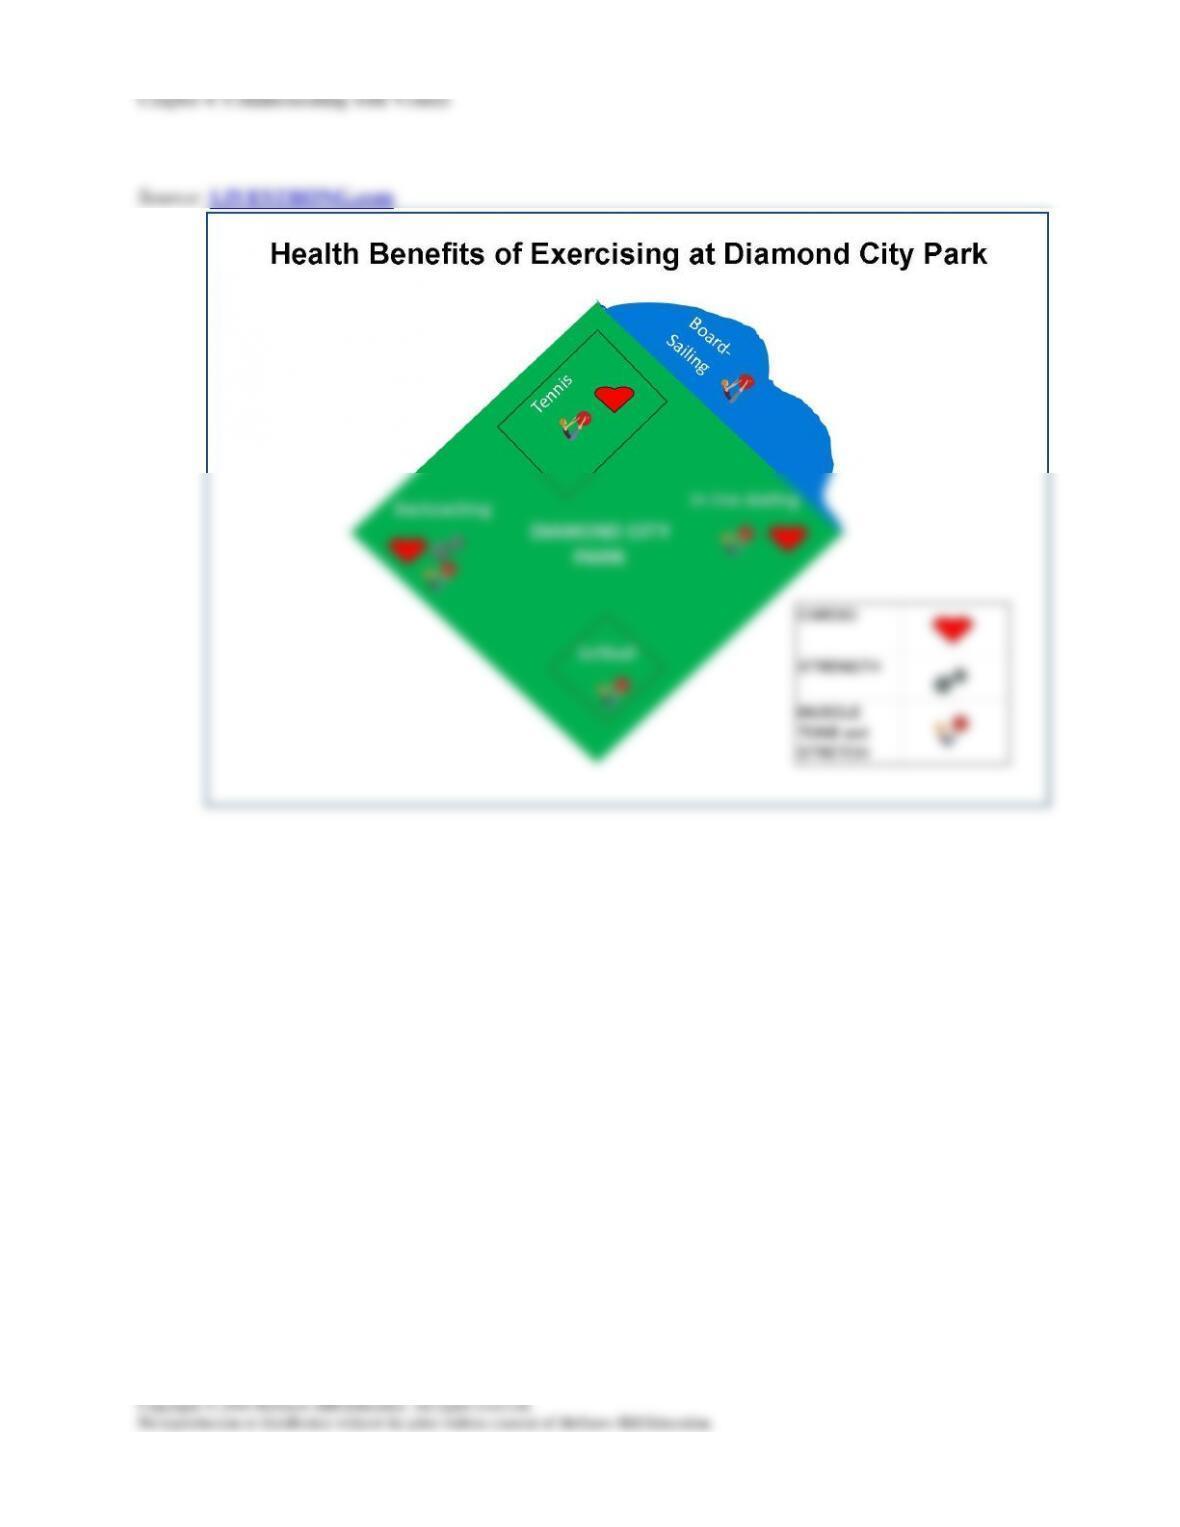
7. Choose five or six types of exercise. In a visual, identify the activity as a type of (1)
cardiovascular training, (2) strength training, or (3) muscle stretching and toning. You can
assume that some forms of exercise will incorporate all three types. You work for the Parks
and Recreation Department of a city of your choosing. Provide an interpretation of your
visual. (LO1–6)
Visual: Map
Data:
Cardio
Strength
Muscle Toning
Backpacking
X
X
X
Board-Sailing
X
In-line skating
X
X
Softball
X
Tennis
X
X
Figure 3
As Figure 3 shows, Diamond City Park provides plenty of opportunities for exercise, including
cardiovascular training, strength training, and muscle stretching and toning. In one day, you can
experience backpacking, softball, tennis, and even board-sailing.
4-23