Instructor Manual
Guffey/Loewy, Business Communication: Process & Product, 10e, 2022, 9780357129234;
Chapter 12: Informal Business Reports
Table of Contents
Purpose and Perspective of the Chapter …………………………………………………………………………. 2
Cengage Supplements …………………………………………………………………………………………………… 2
Chapter Objectives ………………………………………………………………………………………………………… 2
Complete List of Chapter Activities and Assessments ……………………………………………………… 3
Key Terms ……………………………………………………………………………………………………………………… 4
What’s New in This Chapter ……………………………………………………………………………………………. 5
Chapter Outline …………………………………………………………………………………………………………….. 6
Discussion Questions …………………………………………………………………………………………………… 15
Additional Activities and Assignments …………………………………………………………………………… 17
Purpose and Perspective of the Chapter
The purpose of this chapter is to learn about informal business reports and how to create
them. First, we cover how to interpret, tabulate, and analyze data. Next, we discuss how to
Cengage Supplements
The following product-level supplements provide additional information that may help you
in preparing your course. They are available in the Instructor Resource Center.
• Transition Guide (provides information about what’s new from edition to edition)
• Educator’s Guide (describes assets in the platform with a detailed breakdown of
activities by chapter with seat time)
Chapter Objectives
The following objectives are addressed in this chapter:
12-1 Analyze statistical data and other information using tables, measures of central
tendency (mean, median, and mode), and decision matrices.
Complete List of Chapter Activities and Assessments
For additional guidance, refer to the Teaching Online Guide.
Chapter
Objective
PPT
Slide
Activity/Assessment
Duration
Certification Standard
12-1
11
Knowledge Check in PPT
15 min
BUSPROG: Analytic
DISC: Theory application
12-3
24
Small Group Activity in PPT
45 min
BUSPROG: Analytic
DISC: Theory application
12-4
35
Writing Improvement
Activity in PPT
30 min
BUSPROG: Communication
DISC: Theory application
12-5
43
Writing Improvement
Activity in PPT
60 min
BUSPROG: Communication
DISC: Theory application
12-1–12-5
44
Grammar and Mechanics
Quiz in PPT
45 min
BUSPROG: Communication
N/A
N/A
Grammar and Mechanics
Pre-Course Diagnostic*
60 min
BUSPROG: Communication
DISC: Standard English
N/A
N/A
Grammar and Mechanics
Tutorials*
N/A
BUSPROG: Communication
N/A
N/A
Grammar and Mechanics
Check-Up Activities*
N/A
BUSPROG: Communication
DISC: Standard English
Chapters
11–14
N/A
Why Do Reports, Proposals,
and Presentations Matter to
Me? (Unit 04 Reports,
Proposals, and
Presentations)**
5 min
N/A
N/A
Learn It: Chapter 12
Informal Business Reports
min
N/A
12-1–12-5
N/A
Assignment: Chapter 12
Informal Business Reports
20 min
N/A
12-1–12-5
N/A
Video Presentation:
Informational Report:
Charting Your Career Path
(Chapter 12 Informal
Business Reports)
15 min
N/A
N/A
Practice Quiz: Chapter 12
Informal Business Reports
min
N/A
a Memo Report (Unit 04
Reports, Proposals, and
* These activities appear before the student will begin the course.
** This activity appears at the beginning of Unit 4.
[return to top]
Key Terms
Amazon effect: Competitive pressure weighing on any industry in which Amazon is
dominant.
Correlation: A relationship among two or more variables; does not necessarily mean a
cause-and-effect relationship.
Cross-tabulation: A process used to analyze two or more variables in a table together.
Decision matrix: A special grid that helps managers make the best choice among complex
options.
Mean: The arithmetic average of a group of figures.
Median: The midpoint in a group of figures arranged from lowest to highest, or vice versa.
Mode: The value that occurs most frequently in a group of figures.
[return to top]
What’s New in This Chapter
The following elements are improvements in this chapter from the previous edition:
• Presented an opening scenario featuring Netflix that discusses data analysis and
illustrates the main chapter theme to shed a light on viewer statistics of a streaming
service with which students are very familiar.
• Wrote all new critical-thinking questions to stimulate the students’ curiosity and
become critical readers.
[return to top]
Chapter Outline
In the outline below, each element includes references (in parentheses) to related content.
“CH.##” refers to the chapter objective; “PPT Slide #” refers to the slide number in the
Introduce the chapter and review learning objectives for Chapter 12. (PPT Slide 2).
I. Interpreting Digital Age Data (12-1, PPT Slides 3–11, DISC: Math and algebra
accuracy; Numbers in visual display; Translation)
a. Collecting information is easier than ever.
d. Information helps businesses make strategic decisions and adapt to trends.
e. Tables, statistical concepts (mean, median, and mode), correlations, grids,
and decision matrices can all help you summarize large amounts of data.
f. Follow these tips when using tables (Figure 12.1):
i. Use systematic columns and rows to summarize and simplify data.
g. The three Ms—mean, median, and mode—describe data.
i. The average is generally used to indicate the mean, or arithmetic
average.
h. Relationships between two or more variables that help explain the findings
are called correlations.
i. Avoid suggesting that a cause-and-effect relationship exists unless
one can be proved; only sophisticated research methods can
statistically prove correlations.
i. Raw data—especially verbal data—are often arranged into a grid, which
summarizes responses. (Figure 12.2)
j. A decision matrix is a special grid that helps managers make the best choice
among complex options. (Figure 12.3)
k. Knowledge Check Activity: 15 minutes total. Activity 12.2—Making Sense of
the Three Ms
Have students complete the activity found at the end of the chapter.
• Arrange the homes by ascending price as follows:
$360,000; $360,000; $360,000; $360,000; $380,000; $380,000;
$420,000; $460,000; $520,000
• Median = $380,000.
The median is the middle value in a list—here the fifth in order. Home
prices are typically indicated as a median value for a reason. It is the
midpoint between the lowest and highest prices.
II. Drawing Conclusions and Making Recommendations (12-2, PPT Slides 12–17,
DISC: Conclusion)
a. Conclusions and recommendations are the most widely read sections of a
report.
c. When analyzing data to arrive at conclusions, follow these guidelines
(Model Document 12.1):
i. Ensure the audience knows how the data relate to the problem.
ii. Make report conclusions more objective by using consistent
d. Recommendations evolve from the interpretation of findings and
conclusions.
e. Follow these tips when preparing report recommendations:
i. Separate conclusions from recommendations—conclusions explain
what the problem is, while recommendations tell how to solve it.
f. Figure 12.4 illustrates the differences between findings, conclusions, and
recommendations.
g. Pair Activity: 30 minutes total. Activity 12.5—Which Car to Buy? Taking a
Decision Matrix for a Spin
Break students into pairs and have them complete the activity found at the
end of the chapter. This assignment lends itself to additional options.
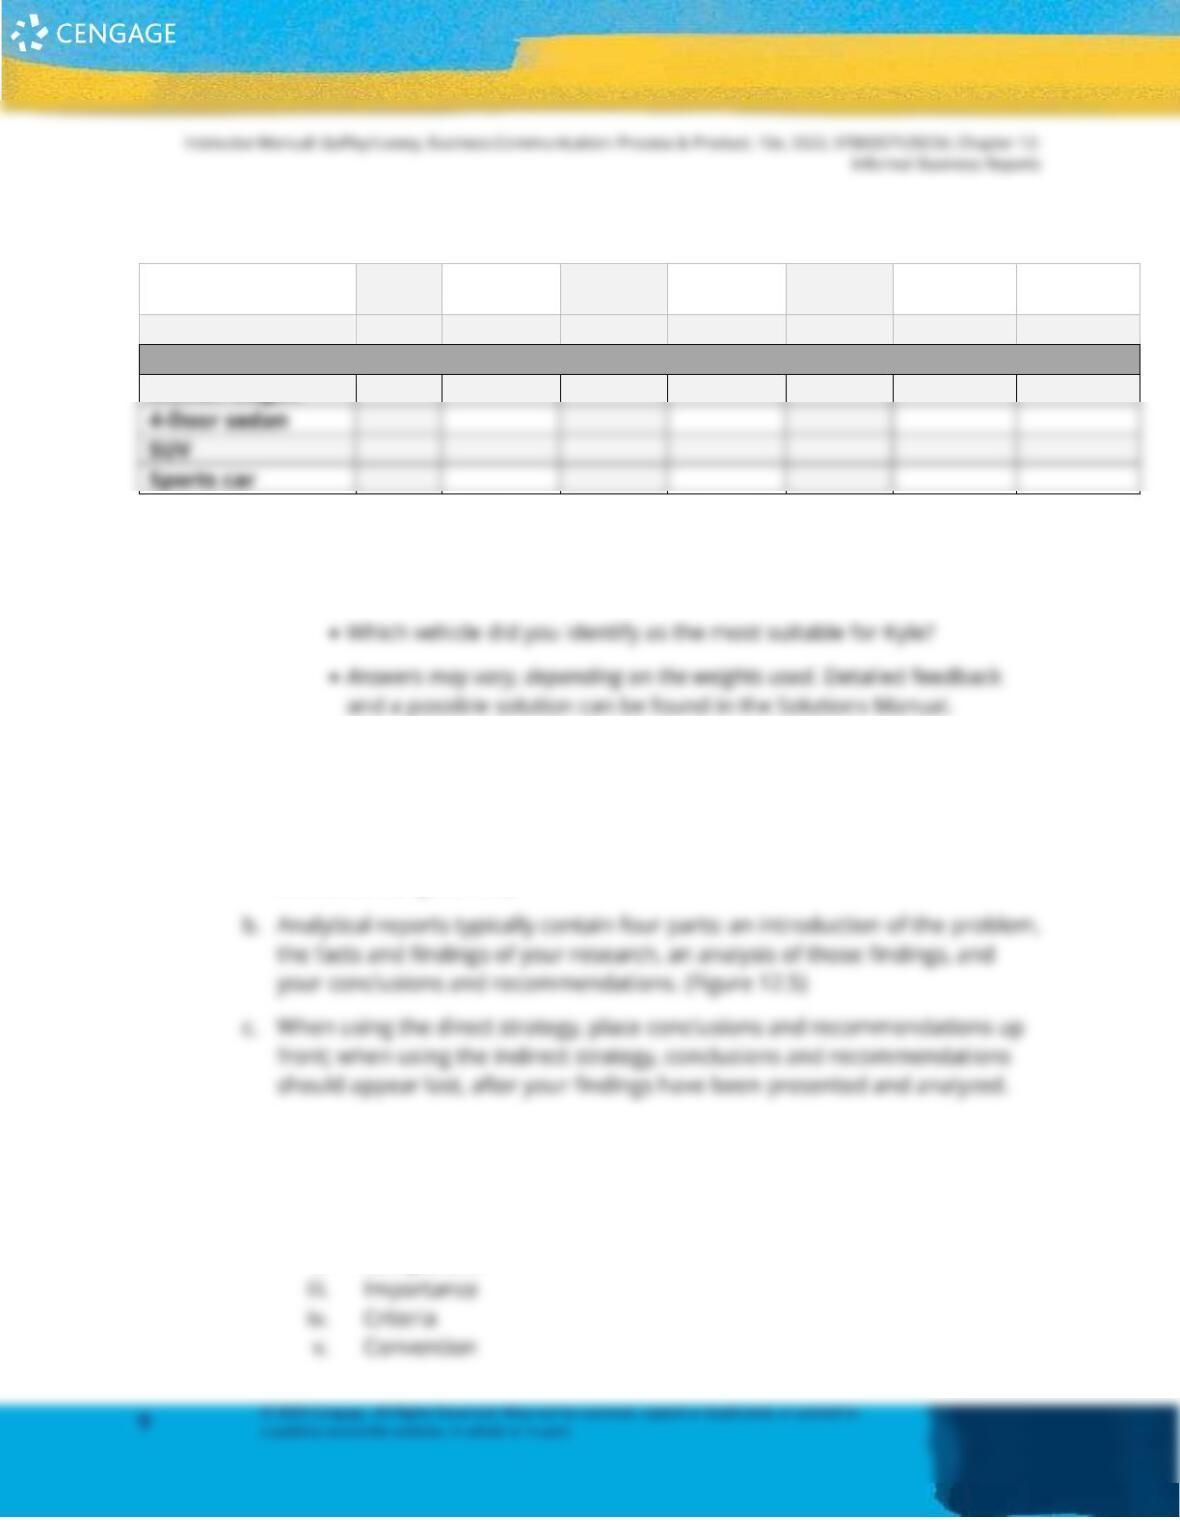
binoculars, DSLR cameras, kitchen appliances, or any other big-ticket item
one doesn’t purchase on a whim.
Features
Price
Cargo
Fuel
Comfort
Look
Quality
Total
Weights
Car Choices
Station wagon
4-Door sedan
SUV
Sports car
• What score did you assign to each feature?
• Which weights did you determine are probably most important to
Kyle, given his needs?
III. Organizing Data (12-3, PPT Slides 18–25, DISC: Patterns; Audience; Numbers in
visual display; Translation)
a. Informational reports typically consist of three parts: an introduction with
background information, the facts and findings of your research, and a
conclusion. (Figure 12.5)
d. Reader comprehension, not writer convenience, should govern organization.
e. Five common organizational methods can help the reader understand the
data (Figure 12.6):
i. Time
ii. Component
g. Introduction:
i. Tells the purpose of the report
ii. Describes the significance of the topic
h. Transitions:
i. Tell readers where ideas are headed and how they relate
i. Headings (Model Document 12.2):
i. Use appropriate heading levels.
ii. Capitalize and emphasize carefully.
j. Headings may be functional, talking, or a combination. (Figure 12.7 and
Model Document 12.2)
i. Functional headings reveal the outline of the report but provide little
insight. These are often used for routine reports.
k. Small Group Activity: 45 minutes total. Activity 12.6—Organizing Report
Data
Break class into groups of three to five students and have them complete the
activity found at the end of the chapter.
Informal Business Reports
• How would you organize the findings in each report?
a. Time. Like itineraries and agendas, instructions require
attention to chronology.
d. Time. A process that’s evolving in stages suggests chronological
order.
e. Convention. Employee performance appraisals are highly
standardized and occur at regular intervals.
• How did you make your determinations?
IV. Writing Short Informational Reports (12-4, PPT Slides 26–35, DISC: Patterns;
Rhetorical considerations; Word processing; Theory application)
a. Informational reports have the following characteristics:
i. Usually describe periodic, recurring activities (such as monthly sales)
or situational, nonrecurring events (such as a conference)
b. For effective document design, follow these tips: