CHAPTER 8 PHOTOSYNTHESIS
Scientific Skills Exercise
Teaching objective: The primary objective of this exercise is to give students practice in
working with scatter plots and regression lines. Students are asked to describe trends shown by
the regression lines, to use the regression lines to estimate values, and to calculate the percentage
Teaching tips: In plotting data in the scatter plot, students may wish to connect the data points.
However, because the objective is to determine trends rather than to see the rate of change
line, and then may want to check it by using Excel. They can input data into cells using the tools
within Excel to plot the data and insert regression lines into their scatter plot. Tutorials for
graphing in Excel can be found online. This exercise has been simplified in order to teach about
regression lines. In actuality, a scientist would draw a regression line for a set of raw data points,
rather than points representing averaged data.
Answers:
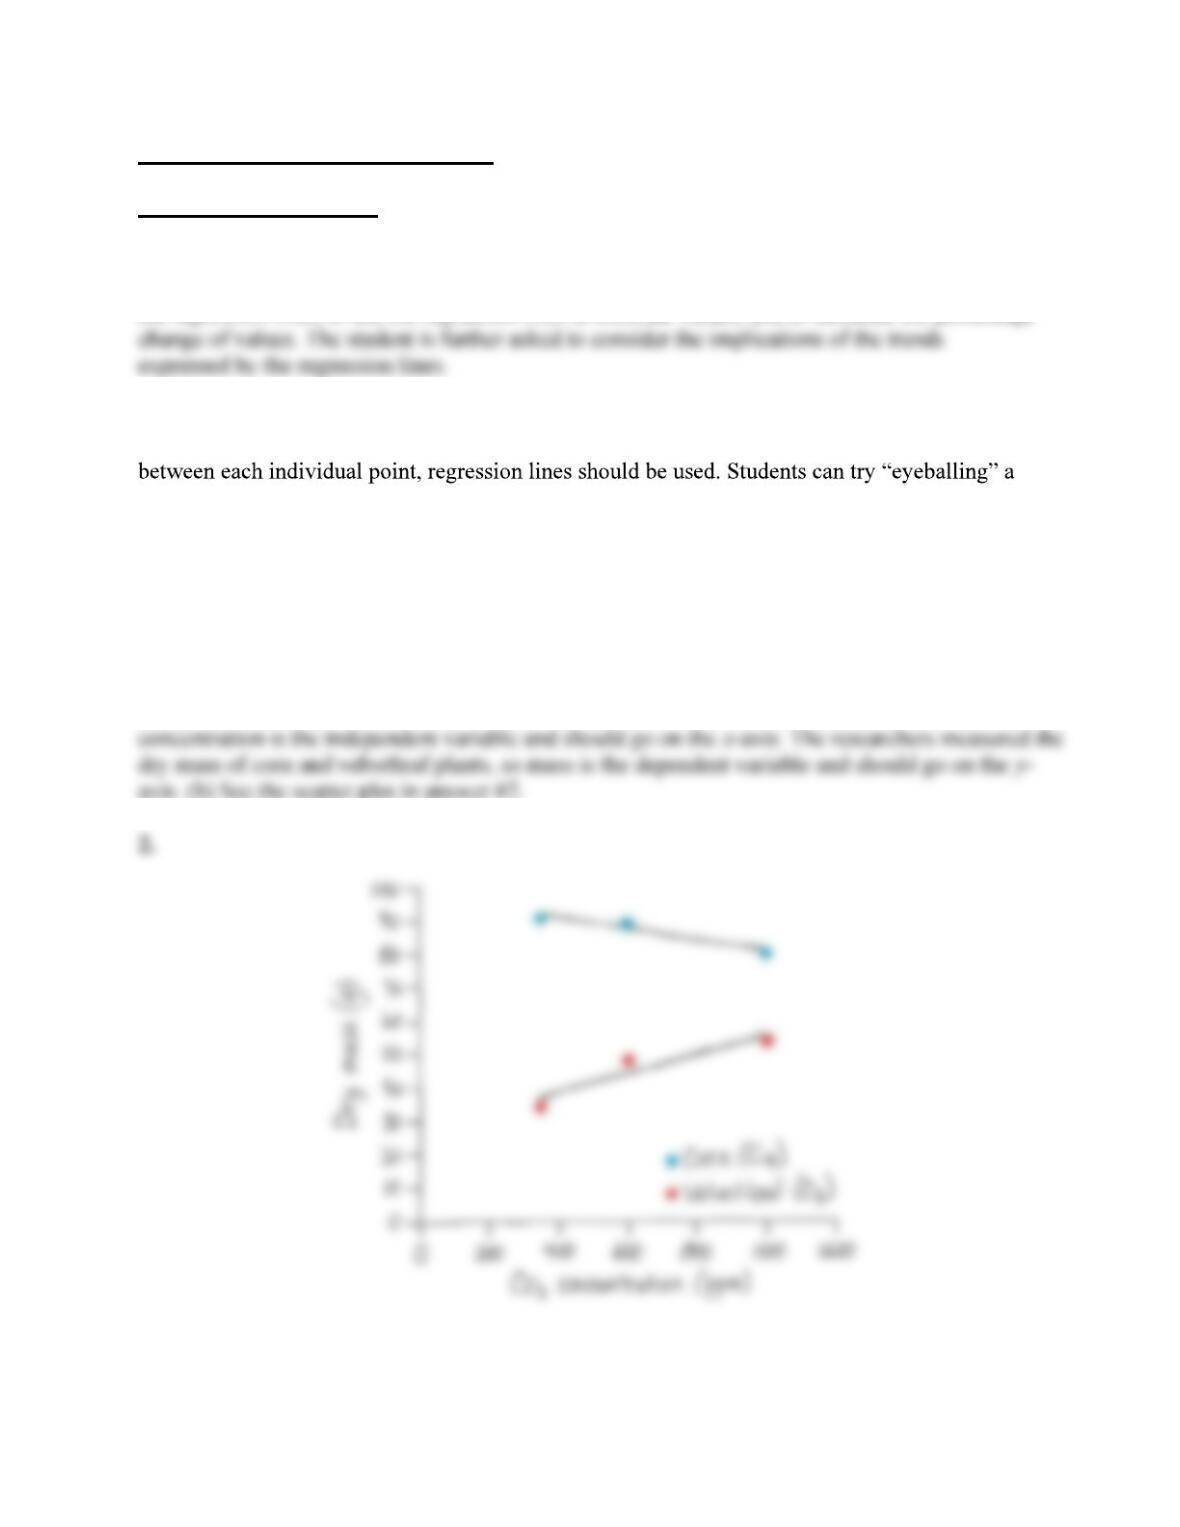
1. (a) The researchers intentionally varied the levels of CO2 concentration. Therefore, CO2

3. (a) As shown by the regression lines in the scatter plot, the dry mass of corn decreased with
Interpret the Data
Figure 8.9 About 400 450 nm and 670 680 nm drive the highest rates of photosynthesis. (The first
peak of the graph in (b) is quite broad.)
Suggested Answers for End-of-Chapter Essay Questions
See the general information on grading short-answer essays and a suggested rubric at the
beginning of this document.
9. Science, Technology, and Society
Trees in tropical rain forests carry out photosynthesis, fixing CO2 as sugar and storing carbon as
they synthesize new biomass. However, trees also respire, using sugar as an energy source and
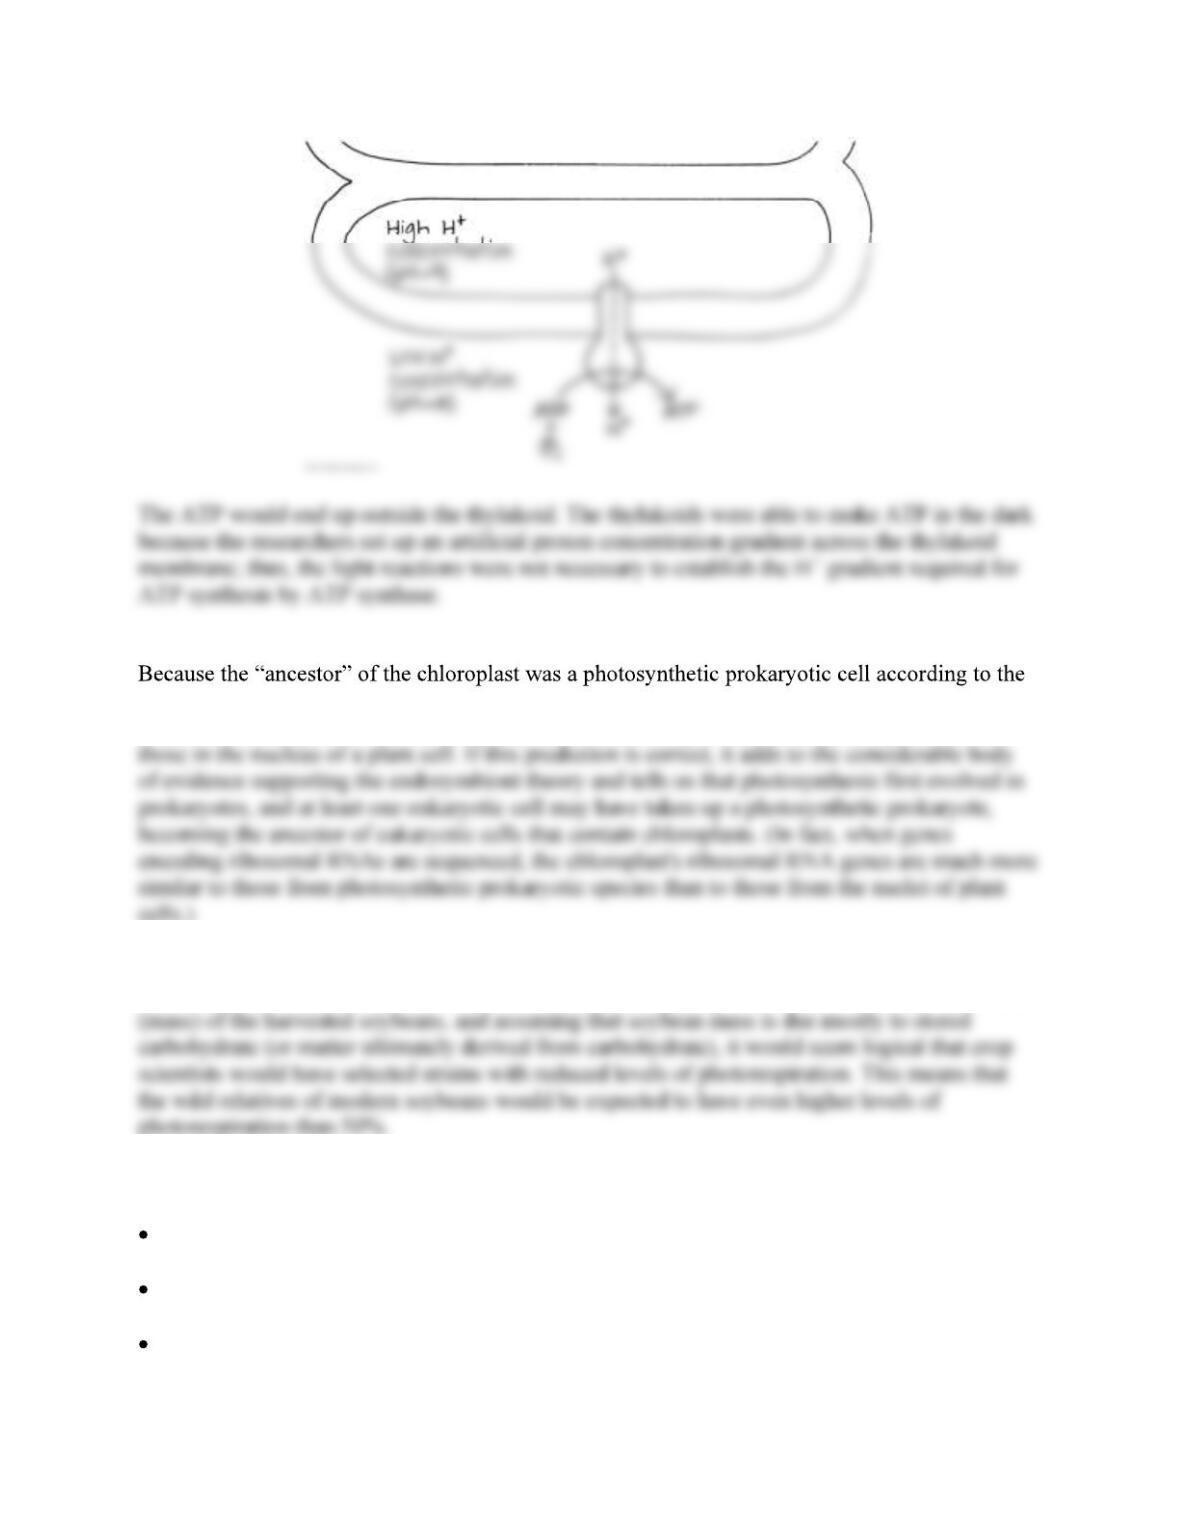
10. Draw It
11. Focus on Evolution
endosymbiont theory, you would predict that the sequences of chloroplast DNA for ribosomal
RNAs in a chloroplast would be more similar to those of a photosynthetic prokaryote than to
12. Focus on Evolution
Assuming that modern soybeans are the result of breeding programs meant to maximize the size
13. Focus on Energy and Matter
Sample key points:
The light reactions take place in the thylakoids, where photosystems and electron transport
chains are embedded in membranes that enclose the thylakoid space.
The energy of light is used to pump electrons from water through photosystem II, an electron
transport chain, and photosystem I to NADPH.
In redox reactions in the electron transport chain, protons are pumped into the thylakoid
space. ATP synthase uses this proton-motive force to make ATP.

Sample top-scoring answer:
The energy transformations of photosynthesis take place in chloroplasts. The light reactions
occur in the thylakoids, where photosystems containing light-harvesting complexes of pigment
molecules, a reaction-center chlorophyll a, and a primary electron acceptor are embedded. When
14. Synthesize Your Knowledge
This green alga is photosynthetic, so it must have chlorophyll, which appears green. However, in
addition to chlorophyll, it must have accessory pigments that absorb a different wavelength,
including one at high levels that appears reddish pink in visible light. Given that UV light levels