CHAPTER 7 CELLULAR RESPIRATION AND FERMENTATION
Scientific Skills Exercise
Teaching objective: Students will practice making a bar graph with categorical data in this
exercise. The students are then encouraged to think of a biological explanation for the data
pattern.
Teaching tips: A version of this Scientific Skills Exercise can be assigned in MasteringBiology.
When faced with data that fall into categories instead of along a continuum, many students will
students make the graph several times, changing the order that the categories align on the x-axis,
will demonstrate that the pattern will change if points are connected but not if left separate. Some
astute students may argue that in this example, the cells with low, normal, and elevated thyroid
hormone levels represent a continuum of thyroid hormone levels and can be treated as
continuous data. In this case, challenge them to assign numerical values to the hormone levels
and they will see that in the absence of actual hormone data, the cell types must be treated as
non-continuous categories. However, it is logical to put the categories in order from low to high
hormone levels.
Answers:
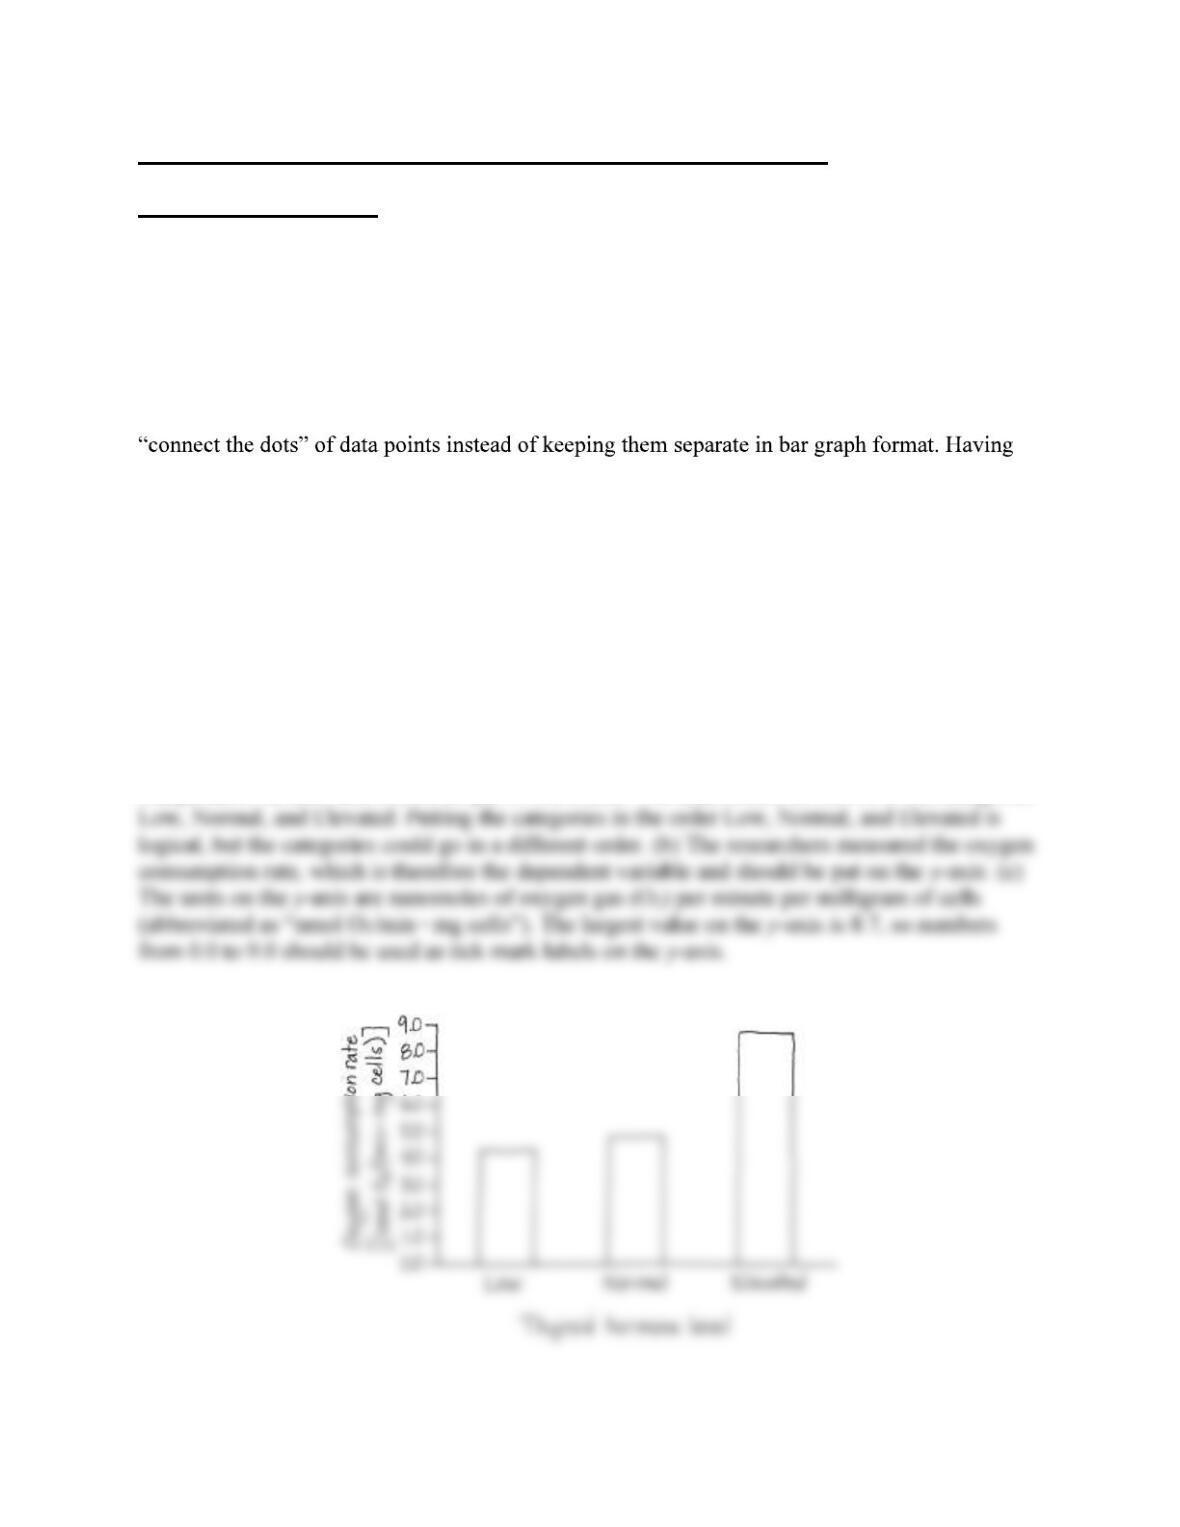
1. (a) The researchers intentionally varied the thyroid hormone level, which is therefore the
independent variable and should be put on the x-axis. The data should be shown in the categories
2.
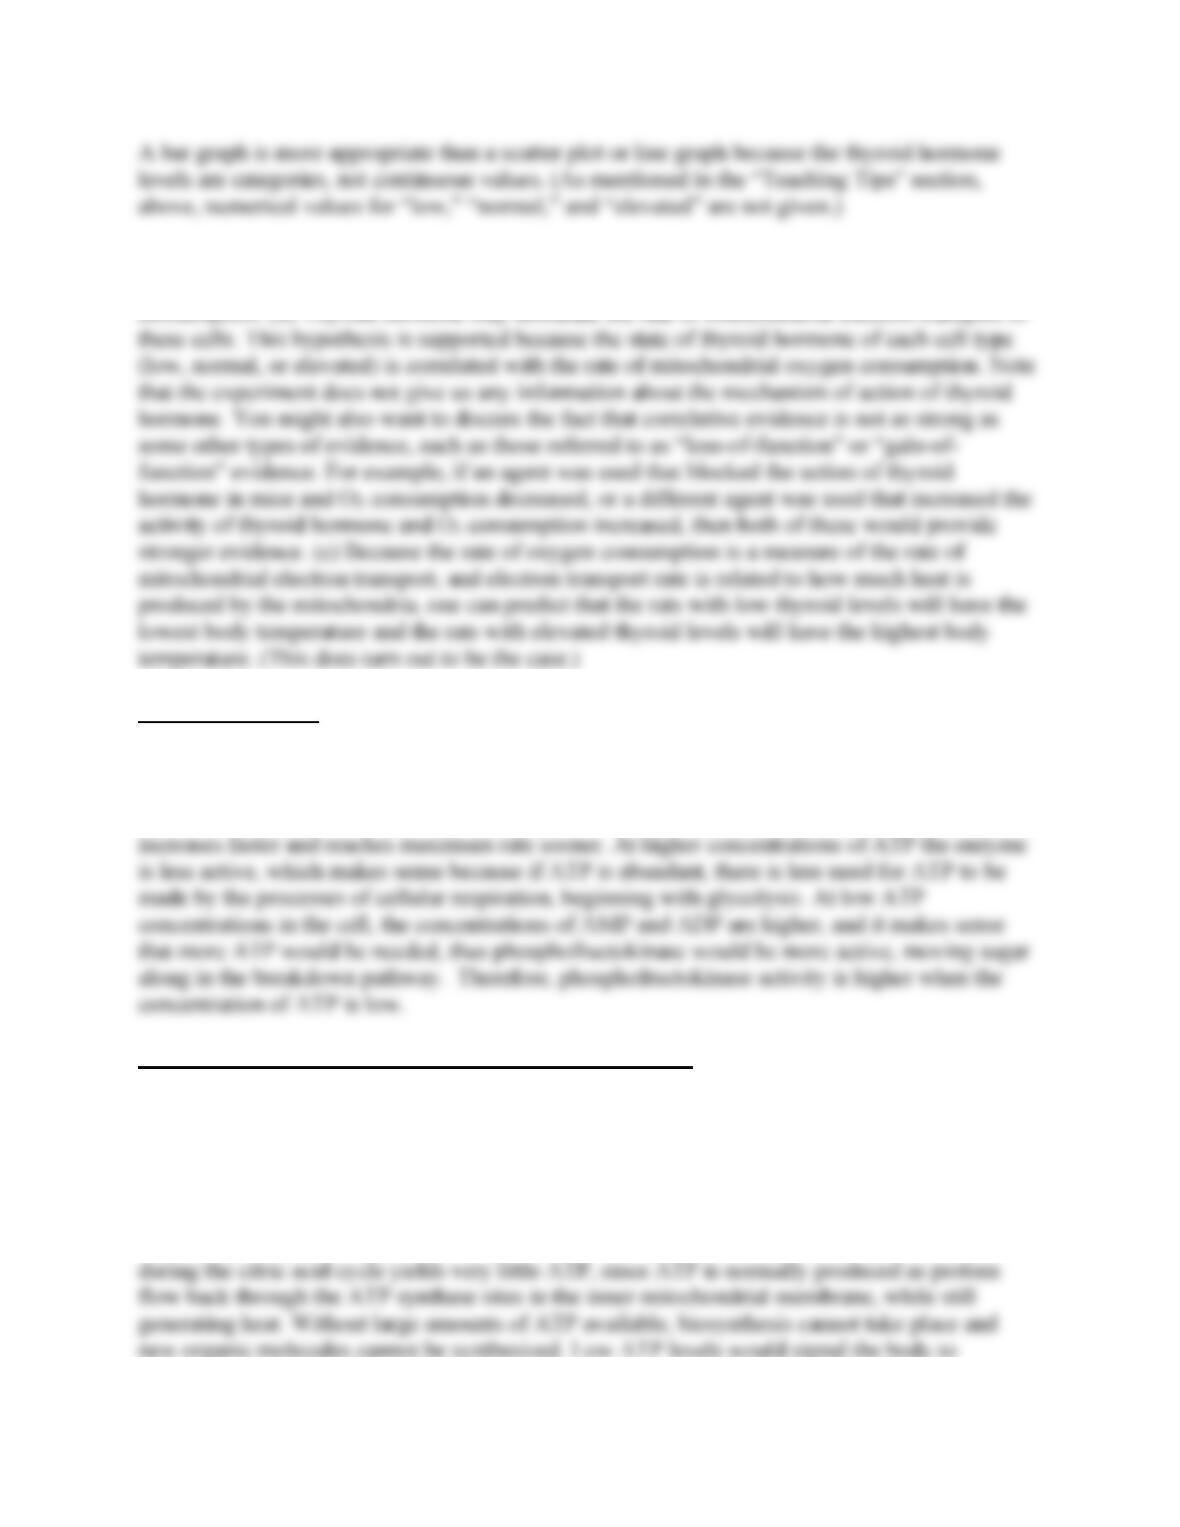
3. (a) The cells with elevated thyroid hormone levels had the highest rate of oxygen
consumption, and the cells with low thyroid hormone levels had the lowest rate of oxygen
Interpret the Data
9. Under both conditions, the phosphofructokinase enzyme increases in activity as the
concentration of the substrate increases, up until a point at which the rate remains the same.
Under conditions of low ATP concentration, however, phosphofructokinase enzyme activity
Suggested Answers for End-of-Chapter Essay Questions
See the general information on grading short-answer essays and a suggested rubric at the
beginning of this document.
10. Scientific Inquiry
In a person treated with uncoupling agents like DNP, the proton gradient established during
respiratory electron transport is no longer tied to ATP synthesis. As a result, oxidation of glucose
11. Focus on Evolution
(a) The presence of ATP synthases in all of these places suggests the likelihood of common
ancestry. As described in Chapter 4, the endosymbiont theory says that mitochondria evolved
12. Focus on Organization
Sample key points:
An electron transport chain consists of complexes of membrane proteins that transfer
electrons from carrier to carrier in a series of redox reactions.
Redox reactions release energy as electrons move to lower energy levels, while the protein
complexes shuttle protons across the membrane.
Sample top-scoring answer:
Novel properties emerge from the arrangement and interaction of parts at each level of the
biological hierarchy. An electron transport chain consists of a sequence of electron carrier
13. Synthesize Your Knowledge
transport chain in mitochondria, involved in shuttling electrons during oxidative
phosphorylation. This process occurs at the end of cellular respiration and helps produce ATPs