CHAPTER 6 AN INTRODUCTION TO METABOLISM
Scientific Skills Exercise
Note: In this do i
P as done in the text.
Teaching objective: Students will practice making a line graph in this exercise. The students are
then encouraged to think of a biological explanation for the data pattern.
Teaching tips: A version of this Scientific Skills Exercise can be assigned in MasteringBiology.
Some students may have a difficult time understanding why the concentration of (P)i goes up
over time. A common misconception is that the y-values represent the enzyme activity itself,
such that the steep rise near the start of the line shows that the enzyme is becoming activated and
then it stays at a constant high level after the plateau. An analogy of snowfall rate versus snow
accumulation may help them visualize what is going on in the buffer: The cells producing (P)i
Answers:
1. (a) By taking samples every 5 minutes, the researchers intentionally varied the amount of time
elapsed since the addition of substrate. Thus, time is the independent variable and should be on
3.
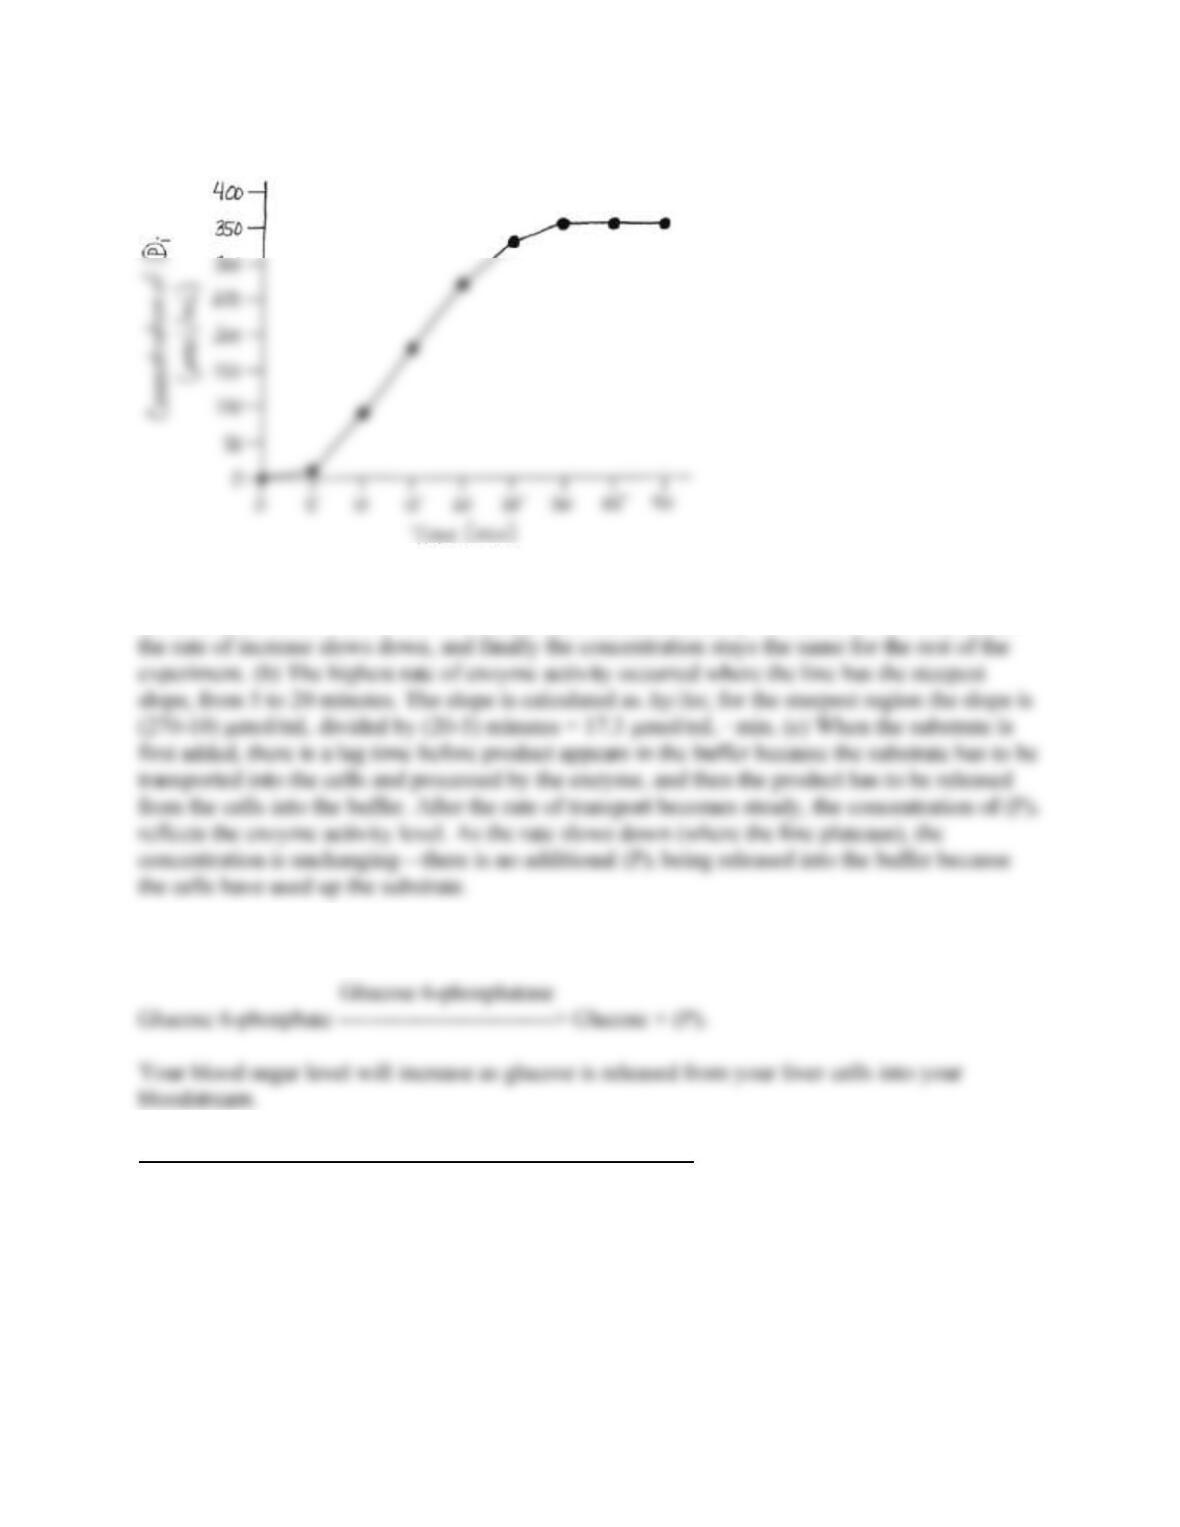
4. (a) The concentration of (P)i does increase over time, but not in a linear pattern. The
concentration is low for the first 5 minutes, then increases steadily for the next 15 minutes, then
5. If your blood sugar level is low, this reaction will occur in your liver cells:
Suggested Answers for End-of-Chapter Essay Questions
See the general information on grading short-answer essays and a suggested rubric at the
beginning of this document.
8. Scientific Inquiry
9. Science, Technology, and Society
This answer depends on your personal viewpoint. Some might argue that improving crop yields
10. Focus on Evolution
For a given metabolic pathway, its current function is accomplished by a complex series of
reactions catalyzed by a specific set of enzymes. However, earlier versions of the pathway may
have existed that accomplished the same or different functions. Organisms with cellular enzymes
11. Focus on Energy and Matter
Sample key points:
Energy enters an animal cell in the form of the chemical potential energy of fuel molecules
such as glucose.
Energy enters a plant cell in the form of light, which is converted to the chemical energy of
sugars.
The transfer and transformation of energy increase entropy, and a cell returns heat and the
low-energy molecules of CO2 and H2O to its surroundings.
Sample top-scoring answer:
The work of a cell requires energy. Energy enters an animal cell as the chemical energy of fuel
molecules such as glucose. In a photosynthesizing cell, light energy drives the synthesis of
sugars, which in turn provide the energy for metabolism. The free energy released by the
11. Synthesize Your Knowledge
On top of the glacier the penguins have potential energy, which is transformed into kinetic
energy as they slide down the slope and dive into the water. Climbing back up the glacier and
gaining potential energy requires the activity of muscles. To power the muscle function that