Notes to Instructors
Chapter 53 Population Ecology
What is the focus of these activities?
To study ecology, we often use mathematical models and statistical analysis to estimate
What are the particular activities designed to do?
Activity 53.1 What methods can you use to determine population density and
distribution?
The questions used in this activity are designed to help students review and understand
Activity 53.2 What models can you use to calculate how quickly a population
can grow?
The questions are designed to help students review and understand how various
Answers
Activity 53.1 What methods can you use to determine
population density and distribution?
1. To measure the population density of chipmunks occupying a particular park, you
sample several quadrats and capture 50 chipmunks. You mark each of them with a
small dot of red paint on their backs, and then release them. The next day, another 50
chipmunks are captured. Among the 50, you find 10 that are marked.
a. Using the mark–recapture formula below, how many chipmunks do you estimate
the population contains?
348 Notes to Instructors
b. What effect would each of the following discoveries have on your estimate?
i. You later discover that you sampled the one area of the park that was most
favored by the chipmunks.
If the area was favored by the chipmunks, you most likely captured more
ii. You later discover that the chipmunks were licking the mark off of each
others’ backs.
Some of the recaptured chipmunks that were counted as unmarked could
iii. You later discover that the marked chipmunks are easier to see and therefore
more susceptible to predation.
If more marked chipmunks are captured by predators, you will recapture
c. How could you modify your sampling program to ensure that you make more
accurate estimates of population size?
At a minimum, you should:
Activity 53.1 349
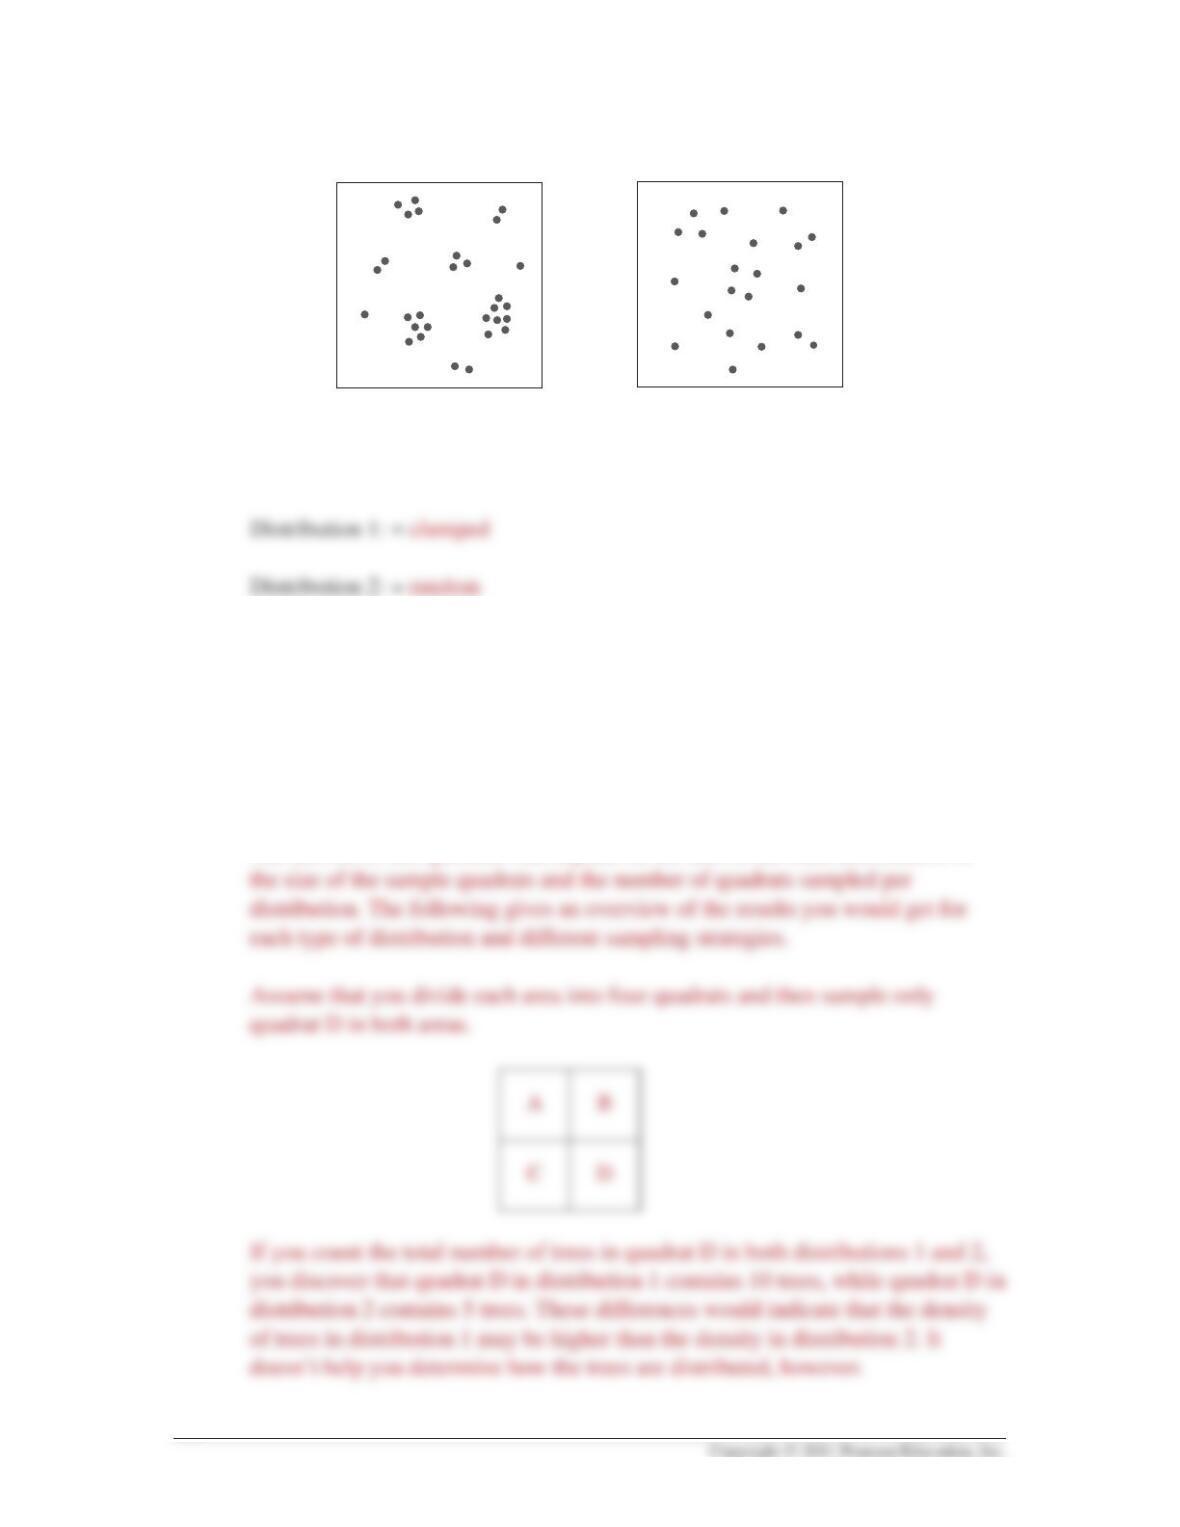
2. Refer to the two proposals for the distribution of a tree species below.
350 Activity 53.1
Proposed distribution 1 Proposed distribution 2
a. What type of distribution is represented in each of the proposals?
b. Given these two possible distributions, what factors do you need to consider in
setting up a sampling plan for the area? Propose sampling strategies and the
results you would get if organisms were distributed as in 1 vs. 2 above. For each
sampling strategy proposed, indicate how you will know if you have chosen both
an appropriate quadrat size and number of quadrates to provide you a good
representation of both the size of the population and the actual distribution of
organisms within the sampling area.
The answer to this question will depend on the size of the total area relative to
Now, assume that you divide each area into 16 quadrats.
Activity 53.1 351
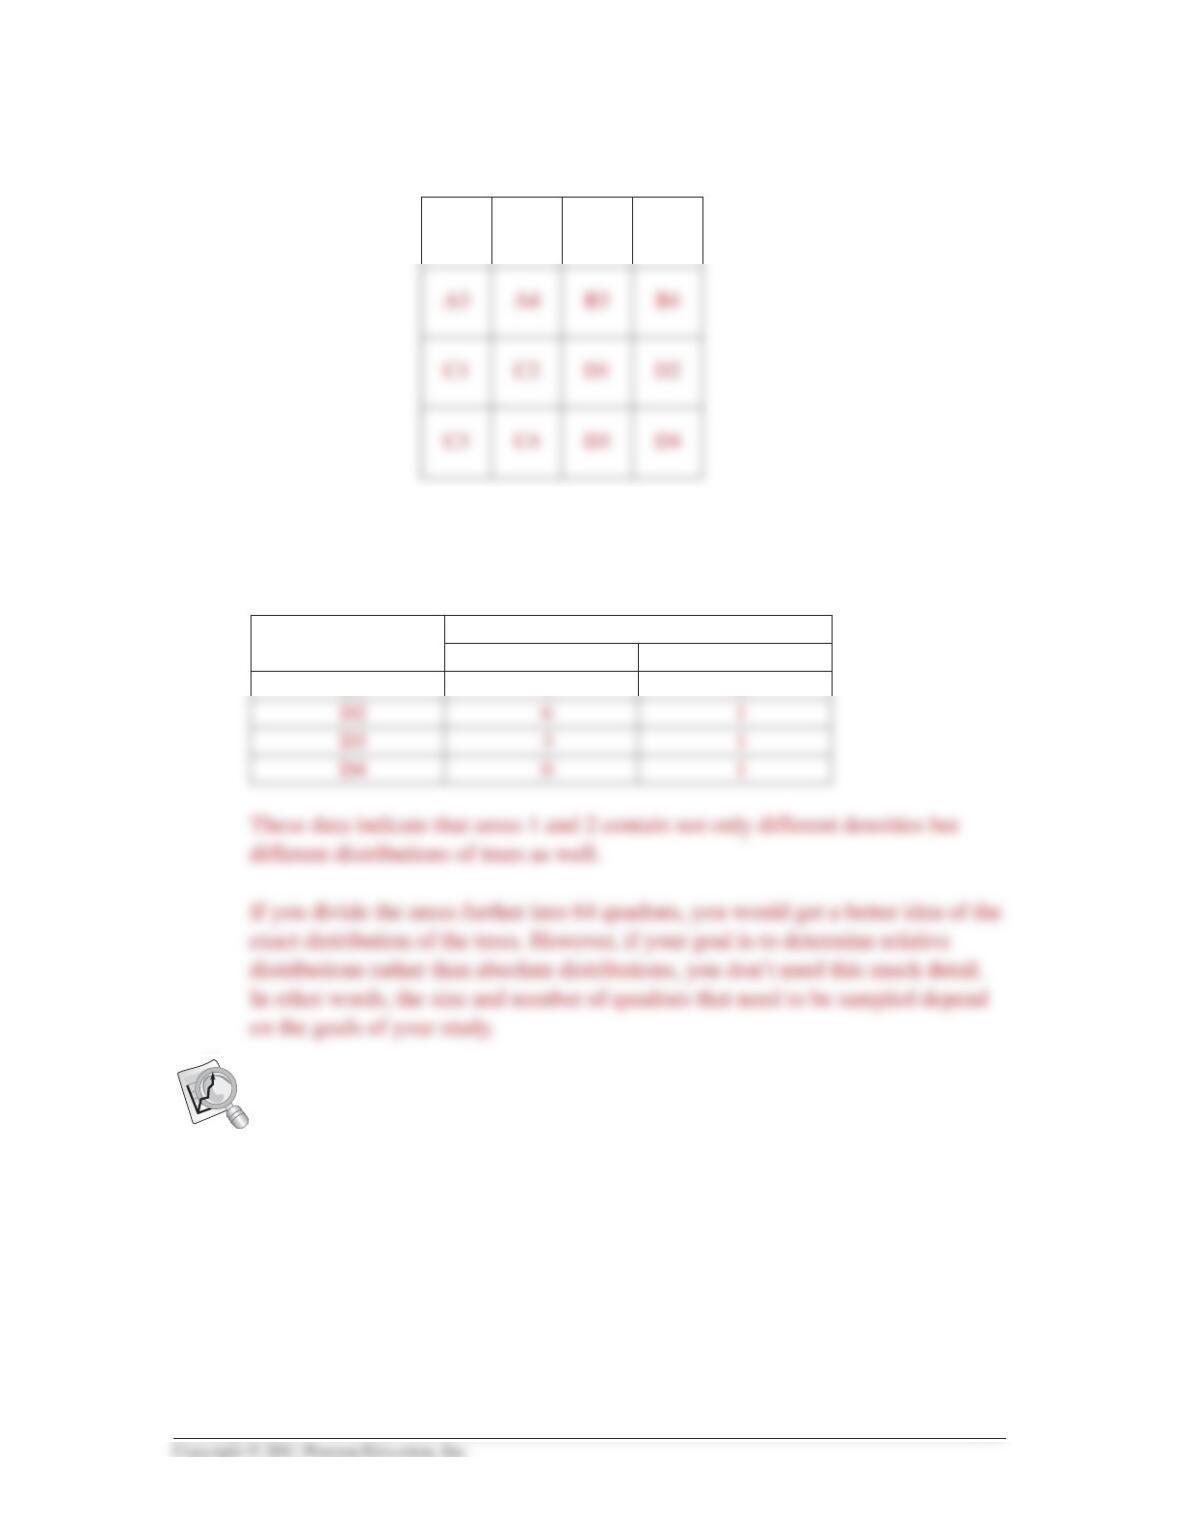
If you sample the four quadrats in section D in each area (1 and 2), your data
would look something like this:
A1 A2 B1 B2
3. The following table provides the numbers of deaths per acre per year
resulting from two different agents of mortality applied to grasshopper
populations of different densities.
Quadrat number: Number of trees
Area 1 Area 2
D1 1 2
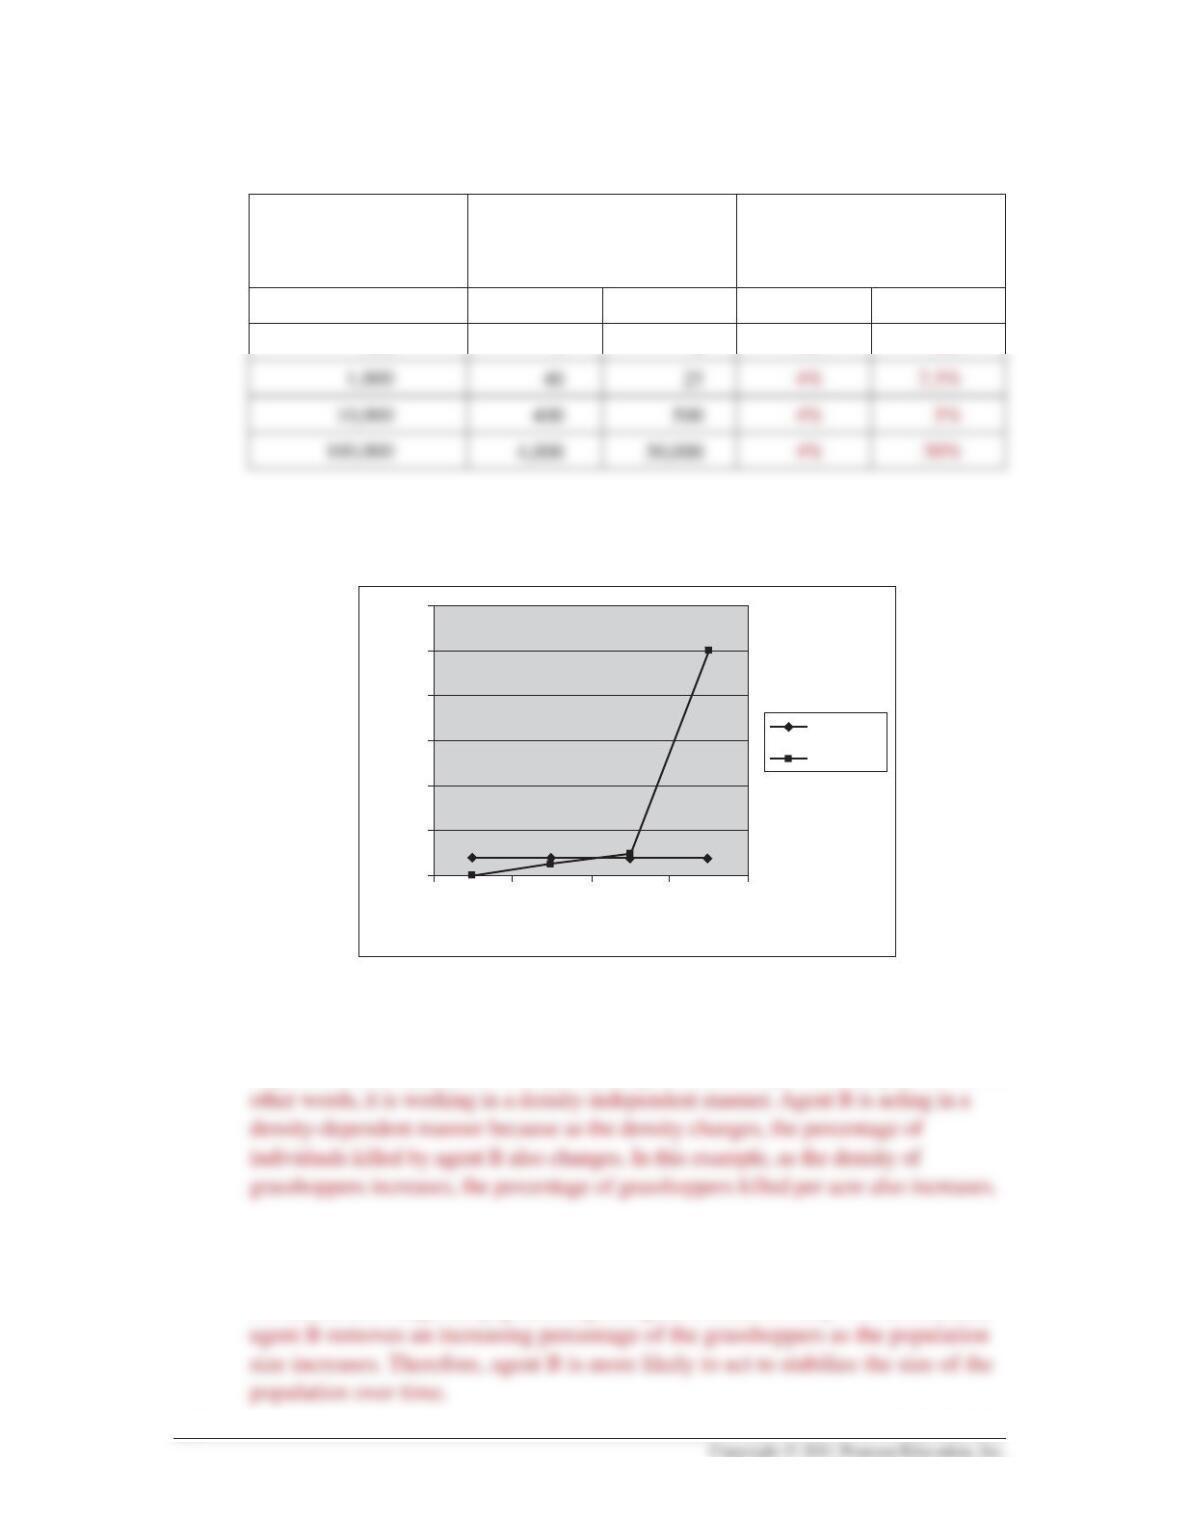
a. Fill in the mortality rates for agents A and B in the table below.
352 Activity 53.1
Grasshopper
population density
(individuals/acre) Deaths per year per acre Mortality rate (%)
Agent A Agent B Agent A Agent B
100 4 0 4% 0%
b. Graph the data below.
60
Mortality Rate (%)
Population Density/Acre
50
40
30
20
10
100 1,000 10,000 100,000
0
Agent A
Agent B
c. Which of the two agents of mortality (A or B) is operating in a density-
independent manner? Explain your answer.
Regardless of the population size per acre, agent A kills only 4% of the population. In
d. Which of the two agents of mortality (A or B) is likely to act as a factor
stabilizing the size of the grasshopper population? Explain your answer.
No matter how large the population gets, agent A removes only 4%. In contrast,
Activity 53.1 353
53.1 Test Your Understanding
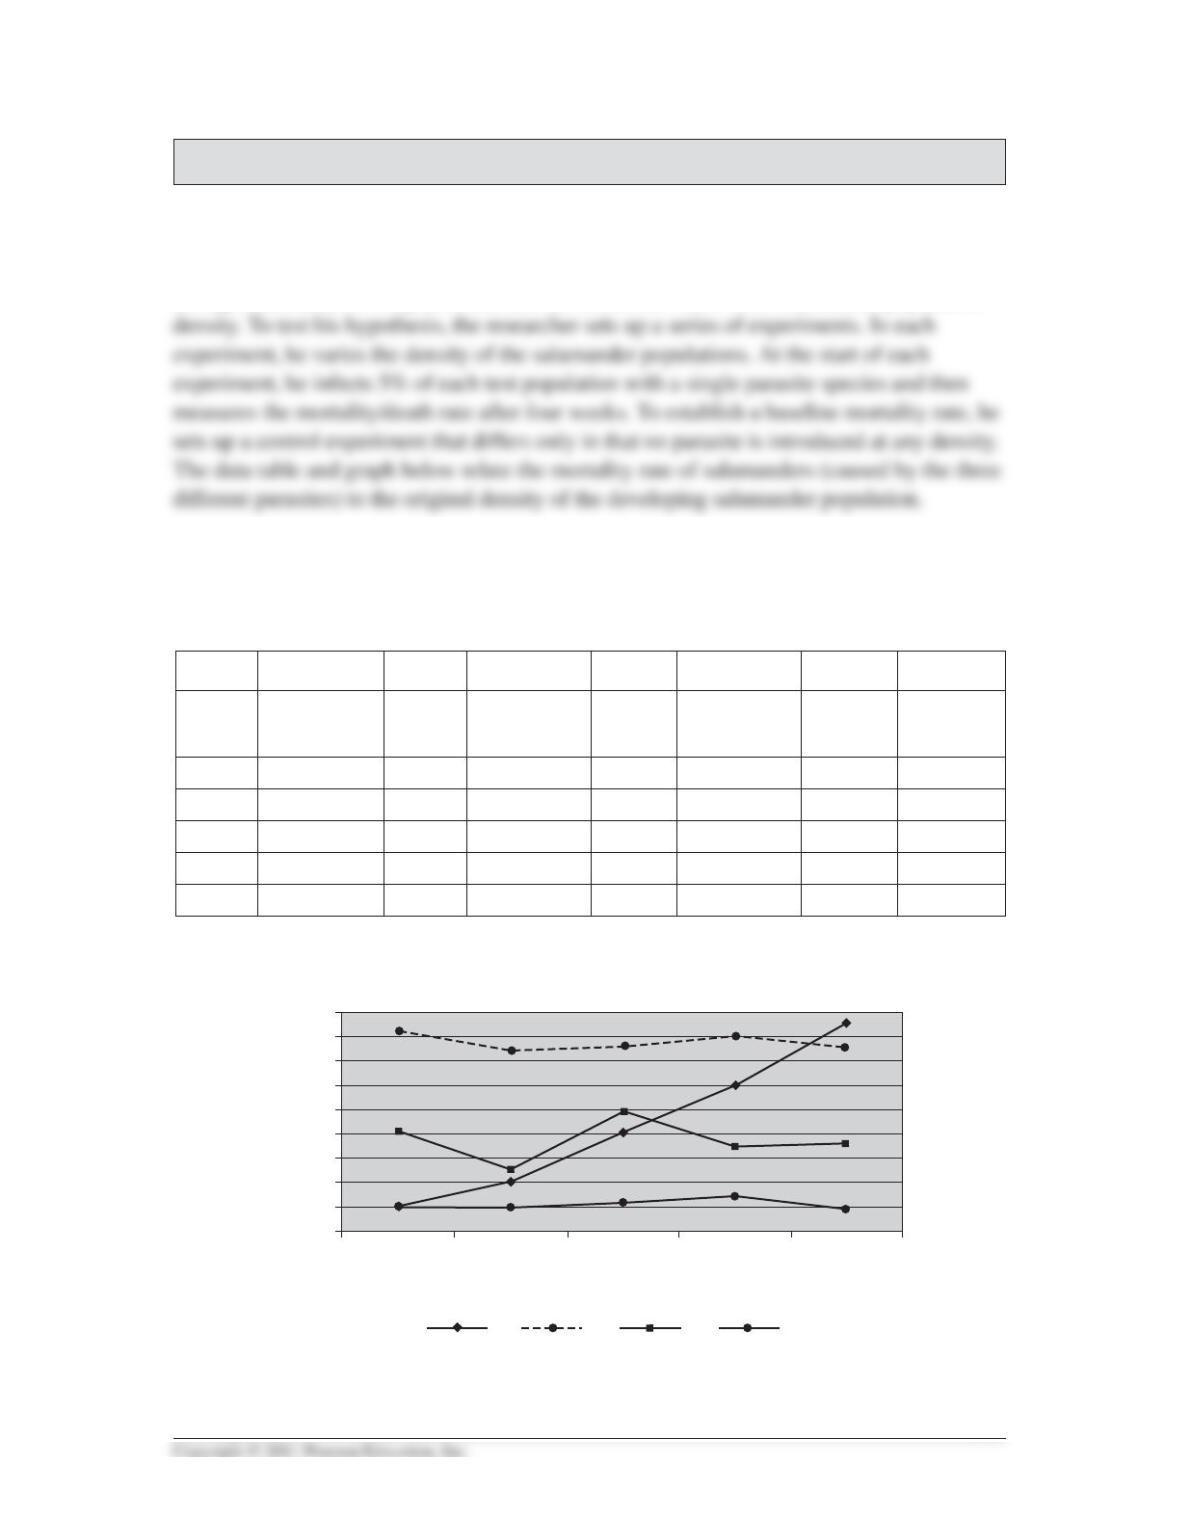
A researcher has recently discovered three species of parasites (A, B, and C) that infect
developing salamanders. He suspects that one or more of these species cause fatalities
during salamander development and that the death rate varies with salamander population
a. Given the data presented in the graph, indicate whether each of the parasite species
(A, B, and C) is acting in a density-dependent or density-independent fashion.
Explain your answers.
Exp. 1 Exp. 2 Exp. 3 Control Control
Density A Mortality
Rate Density B Mortality
Rate Density C Mortality
Rate Density Mortality
Rate
20 0.1 20 0.82 20 0.4 20 0.1
40 0.2 40 0.74 40 0.25 40 0.096
80 0.4 80 0.76 80 0.49 80 0.12
160 0.6 160 0.8 160 0.35 160 0.15
320 0.85 320 0.76 320 0.36 320 0.092
Salamander density
Mortality rate
20
0.8
0.9
0.7
0.6
0.5
0.4
0.3
0.2
0.1
0
40 80 160 320
A B C Control
Parasite A is acting in a density-dependent fashion, because parasite A causes pro-
gressively higher mortality rates as salamander density increases.
b. Looking at the data for parasites A and B, develop an argument to indicate which is
more likely to cause extinction of the salamander population. Explain your
reasoning.
Because of its overall high mortality rate at all salamander densities, parasite B may
Activity 53.2 What models can you use to calculate
how quickly a population can grow?
1. In the simplest population growth model (dN/dt = rN).
a. What do each of the terms stand for?
Term Stands for
dN Change in the number of individuals
b. What type of population growth does this equation describe?
c. What assumptions are made to develop this equation?
2. Population growth may also be represented by the model, dN/dt = MmaxN[(K– N)/K].
a. What is K?
b. If N= K, then what is dN/dt?
c. Describe in words how dN/dt changes from when Nis very small to when Nis
large relative to K.
When Nis very small, the population is growing exponentially. The actual
d. What assumptions are made to develop this equation?
The logistic model assumes that resources and space limit the growth of a
3. You and your friends have monitored two populations of wild lupine for one
entire reproductive cycle (June year 1 to June year 2). By carefully mapping,
tagging, and censusing the plants throughout this period, you obtain the data
listed in the chart.
Activity 53.2 355
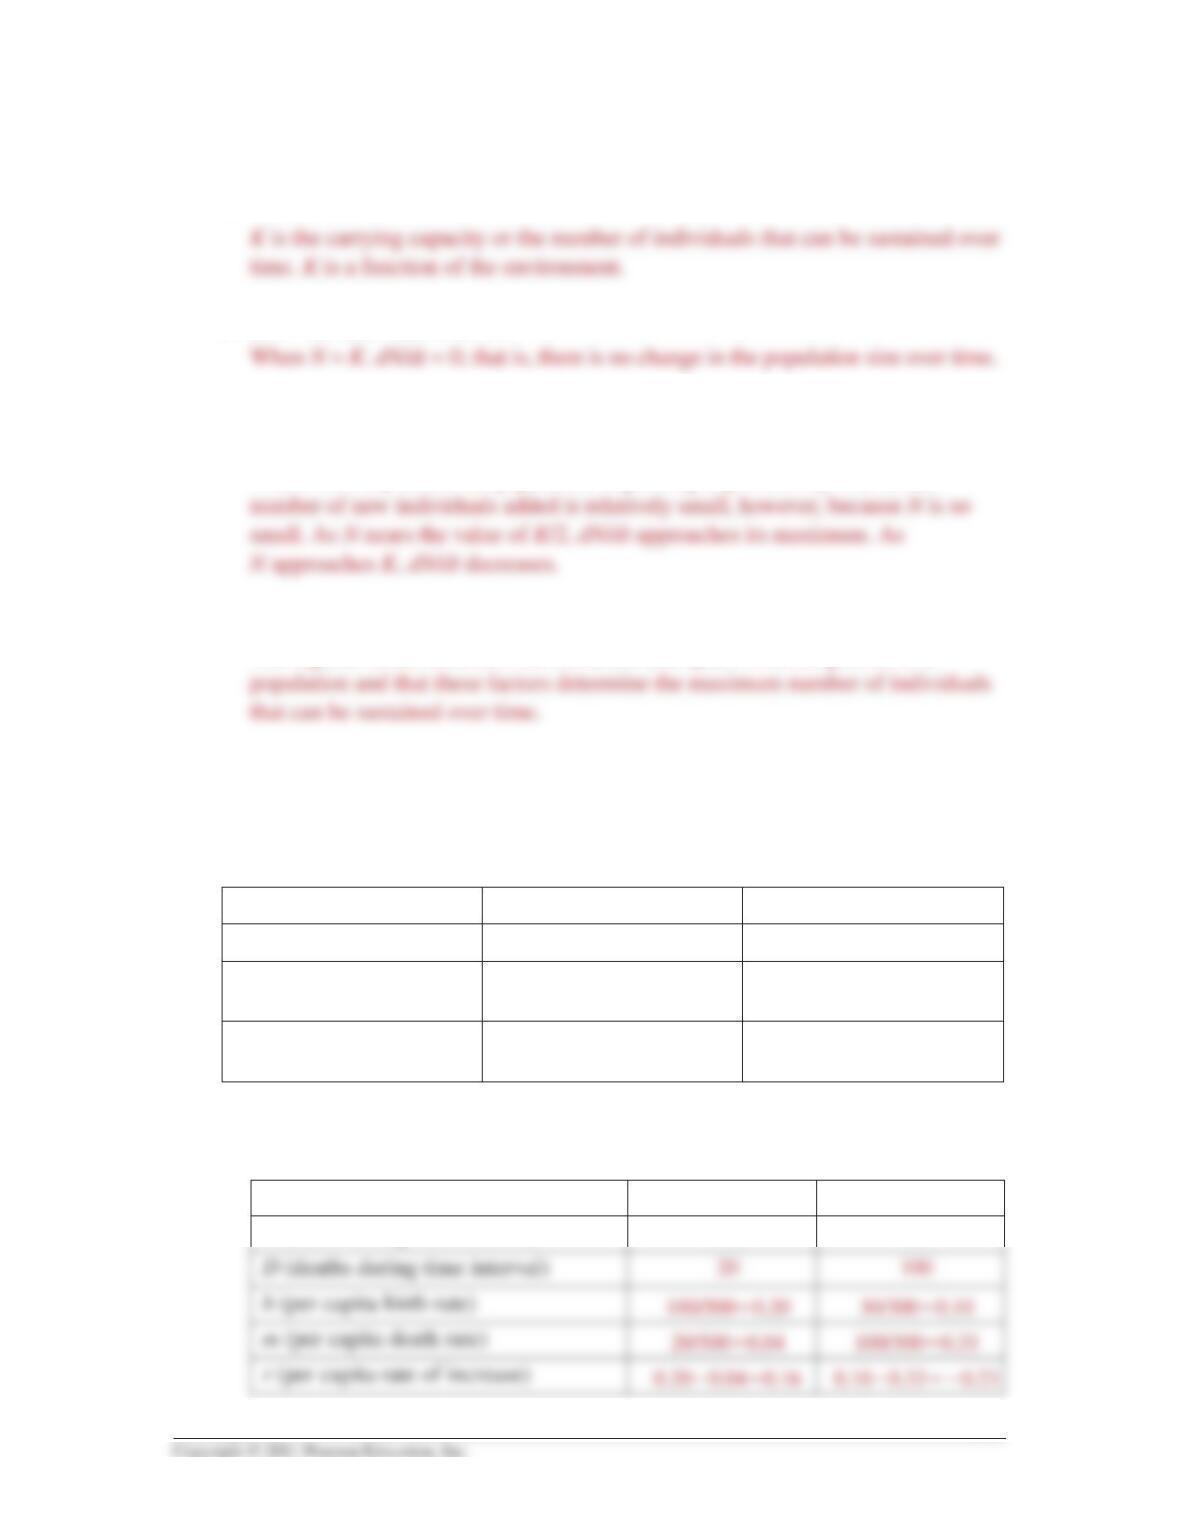
Parameter Population A Population B
Initial number of plants 500 300
Number of new seedlings
established 100 30
Number of the initial
plants that died 20 100
Parameter Population A Population B
B (births during time interval) 100 30
a. Calculate the following parameters for each population.

b. Given the initial population size and assuming that the population is experiencing
exponential growth at growth rate r, what will the number of plants be in each
population in 5 years? (Use the initial population size as time 0, and compute to
time 5.)
4. Using the exponential growth formula, you can determine the amount of time it will
take for a population to double in size if you know rmax or r. Doubling time is equal to:
log102 / log10 (1 ⫹r)
Alternatively this value can be estimated by using the formula:
70 divided by the percent increase per unit time (as a whole number) =
doubling time per unit time or 70/r= approximate doubling time.
Using either of these formulas—the exponential growth formula or the approximate
doubling rate formula—calculate the following.
a. If the population of a country is growing at 2% per year, how many years will it
take for the population to double?
b. If your bank account is growing at a rate of 1% per year, how many years will it
take for it to double?
5. You are studying the growth of a particular strain of bacteria. You begin with a tiny
colony on a Petri plate. One day later, you determine that the colony grew and
exactly doubled in size. A calculation showed that if the colony continued to grow at
the same (constant) rate, it would cover the entire plate in 30 days. (Assume that
colony size is directly proportional to the number of individual bacteria.)
a. What is value of r?
See question 4.
356 Activity 53.2
b. On what day would the bacteria cover half the plate?
6. You collect data on birth and mortality in three populations of grasshoppers, and you
calculate the following birth and death rates for these populations. Both populations
are experiencing exponential growth:
Activity 53.2 357
b d
Population A 0.90 0.80
Population B 0.45 0.35
Population C 0.15 0.05
Are the following statements true or false?
Fa. Population A is growing at the fastest rate.
7. In a herd of bison, the number of calves born in 1992, 1993 and 1994 was 55, 80,
and 70, respectively. In which year was the birth rate greatest?
8. A population of pigeons on the west side of town has a per capita annual growth rate
of 0.07. A separate population of pigeons on the east side of town has a per capita
annual growth rate of 0.10. If the populations are both growing exponentially and both
are censused the following year, in which of the populations will dN/dt be greatest?
Again, you cannot answer this question because you don’t know how large the
9. Suppose you have a “farm” on which you grow harvest, and sell edible freshwater
fish. The growth of the fish population is logistic. You want to manage your harvest
to maintain maximum yields (that is, the maximum rate of production) from your
farm over a number of years.
As a fisheries manager, you are responsible for deciding how many walleye can be
harvested without destabilizing the population.
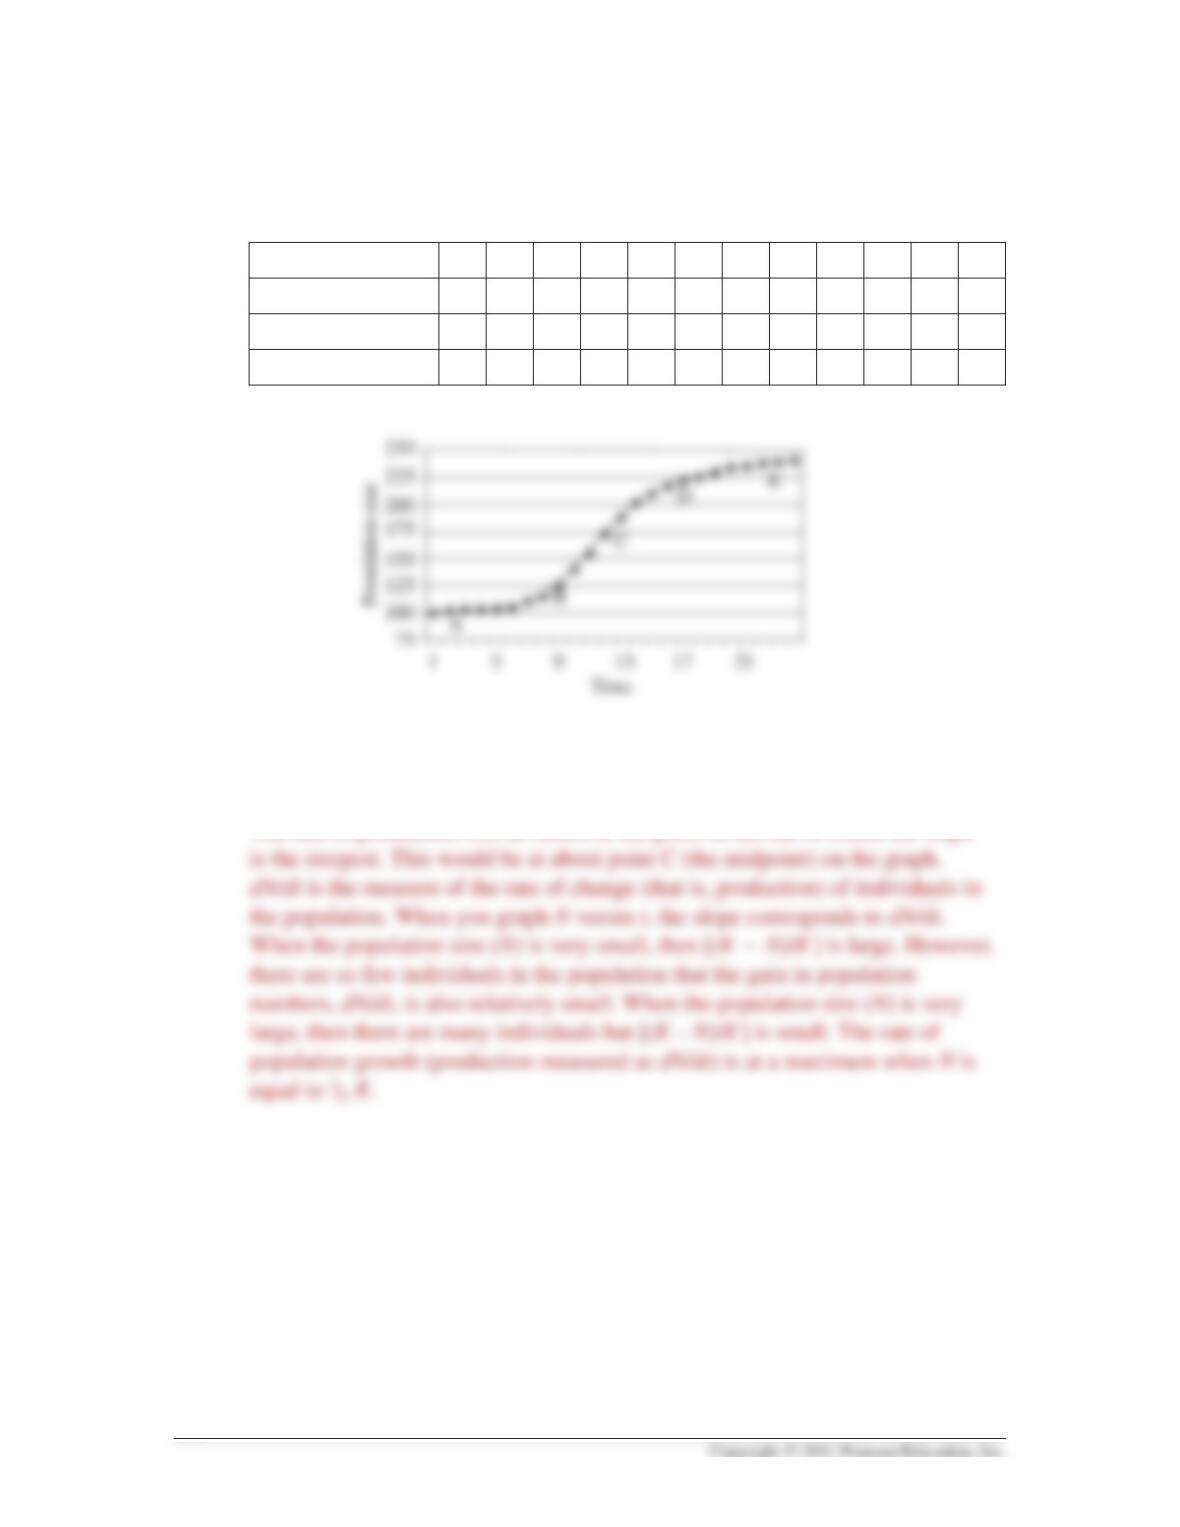
a. Below is a data table showing the walleye population in a typical pond on your
fish farm over 24 weeks. Draw a graph showing how population size in the pond
changes through time.
358 Activity 53.2
Time (weeks) 1 2 3 4 5 6 7 8 9 10 11 12
Population Size 100 101 102 103 104 106 110 115 125 140 155 172
Time (weeks) 13 14 15 16 17 18 19 20 21 22 23 24
Population Size 188 201 209 217 221 225 229 233 235 237 238 239
b. How large should you let the population get before you harvest? Identify the
point on your graph and explain why.
The rate of production will be fastest at the point on the curve where the slope
c. Assume the carrying capacity for your pond is 250 individuals. Check your
answer in part b by using the data in the chart and computing the change in the
population size (dN/dt) when the population is at several different levels relative
to its carrying capacity. Use K= 250 and rmax = 0.20.
a. Fill in the missing data in the table.
b. Owing to a good food supply and small predator population, the rabbit
population is growing by leaps and bounds. The rabbits call a meeting to
discuss population control measures. Two strategies are proposed:
• Delay all rabbit marriages until age class 2–3 (rabbits never breed until after
marriage).
• Sterilize all rabbits in age class 3–4.
Which of the proposed strategies will be more effective in slowing population
growth? Explain your reasoning and show your calculations.
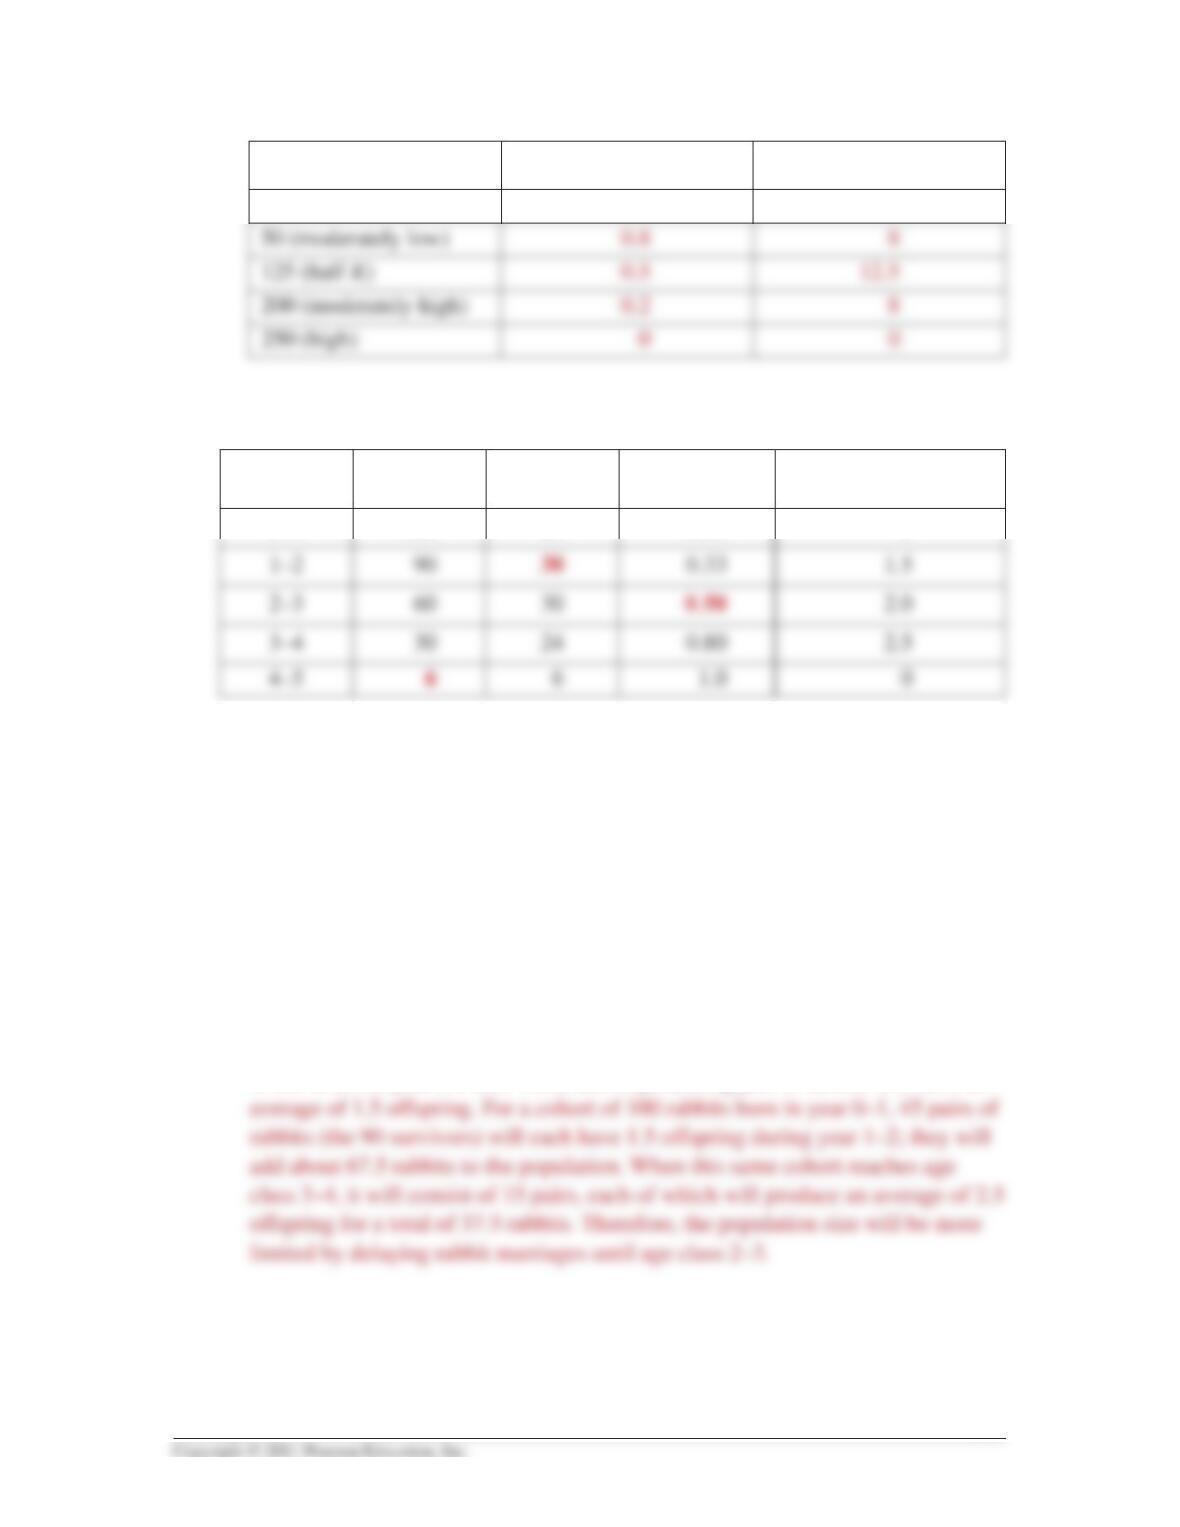
In the first two years of their lives, each reproducing pair of rabbits will have an
Activity 53.2 359
10. A rabbit population has the following life table.
Population size (N) (K– N)/KdN/dt
25 (low) 0.1 0.5
Age class
Number of
survivors
Number of
deaths Mortality rate
Number of offspring per
reproducing pair
0–1 100 10 0.10 0