IM4-12
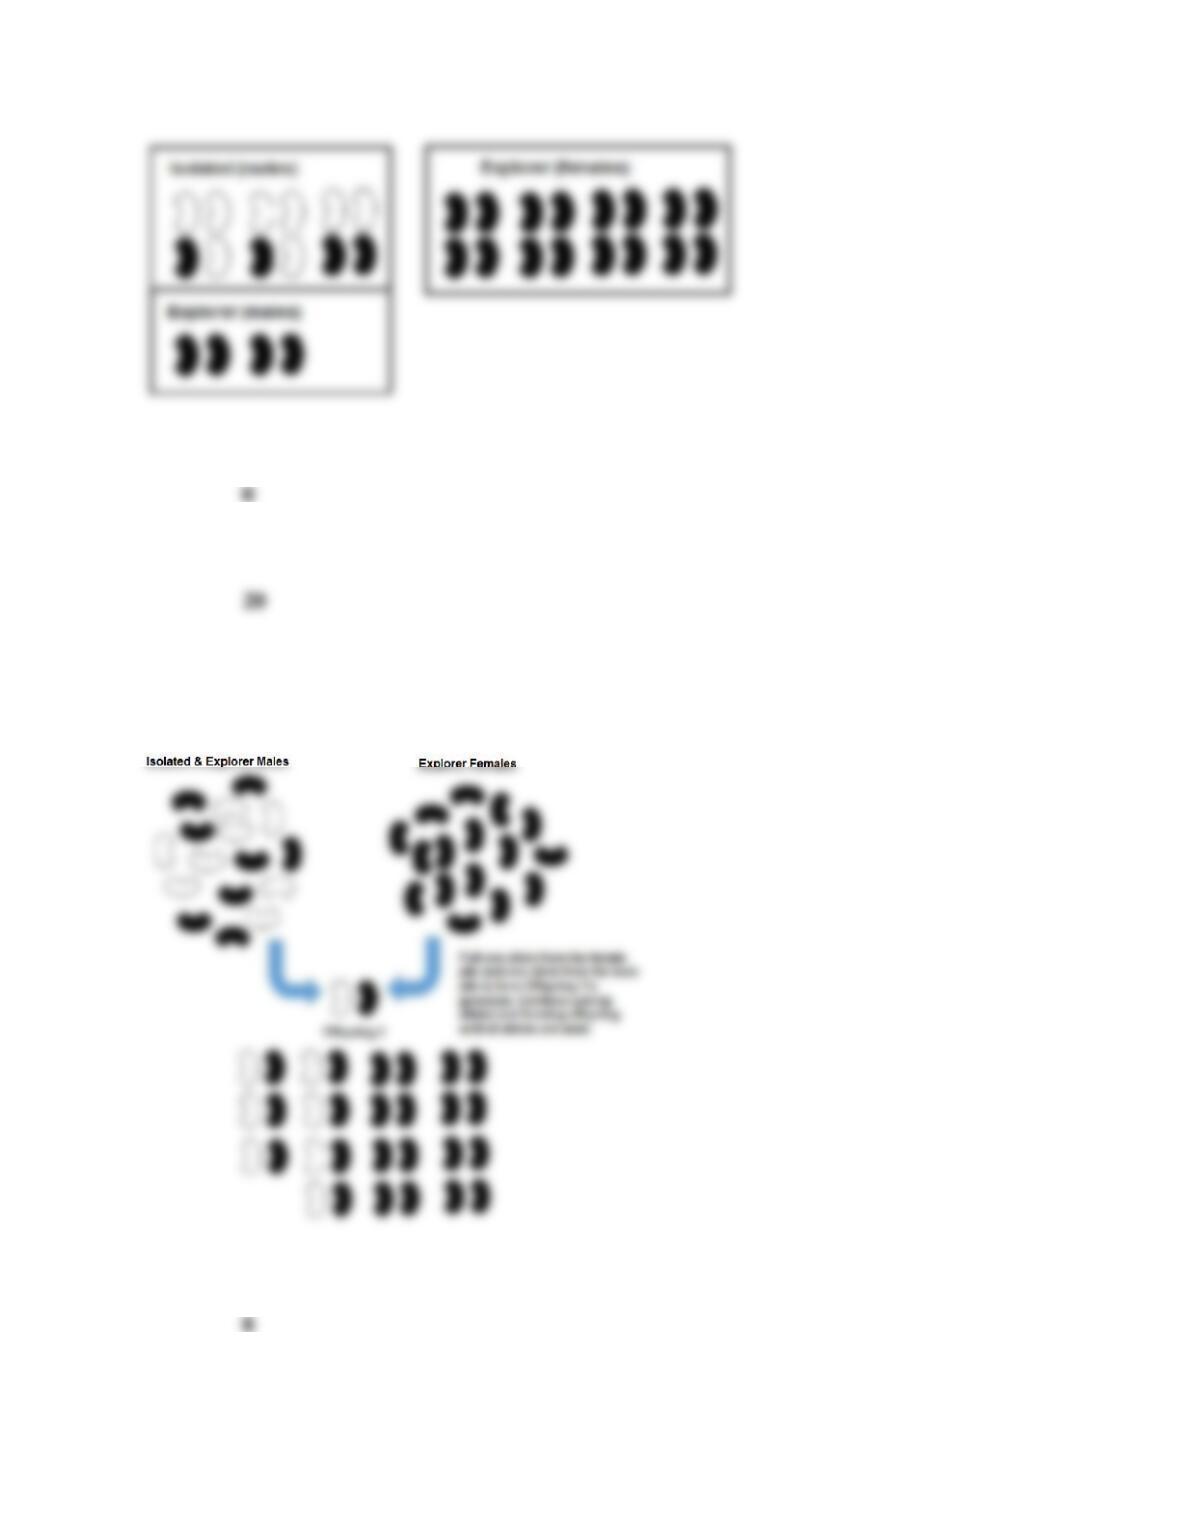
3. How many recessive alleles are present in this explorer population?
4. How many dominant alleles are present in this explorer population?
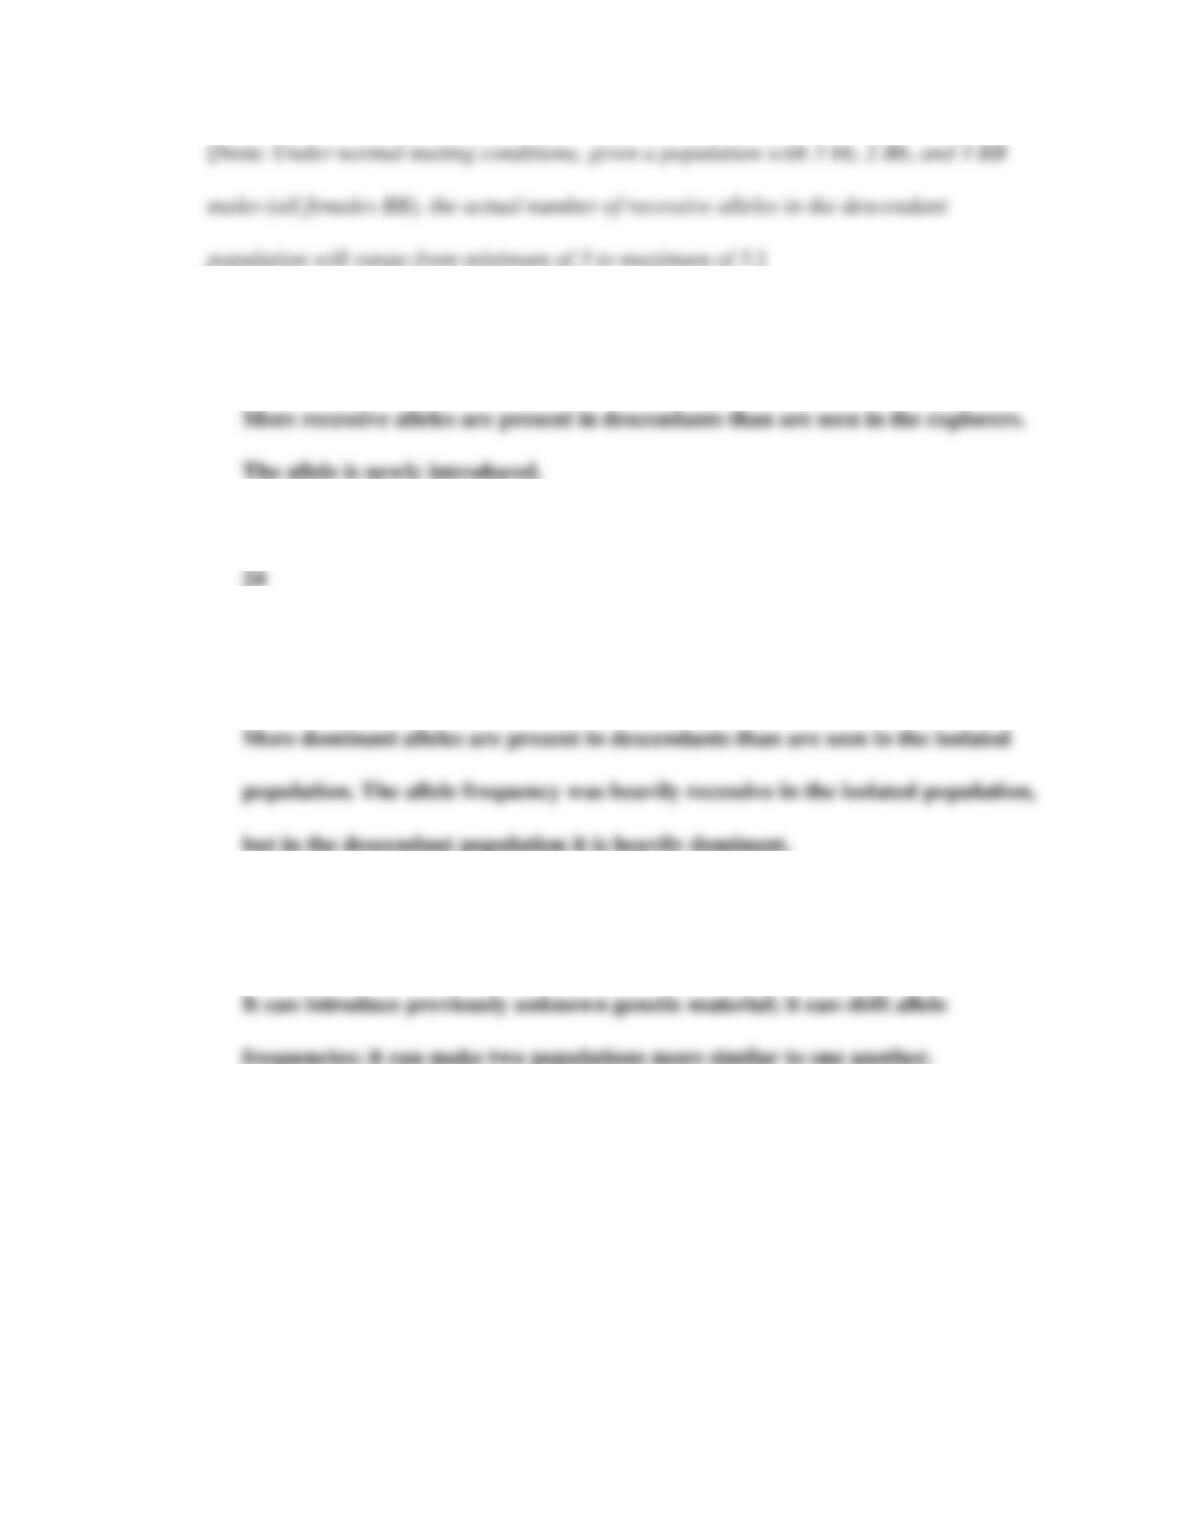
STEP 4: Create the descendant population.
Descendant population (specific order of pairs will vary, but should look something like this):
5. How many recessive alleles are present in this descendant population?
IM4-13
6. How does this number vary from the number of recessive alleles present in the
explorer population?
7. How many dominant alleles are present in the descendant population?
8. How does this vary from the number of dominant alleles in the original, self-isolated
population?
9. What long-term effects can gene flow have on any two populations that are
exchanging genes?
Exercise 5: Overlapping Forces of Evolution (20 to 25 minutes)
In this exercise, you are to provide students with a cup of beans (40 brown and 40 white). [Note:
Dried pinto beans work well for the brown beans, and dried navy beans, great northern beans,
or cannellini beans work well for white beans.] These represent the brown fur and white fur
IM4-14
alleles in a mouse population. [Note: You will also need one additional black bean for each cup
(Step 8) that represents a new mutation for gray fur.] This exercise combines multiple forces of
evolution (natural selection, the randomness of genetic drift, and mutation) simultaneously in a
population of mice. It also highlights that dominant alleles are not necessarily “better” or more
common than recessive alleles. We suggest having students work in groups and share the tasks of
pulling out beans, etc. The groups can work simultaneously, so that everyone in the class works
at the same pace and they share their results as they go. This sharing can also highlight the
random influences of genetic drift, as each group has different results.
STEP 2: Create the gene pool.
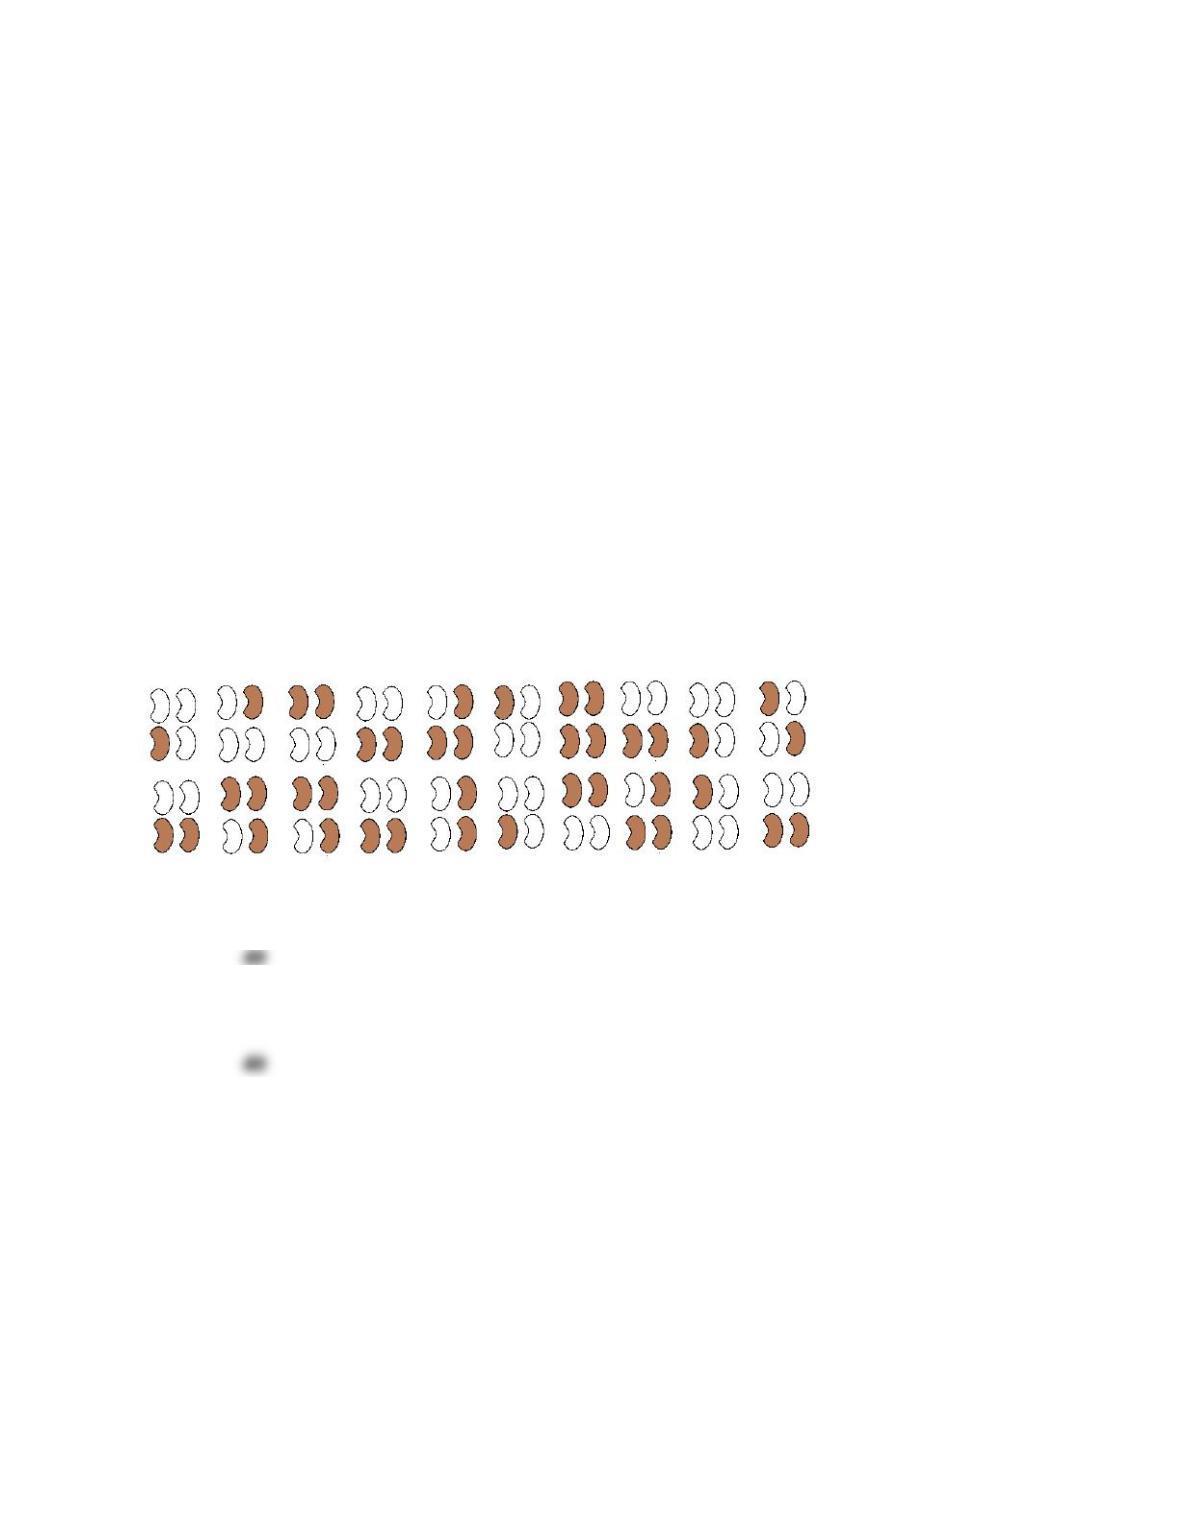
Exact matching of beans will vary but should result in 40 pairs similar to these:
1. How many recessive alleles are present in your overall population?
2. How many dominant alleles are present in your overall population?
STEP 3: Account for random shifts in allele frequency.
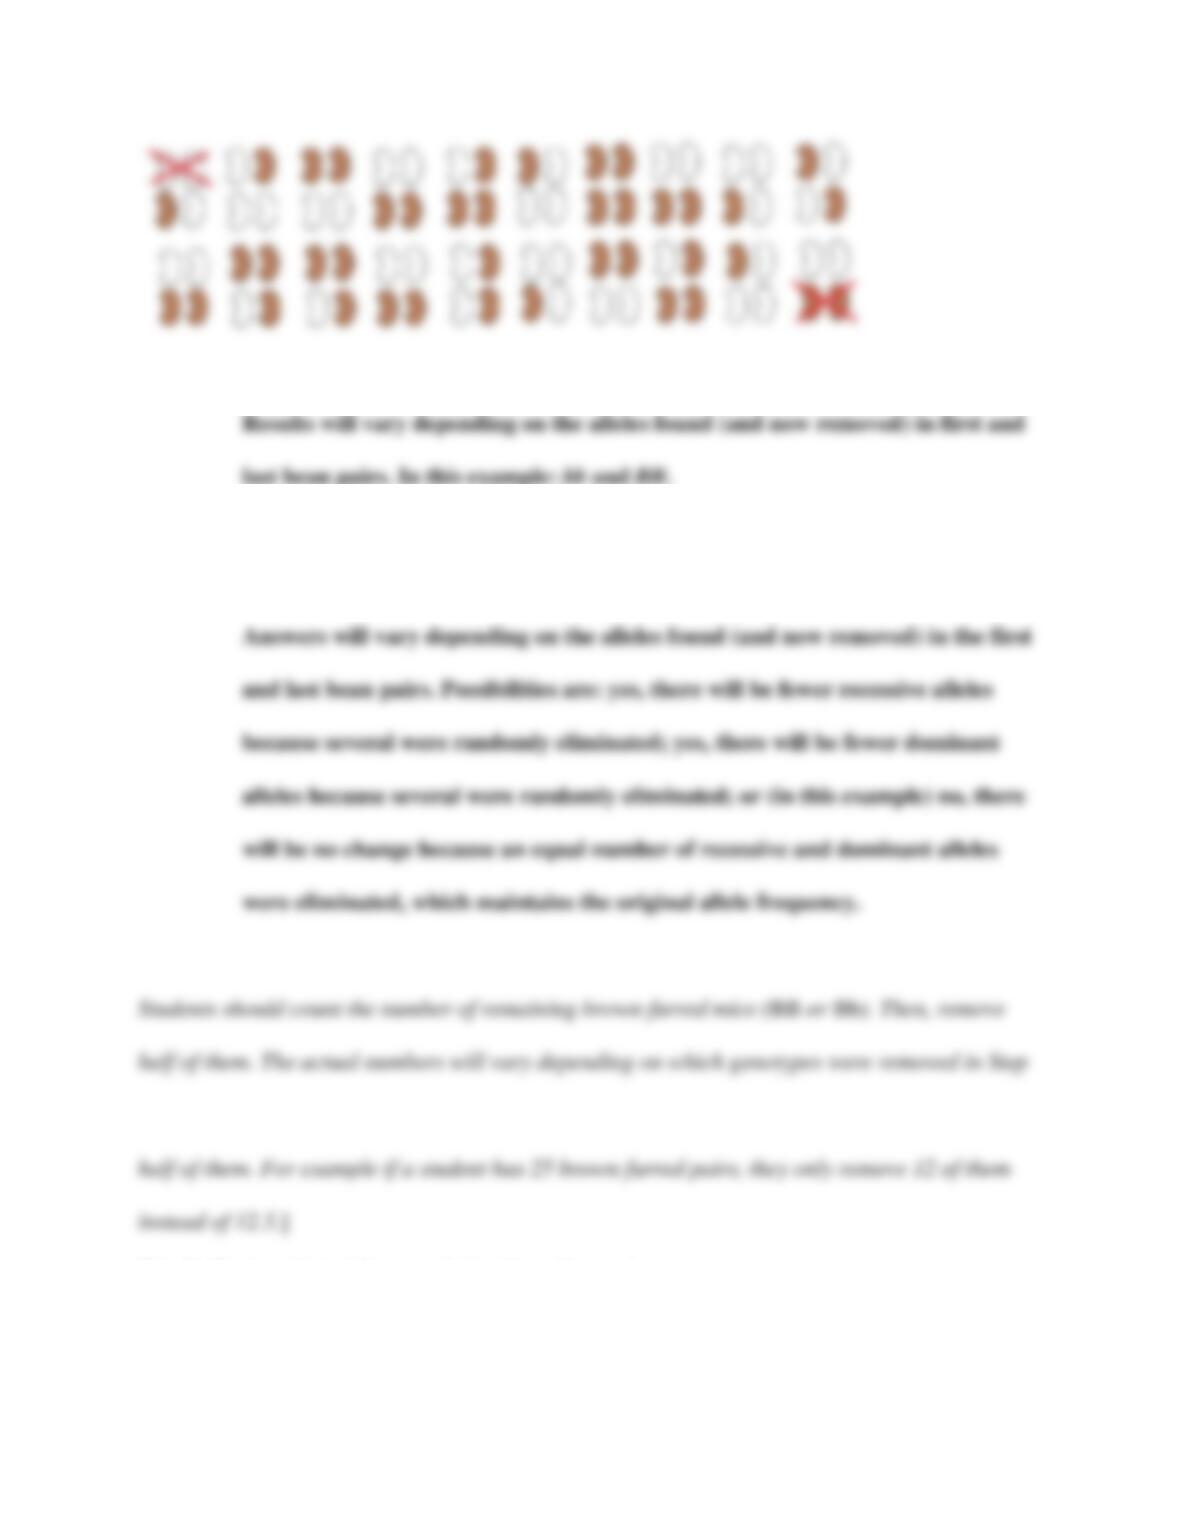
Eliminate the first and last pairs because of genetic drift. For example:
IM4-15
3. What were the two genotypes that were randomly eliminated?
4. Will their elimination influence future allele frequencies in this population? If so,
how?
STEP 4: Simulate an environmental change that affects the population.
2. [Note: If students have an odd number of brown-furred mice, they should remove just under
Step 5: Create a descendant population from the survivors.
IM4-16
Students will randomly re-draw genotype pairs from the cup and document them in a table.
Specific genotypes will vary depending on the outcomes from previous steps. [Note: The table
allows for 40 individuals, but students will have some number fewer than this depending on how
many genes were eliminated through genetic drift and natural selection in earlier steps.]
5. How many recessive alleles are present in your overall population now?
6. How many dominant alleles are present in your overall population now?
STEP 6: Account for random shifts in allele frequency.
Students now eliminate the second and fourth genotype pairs.
7. What were the two genotypes that were randomly eliminated?
8. Will this elimination impact future allele frequencies in this population? If so, how?
IM4-17
STEP 7: Assess the effect of the environmental change on future generations.
Students should count the number of remaining brown-furred mice (BB or Bb). Then, remove
half of them. The actual numbers will vary depending on which genotypes were removed in
previous steps. Students will then randomly re-draw genotype pairs from the cup and document
them in a table. Specific genotypes will vary depending on the outcomes from previous steps.
[Note: The table allows for 40 individuals, but students will have some number fewer than this
depending on how many genes were eliminated through genetic drift and natural selection in
earlier steps.]
9. How many alleles of each type are present in your overall population this time?
10. What is happening to the dominant allele?
11. What might eventually happen in this population if the new snowy environment
remains and having brown fur continues to harm reproductive success?
IM4-18
12. While natural selection was underway, how did genetic drift simultaneously affect the
allele frequency for fur color across generations?
Answers will vary because the genetic drift will have been experienced
STEP 8: Assess the effect of random mutation on allele frequencies.
Provide each student/group with one black bean that will represent a random mutation in the
gametes of one mouse. They should swap this black bean for one of their existing brown beans.
This new mutation results in gray fur, which is dominant over white fur.
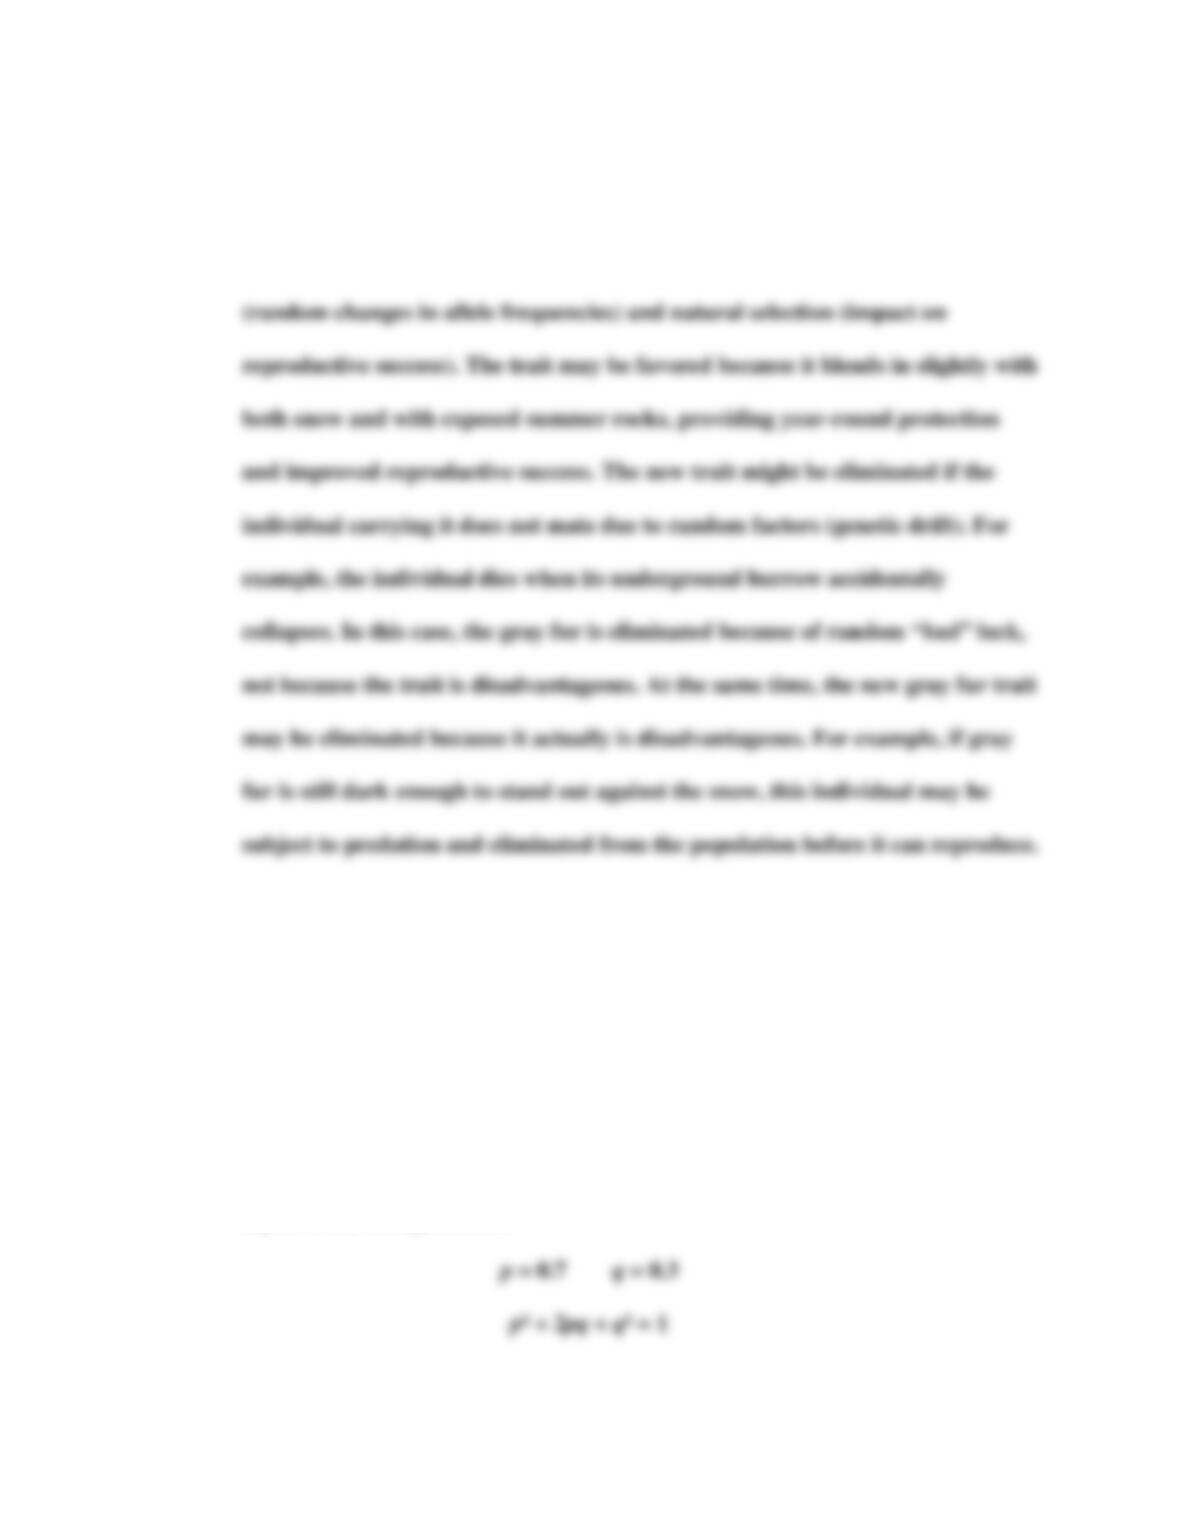
13. Consider how the presence of this new fur color allele might influence the future
evolution of this population. Under what circumstances might this version of the trait
IM4-19
be favored? Under what circumstances might this version of the trait be eliminated
from the gene pool?
Answers may vary as students weigh the potential impact of genetic drift
Exercise 6: Hardy–Weinberg Equilibrium (10 to 15 minutes)
This exercise involves the simple Mendelian trait for freckles, with F being the dominant allele
and f the recessive allele in a population with allele frequencies of 70% F and 30% f. Students
should show their calculations.
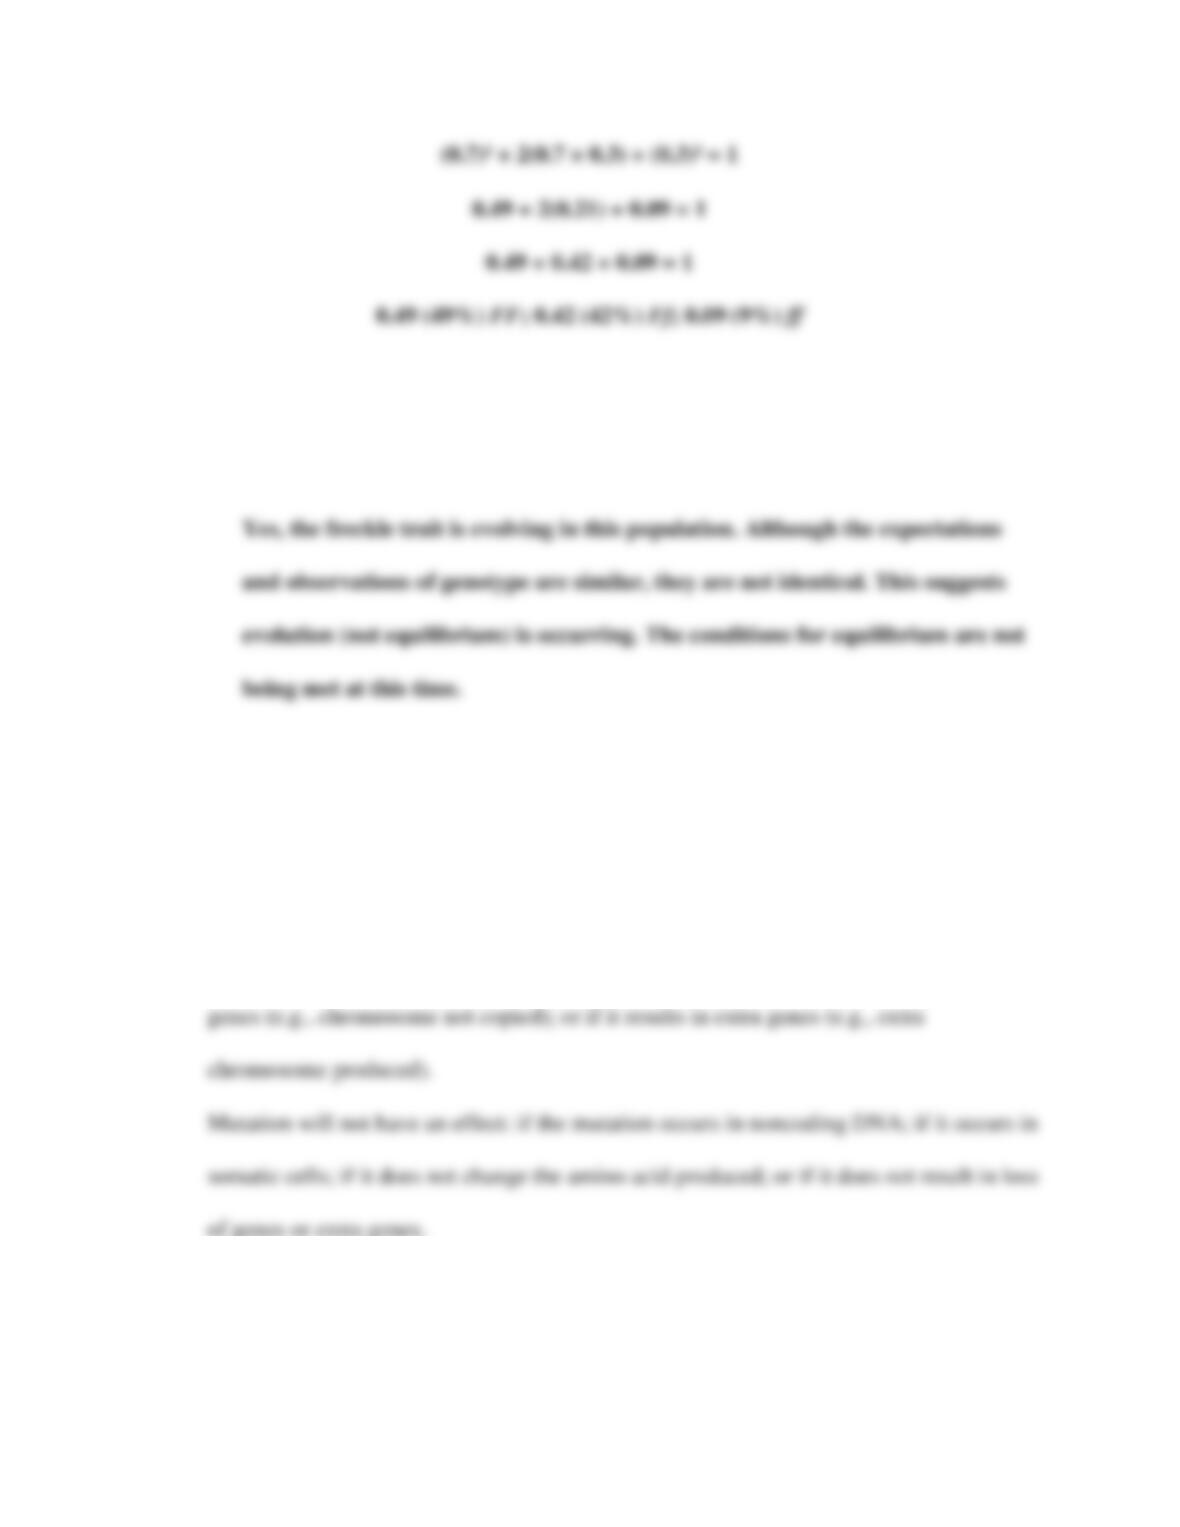
1. Use the Hardy–Weinberg equation to determine the genotype frequencies we should
expect in the next generation.
IM4-20
2. You have collected data on the observed genotype frequencies of the next generation.
They are: 60% FF, 30% Ff, and 10% ff. Based on these observations and your
expectations, is this trait currently evolving in this population? Why or why not?
ANSWERS TO LAB 4 CRITICAL THINKING QUESTIONS
1. Circumstances under which mutation will have an effect: if the mutation occurs in coding
DNA; if it occurs in gametes; if it changes the amino acid produced; if it results in loss of
2. Answers giving a hypothetical natural selection scenario will vary, but should include a
description of the trait, the variation of that trait in a population, the advantage or
disadvantage of the trait in competition and in reproductive success, and the changes in
3. Answers giving a hypothetical example of the founder effect will vary but should include
a description of the trait in question, the founding situation (migration, catastrophe, etc.),
the differences between the original population and the founding population, and the
4. Answers giving a hypothetical gene flow scenario will vary but should include a
IM4-22
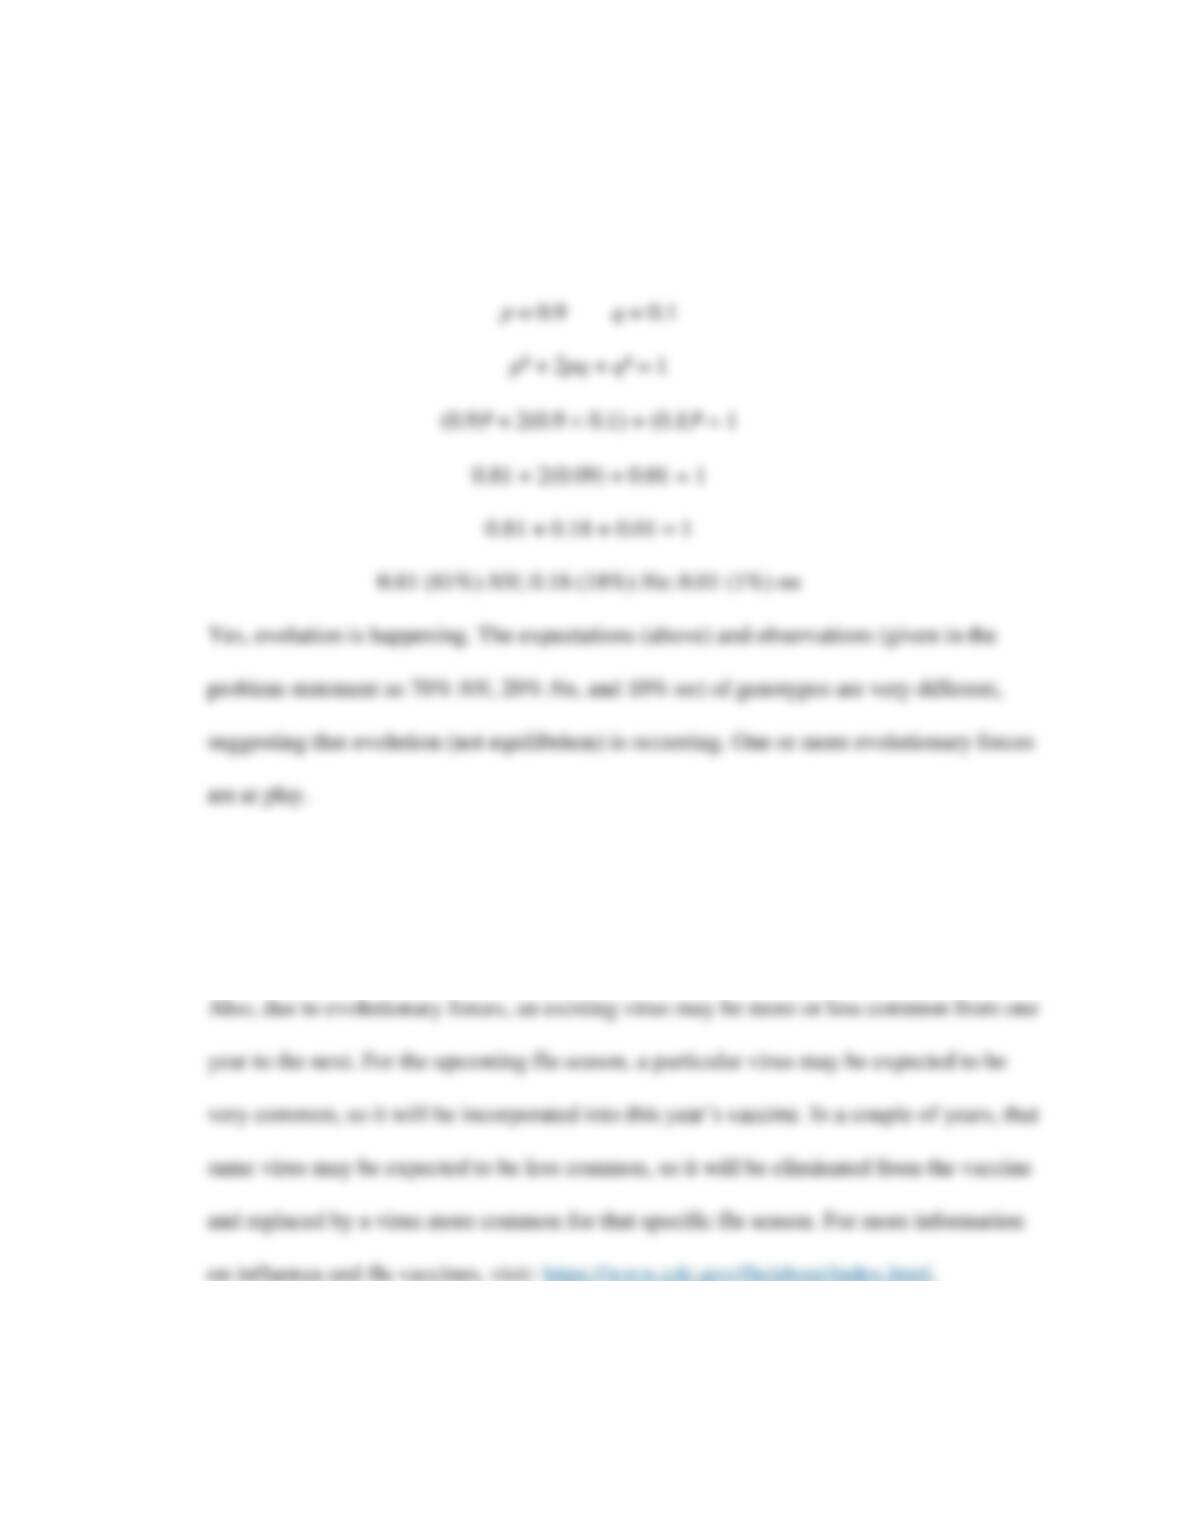
5. Given a population with 90% (0.9) of the alleles dominant (N) and 10% (0.1) recessive
(n) for non-hitchhiker’s thumb, the genotype frequencies we should expect in the next
generation are as follows:
6. The virus strains used to make vaccines will vary from year to year because the influenza
virus is always evolving, so the same vaccine cannot be used year after year. Through
mutation, new strains appear each year and need to be considered for use in the vaccine.