CHAPTER 35 THE IMMUNE SYSTEM
Scientific Skills Exercise
Teaching objective: The goal of this exercise is to lead students to see that graphing data can
reveal mechanisms in a way that is not readily apparent from the raw numerical data, and to see
that sometimes it is the pattern of the data that is particularly informative, rather than any single
bits of information.
Teaching tips:
Many students who know how to read simple line graphs have a much harder time recognizing
patterns and trends in more complex graphs. This exercise leads the students through the data
once with a table of information only on total parasite load and a second time with a table of
Answers:
1.
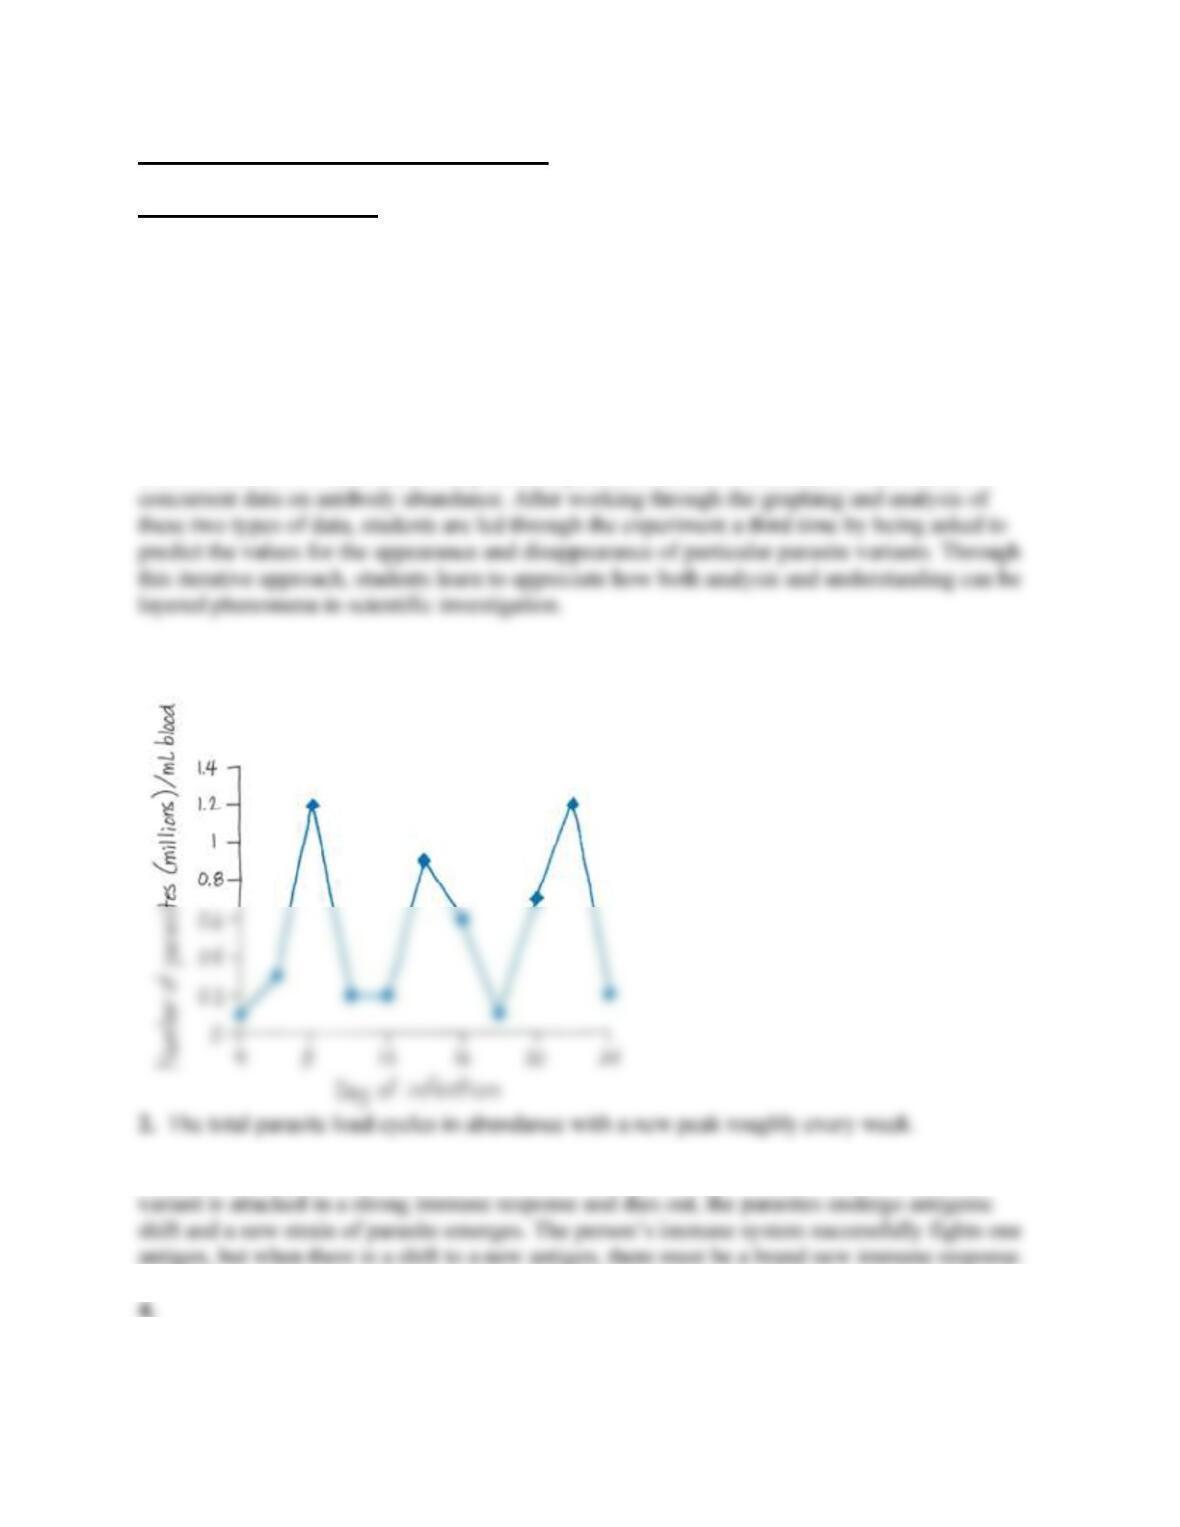
3. Trypanosomes have great potential variation in their coat genes. Even though each coat
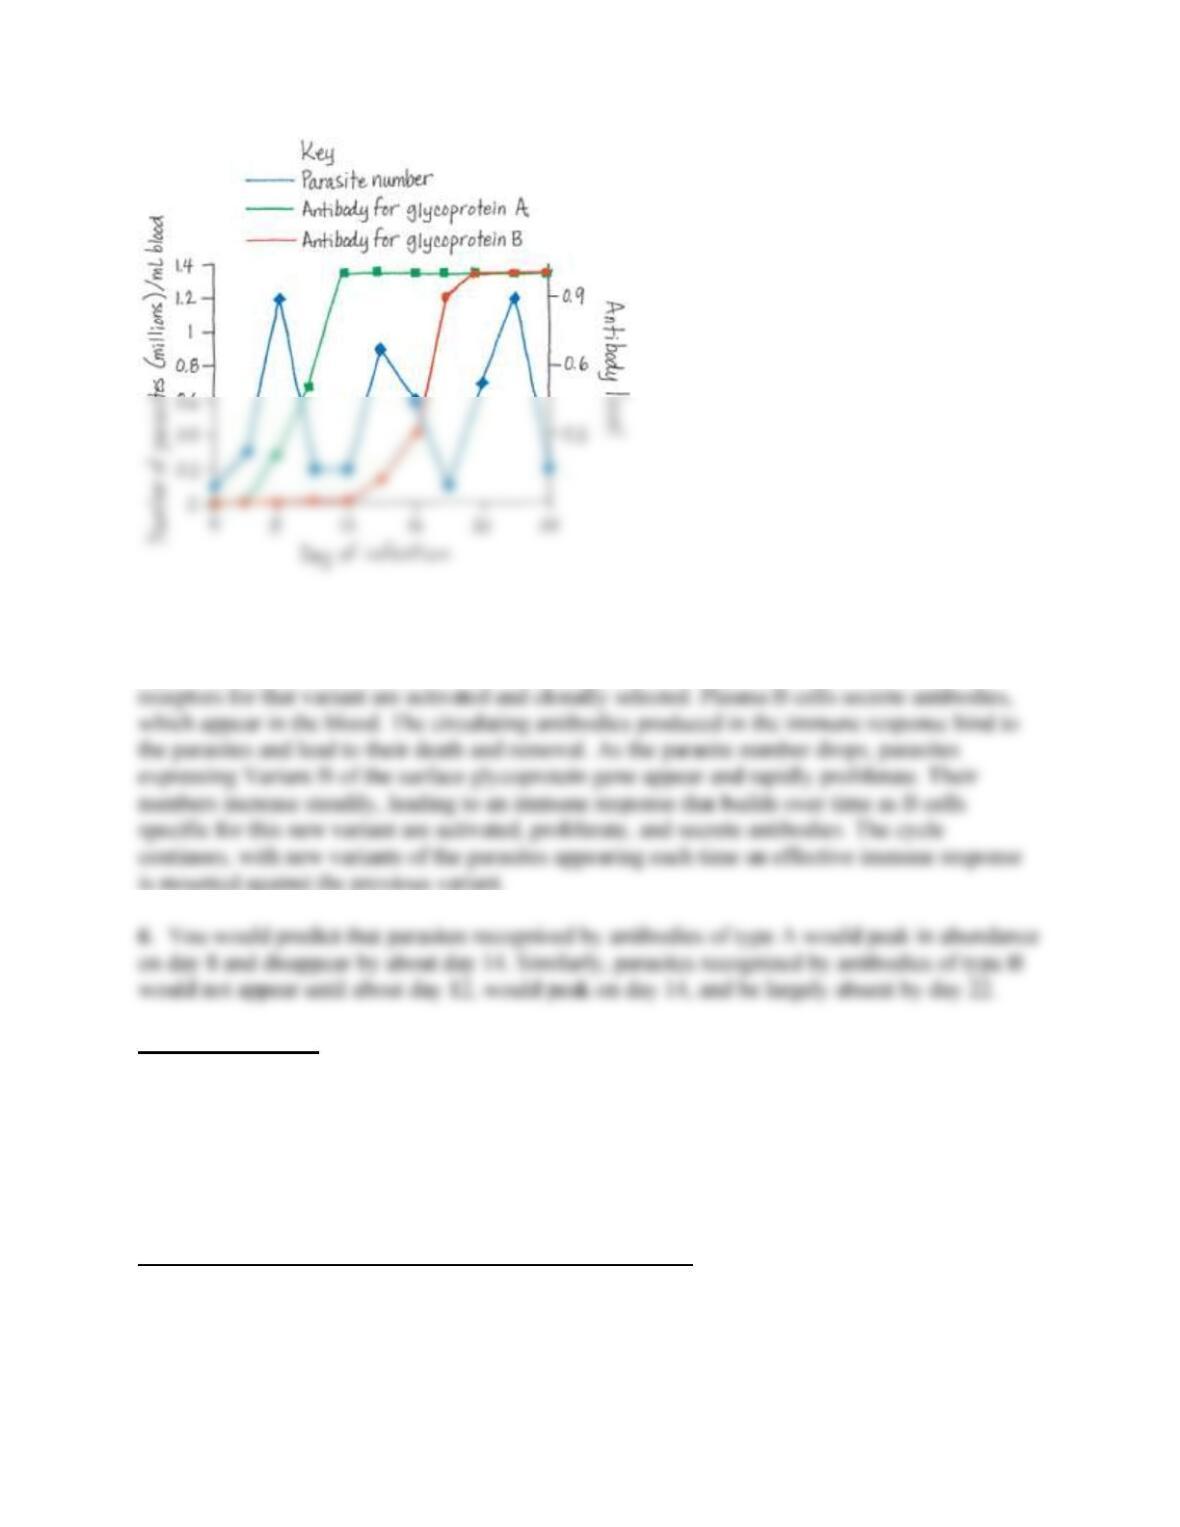
5. The antibody levels support the hypothesis, since antibodies to each variant appear
sequentially, one week apart, and peak in abundance as the number of parasites in circulation
dips. As parasites with Variant A of the surface glycoprotein appear in the blood, B cells with
Interpret the Data
Figure 35.12 The concentration of antibodies to A at day 36 is about 400 times that at day 16 (8
× 103 / 2 × 101). If the number of B cells producing a specific antibody is proportional to the
concentration of that antibody, then the number of B cells producing antibodies to A at day 36 is
about 400 times the number at day 16, and the frequency of B cells specific for A at day 36 is
about 400 times the frequency at day 16: 400 in 105, or 1 in 250.
Suggested Answers for End-of-Chapter Essay Questions
See the general information on grading short-answer essays and a suggested rubric at the
beginning of this document.
9. Make Connections
10. Scientific Inquiry
You could inject LPS into the blood of each strain of mice. You predict that mice mutant for the
11. Focus on Evolution
Lysozyme is an enzyme of invertebrate digestive systems that digests the peptidoglycan of
12. Focus on Information
Sample key points:
DNA loss in B and T cells is limited to specific regions of the genome.
DNA loss in B and T cells is essential for the adaptive immune response.
Sample top-scoring answer:
The inheritance of information encoded in DNA is the basis for the maintenance and propagation
of both cells and organisms. Animal populations reproduce through the fertilization of eggs by
13. Synthesize Your Knowledge
In a cell-mediated response, cytotoxic T cells might eliminate a polio infection by killing
infected neurons, but substantial damage to the nervous system would occur as a result. In a