Lab 14
61
Lab 14
Estuaries
Description of the Lab
Students will investigate the relationship between salinity and density. The
impact of water density on estuary profiles will be explored. This lab will take
approximately 2 hours.
Laboratory Materials and Equipment for Student Use
Materials and Equipment
Per
Student
Per Pair of
Students
Per Lab
Group
Per
Room
10L aquarium with divider grooves
1
Plexiglass aquarium divider
1
250mL Graduated Cylinder
4
9cm Pasteur pipettes
3
Sodium Chloride
600gm
Refractometer
1
Thermometer
1
Water (tap)
Calculator
4.5-5L plastic containers
2
Top Loading Balance (g)
Outline of Investigation
Exercise 1 – Salinity
Materials needed:
• Small aquarium (~10L) with groves to receive divider
• Plexiglass divider cut to fit aquarium width
• Two 4.5-5L containers to mix salt water
Note: other containers can be modified for this exercise as an alternative to a small
aquarium.
Exercise 2 – Effects of Temperature and Salinity on Stratification
Materials needed:
• Four 250-mL graduated cylinders
• Sodium chloride (NaCl)
Exercise 3 – Animal Adaptations to Salinity Stratification
Materials needed:
Answers to Questions for Lab 14
Exercise 1 – Salinity
1. Based on your observations, which water is denser? Why?
2. What happened with the two volumes of water in your aquarium?
3. Where would you expect to find the saltier water in an estuary?
Exercise 2 – Effects of Temperature and Salinity on Stratification
1. How well did, or didn’t, the solutions mix?
Lab 14
64
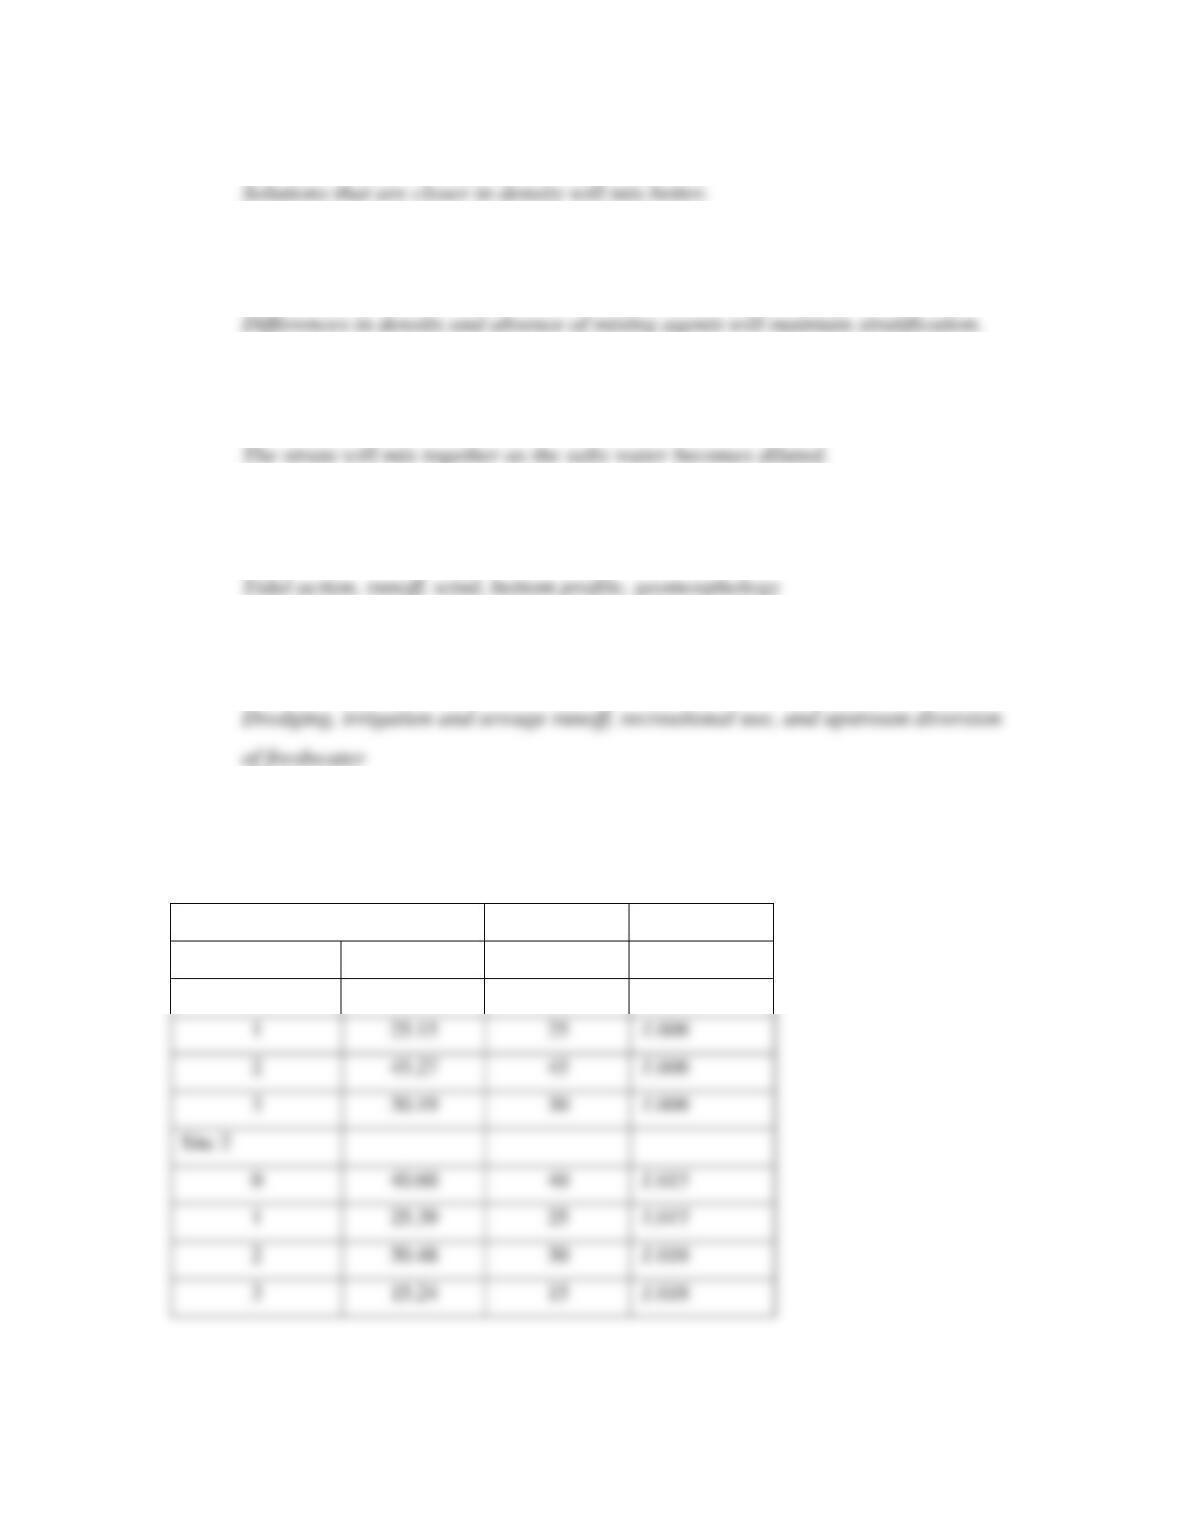
2. Were there any two that mixed better than the others?
3. Why did the solutions remain stratified?
4. What would happen if you stirred the solutions?
5. What natural processes could stir the waters in an estuary?
6. What human activities stir the waters in an estuary?
Exercise 3 – Animal Adaptations to Salinity Stratification
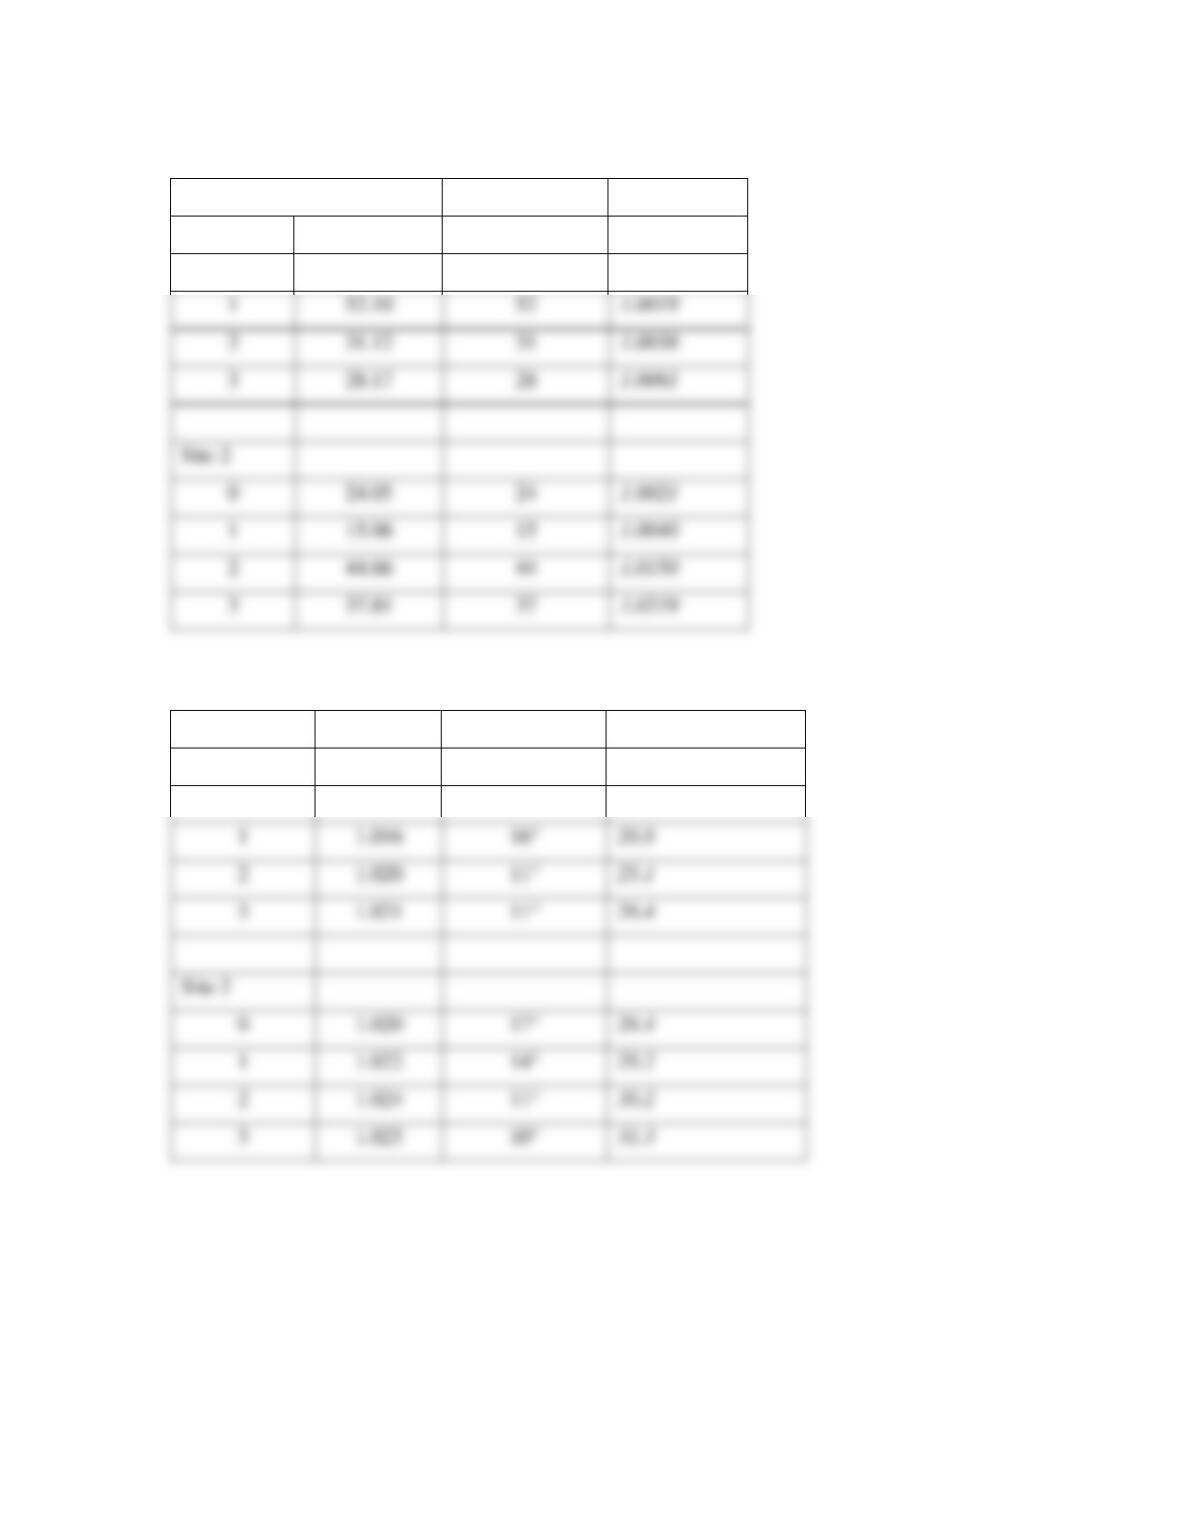
Problem 1
Site 1
Depth (m)
Mass (g)
Volume (mL)
Density
0
30.31
30
1.0103
Site 2
2
30.48
30
1.016
Lab 14
65
Problem 2
Site 1
Depth (m)
Mass (g)
Volume (ml)
Density
0
18.02
18
1.0011
Problem 3
Site 1
Depth (m)
Density
Temperature °C
Salinity (ppt)
0
1.015
17°
19.9
1
1.016
16°
20.9
2
1.020
25.1
3
1.021
11°
26.4
Site 2
0
1.020
17°
26.4
1
1.022
14°
28.2
3
1.025
10°
31.3
2
31.12
31
1.0038
3
28.17
28
1.0061
0
24.05
24
1.0021
1
15.06
15
1.0040
3
37.81
37
1.0219
Lab 14
66
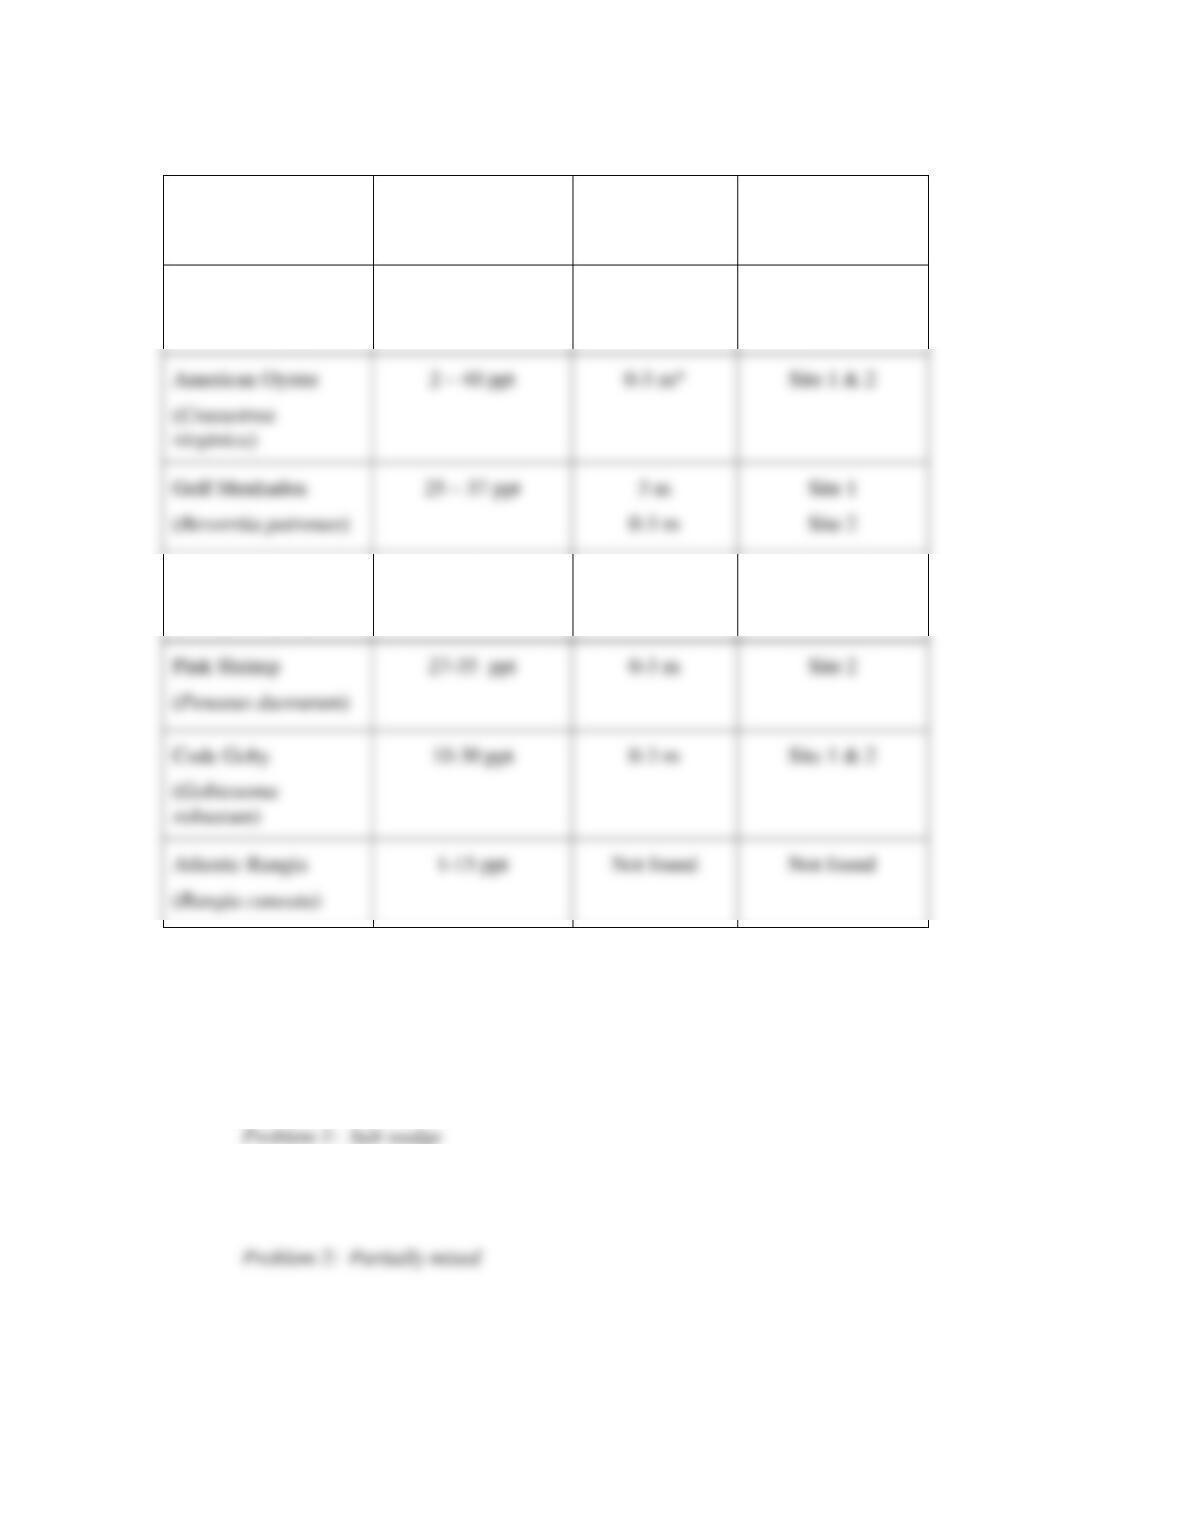
Species Salinity Range Depth Site
Bay Squid
(Lolliguncula brevis)
20-36 ppt
1-3 m
Site 1 &2
Blue crab
(Callinectes sapidus)
23 – 33 ppt
2-3 m*
0-3 m
Site 1
Site 2
Gulf Killifish
(Fundulus grandis)
0 – 45 ppt
0-3 m
Site 1 & 2
(Penaeus duorarum)
27-35 ppt
0-3 m
Atlantic Rangia
Not found
* Because some organisms are benthic as adults and pelagic as juveniles, students will want to ask
if the salinity ranges are for all life stages or just adults. Students will also want to be aware that
salinity is not the only parameter that will determine depth at which an organism can be found.
1. In problem 1 what type estuary is pictured?
2. In problem 2 what type of estuary is pictured?
Gulf Menhaden
(Bevorrtia patronus)
25 – 37 ppt
0-3 m
Site 1
Site 2

Lab 14
67
3. Based on the information given, would you be confident that you could predict where you
would find the organisms listed in the estuary pictured?
Answers will vary but in general, no. There are other life history characteristics