CHAPTER 10 MEIOSIS AND SEXUAL LIFE CYCLES
Scientific Skills Exercise
Teaching objective: Students will identify the independent and dependent variables in a table of
data and graph the data to identify phases of meiosis in a yeast culture. They will also get
practice doing calculations with exponents, such as calculating the haploid genome size for this
species of yeast (Saccharomyces cerevisiae, commonly known as budding yeast).
Teaching tips: A version of this Scientific Skills Exercise can be assigned in MasteringBiology.
This is a basic graphing exercise with time-related data. Students may have difficulty with the
extremely small units femtograms (fg) used for the DNA. A review of metric units will be
helpful to them. If you want your students to have more practice with calculations, you could
extend question 4 by asking questions such as how many base pairs are in a nanogram (ng) or
how many kilobases (kb) are in a femtogram, etc.
Students may question why the line on the graph is not flat for each stage of meiosis. This is
because the data come from a population of cells, and there is some variation among the yeast
cells in their timing of progression through the process. This also explains why the amount of
DNA does not drop instantly at the end of MI and/or MII phase: Not all of the cells divide at
exactly the same time and so the average includes some pre-division cells, some dividing cells,
and some post-division cells for the relevant time points. This subtlety is addressed in question
Students will not be able to precisely delineate each stage on the graph due to the population
variability. Instruct them to approximate based on what they expect for DNA content at each
stage.
Answers:
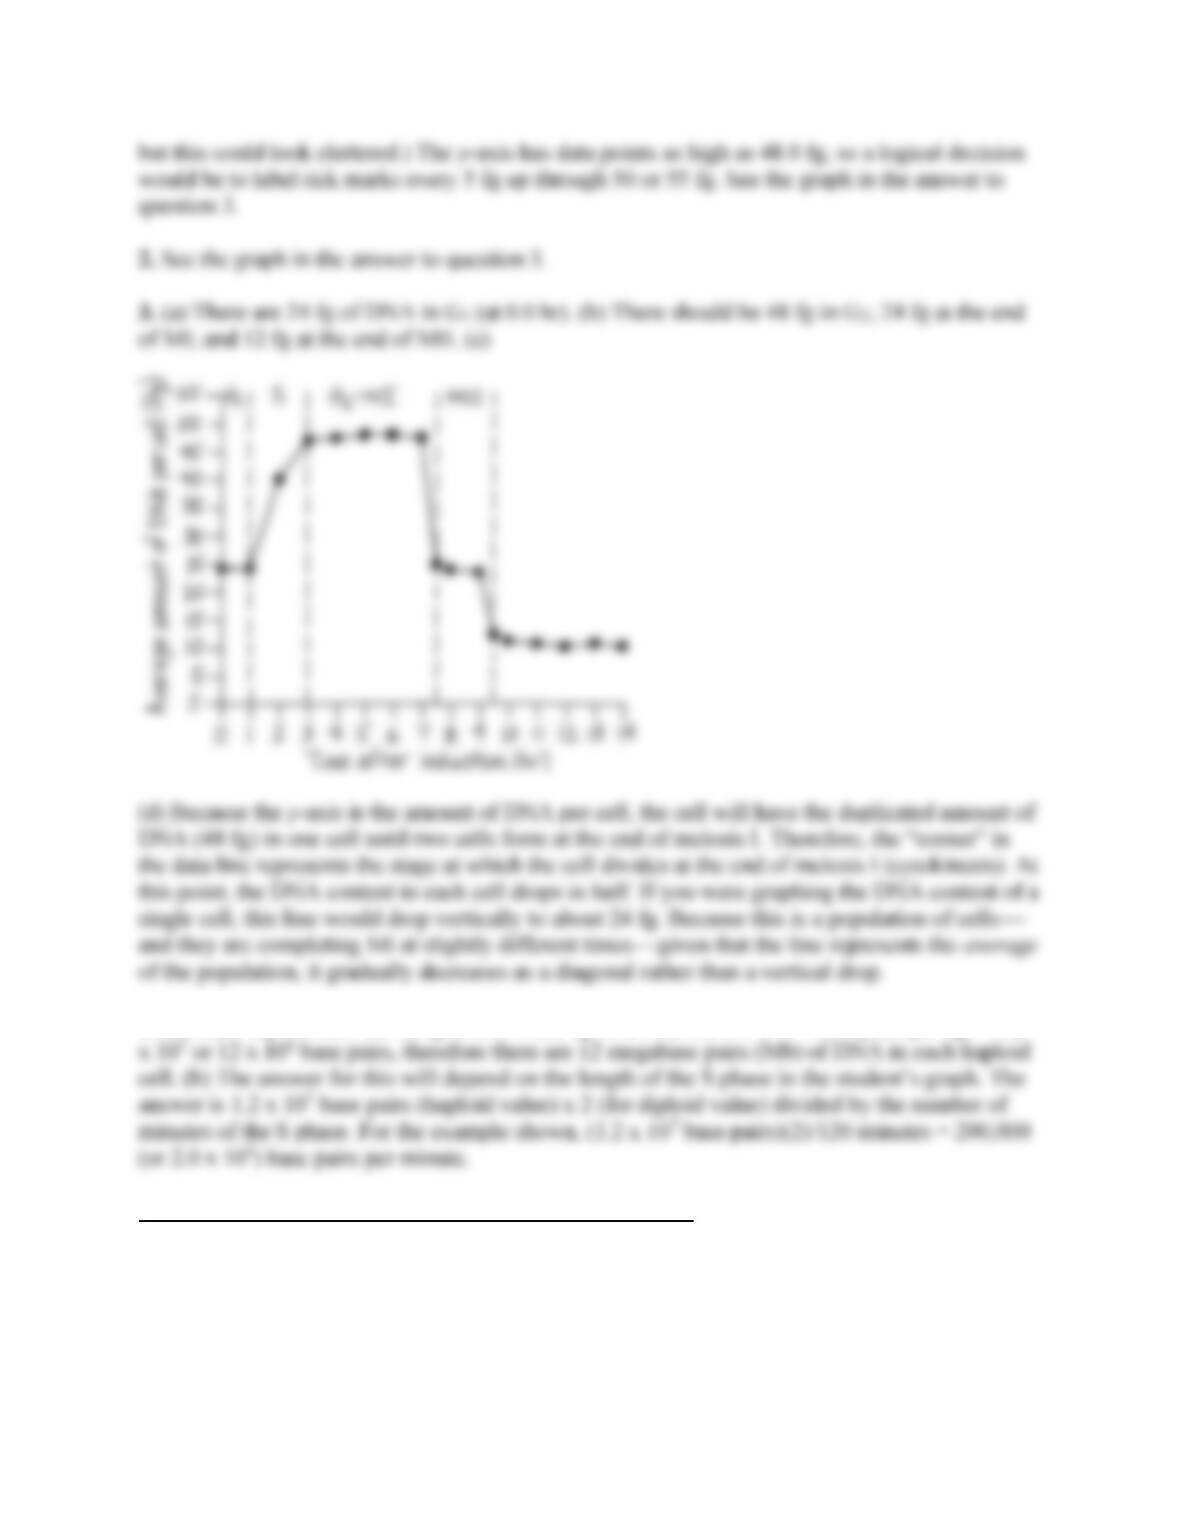
1. (a) The independent variable is time, which goes on the x-axis, measured in hours (hr). The
dependent variable is average amount of DNA per cell, which goes on the y-axis and is measured
4. (a) Each haploid cell has 12 fg of DNA. (12 fg of DNA) x (9.78 x 10⁵ base pairs per fg) = 1.2
Suggested Answers for End-of-Chapter Essay Questions
See the general information on grading short-answer essays and a suggested rubric at the
beginning of this document.
7. Scientific Inquiry
The alleles for freckles or no freckles are on all four chromatids at the F locus, and those for
s on the red chromatids are for
freckles and black hair and the alleles on the blue chromatids are for no freckles and blond hair.
By drawing the chromatids, you can follow the alleles through meiosis. The chromatids that did
not participate in crossovers will donate either freckles and black hair alleles or no freckles and
8. Focus on Evolution
When the environment becomes unfavorable, this means it is unfavorable for a particular
genotype or genome that had been successfully adapted to the previous environment. At such
9. Focus on Information
Sample key points:
Genes are stretches of DNA in chromosomes that encode traits and are passed on from parent
to offspring.
Chromosome behavior during sexual reproduction accounts for both similarity and variation
among offspring.
Sample top-scoring answer:
Genes encoding traits exist as stretches of the DNA molecule in a chromosome. Chromosome
behavior during meiosis and fertilization processes that alternate in sexual reproduction
accounts for both the inheritance of traits and the generation of genetic variation. Meiosis in each
10. Synthesize Your Knowledge
With three sets of chromosomes, there is no way for the sets to be separated equally to gametes
during meiosis, and so seeds (which are embryos formed after meiosis and fertilization) cannot
form. Thus, taking cuttings from the plants and rooting them is the only way new plants can be