
Chapter 8
Fundamentals of Capital Budgeting
I. Chapter Outline
The following chapter outline is correlated to the PowerPoint Lecture Slides. The PowerPoint slides
are referenced in bold. Alternative Examples to selected textbook examples are also available in the
PowerPoint Lecture Slides and are also referenced in bold.
8.1 Forecasting Earnings (Slide 6)
• Revenue and Cost Estimates (Slides 7–8)
• Incremental Earnings Forecast (Slide 9)
– Capital Expenditures and Depreciation (Slide 10)
• Table 8.1 HomeNet’s Incremental Earnings Forecast
– Interest Expenses (Slide 11)
– Taxes (Slide 12)
– Unlevered Net Income Calculation (Slide 13)
• Example 8.1 Taxing Losses for Projects in Profitable Companies (Slides 14–15)
• PowerPoint Alternative Example 8.1 (Slides 16–18)
• Indirect Effects on Incremental Earnings (Slide 19)
– Opportunity Costs
• Example 8.2 The Opportunity Cost of HomeNet’s Lab Space (Slides 20–21)
• PowerPoint Alternative Example 8.2 (Slides 22–23)
• Common Mistake: The Opportunity Cost of an Idle Asset
– Project Externalities (Slides 24–25)
• Table 8.2 HomeNet’s Incremental Earnings Forecast (Including Cannibalization and Lost
Rent) (Slide 26)
• Sunk Costs and Incremental Earnings (Slides 27–30)
– Fixed Overhead Expenses (Slide 28)
– Past Research and Development Expenditures (Slide 29)
– Unavoidable Competitive Effects (Slide 30)
• Common Mistake: The Sunk Cost Fallacy
• Real-World Complexities (Slide 31)
• Example 8.3 Product Adoption and Price Changes (Slides 32–33)
8.2 Determining Free Cash Flow and NPV (Slide 34)
• Calculating the Free Cash Flow from Earnings (Slides 35–38)
– Capital Expenditures and Depreciation (Slides 35–36)
• Table 8.3 Calculation of HomeNet’s Free Cash Flow (Including Cannibalization and Lost
Rent)
– Net Working Capital (NWC) (Slides 37-38)
©2017 Pearson Education, Ltd.
8.3 Choosing Among Alternatives (Slides 45–50)
• Evaluating Manufacturing Alternatives (Slides 46–49)
• Table 8.6 NPV Cost of Outsourced Versus In-House Assembly of HomeNet
• Comparing Free Cash Flows for Cisco’s Alternatives (Slide 50)
8.4 Further Adjustments to Free Cash Flow (Slide 51)
– Other Non-Cash Items (Slide 51)
– Timing of Cash Flows (Slide 51)
– Accelerated Depreciation (Slide 51)
• Example 8.5 Computing Accelerated Depreciation (Slides 52–53)
• PowerPoint Alternative Example 8.5 (Slides 54–55)
– Liquidation or Salvage Value (Slide 56)
• Example 8.6 Adding Salvage Value to Free Cash Flow (Slides 57–58)
• PowerPoint Alternative Example 8.6 (Slides 59–61)
– Terminal or Continuation Value (Slide 62)
• Global Financial Crisis: The American Recovery and Reinvestment Act of 2009
8.5 Analyzing the Project (Slides 71-)
• Break-Even Analysis (Slides 71–72)
• Table 8.7 HomeNet IRR Calculation (Slide 71)
• Table 8.8 Break-Even Levels for HomeNet (Slide 72)
• Sensitivity Analysis (Slide 73)
• Table 8.9 Best- and Worst-Case Parameter Assumptions for HomeNet (Slide 74)
• Figure 8.1 HomeNet’s NPV Under Best– and Worst-Case Parameter Assumptions (Slide 75)
• Example 8.9 Sensitivity to Marketing and Support Costs (Slides 76–77)
Chapter 8 Appendix MACRS Depreciation (Slide 88)
32 Berk/DeMarzo • Corporate Finance, Fourth Edition, Global Edition
II. Learning Objectives
8.1 Given a set of facts, identify relevant cash flows for a capital budgeting problem.
8.3 Calculate taxes that must be paid, including tax loss carryforwards and carrybacks.
8.5 Illustrate the impact of depreciation expense on cash flows.
8.7 Use breakeven analysis, sensitivity analysis, or scenario analysis to evaluate project risk.
III. Chapter Overview
Chapter 7 described the use of NPV (and some other tools) to make investment decisions. Chapter 8
demonstrates how to derive the cash flows for a given project in order to determine which projects or
investments a firm should undertake.
8.1 Forecasting Earnings
The chapter teaches the concept of forecasting earnings by considering a hypothetical capital
budgeting decision faced by managers of the Linksys division of Cisco. The project is called
HomeNet. The issues addressed are summarized here:
• The company has already conducted a feasibility study, which cost $300,000.
• The lab equipment will be depreciated straight line over a five-year period.
• The marginal corporate tax rate is 40%.
The net income from the project is in Table 8.1 Spreadsheet. Following are additional issues
addressed in this section of the chapter:
• Interest income is not included—the investment decision is separate from the financing
©2017 Pearson Education, Ltd.
Table 8.1 shows the incremental earnings forecast for the HomeNet project. Table 8.2 includes
cannibalization and lost rent.
8.2 Determining Free Cash Flow and NPV
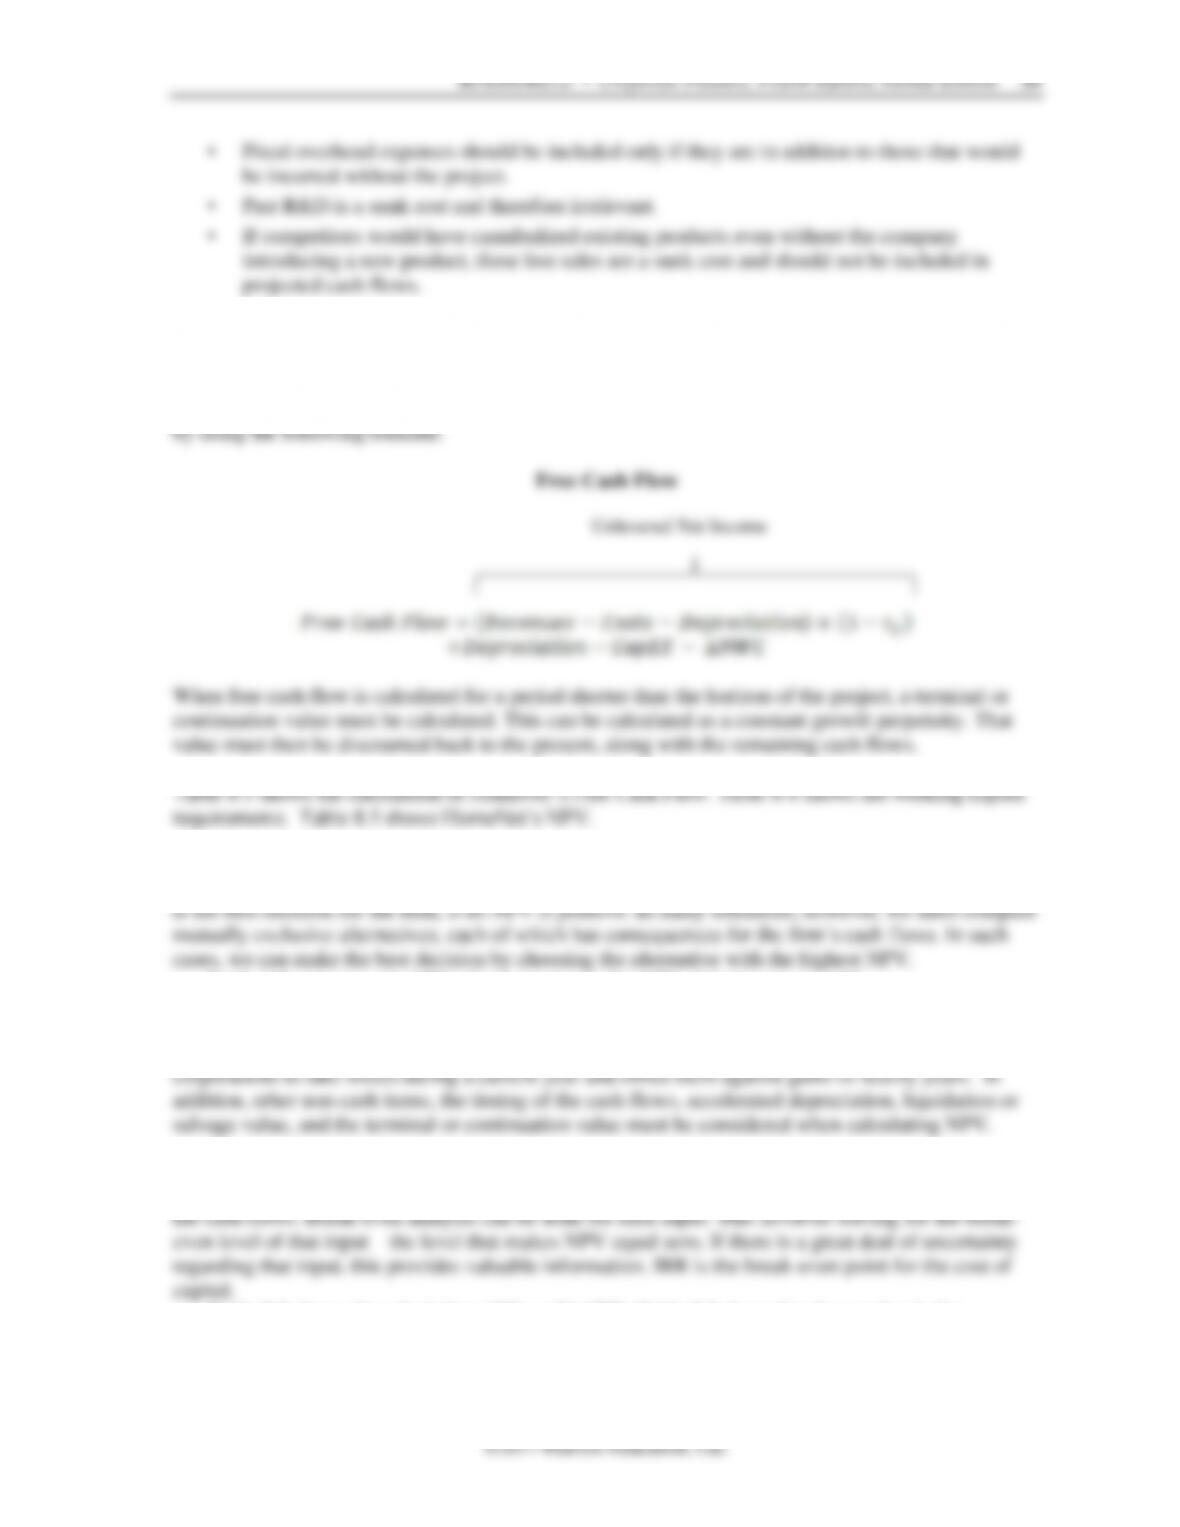
This section shows how to convert net income to free cash flow. Free cash flow is calculated directly
8.3 Choosing Among Alternatives
Because not launching a project produces an additional NPV of zero for the firm, launching a project
Table 8.6 compares the NPV of outsourcing to the NPV of in-house assembly.
8.4 Further Adjustments to Free Cash Flow
We must also consider tax carryforwards and carrybacks when calculating NPV, which allow
8.5 Analyzing the Project
Finally, several tools are available to analyze the project’s sensitivity to assumptions used in deriving
Table 8.7 shows the calculation of HomeNet IRR. Table 8.8 shows break-even levels for
HomeNet in terms of units sold, wholesale price, cost of goods, and cost of capital. Figure 8.1 shows
34 Berk/DeMarzo • Corporate Finance, Fourth Edition, Global Edition
the range of NPVs in sensitivity analysis. Table 8.10 shows scenario analysis changing price and
units sold.
Chapter 8 Appendix MACRS Depreciation
This appendix shows the way in which an asset is categorized into a recovery class and the
calculation of depreciation using MACRS.
IV. Spreadsheet Solutions in Excel
The following Problems for Chapter 8 have spreadsheet versions of the problems available: 5, 7, 10,
11, 13, 14, 15, 22, 24, and 25.
These spreadsheets can be downloaded from the Instructor’s Resource Center at: