
Chapter 6
ANSWERS TO QUESTIONS
1. If junk bonds are “junk,” then why do investors buy them?
Junk bonds are referred to as “junk” in that they are very risky investments, but provide high
2. Which should have the higher risk premium on its interest rates, a corporate bond with a
Moody’s Baa rating or a corporate bond with a C rating? Why?
The bond with a C rating should have a higher interest rate because it has a higher default
3. Do you think that a U.S. Treasury bill will have a risk premium that is higher than, lower
than, or the same as that of a similar security (in terms of maturity and liquidity) issued by
the government of Colombia?
U.S. government issued securities are usually considered to be default free. However,
4. In the fall of 2008, AIG, the largest insurance company in the world at the time, was at risk
of defaulting due to the severity of the global financial crisis. As a result, the U.S.
government stepped in to support AIG with large capital injections and an ownership stake.
How would this affect, if at all, the yield and risk premium on AIG corporate debt?
The risk of default would significantly decrease demand for AIG corporate debt, resulting in
a much higher yield. After the announcement that the government would provide
5. Risk premiums on corporate bonds are usually anticyclical; that is, they decrease during
business cycle expansions and increase during recessions. Why is this so?
During business cycle booms, fewer corporations go bankrupt and there is less default risk on

6. Just before the collapse of the subprime mortgage market in 2007, the most important credit-
rating agencies rated mortgage-backed securities with Aaa and AAA ratings. Explain how it
was possible that a few months into 2008, the same securities had the lowest possible ratings.
Should we always trust credit-rating agencies?
Historically, mortgage-backed securities were considered low-risk assets, since homeowners
had the highest incentives to pay their mortgages (otherwise they might lose their home).
However, after standards on lending practices decreased during the first years of the new
7. What is a key function of credit-rating agencies? Do credit-rating agencies always provide
reliable information? What was the role of credit-rating agencies in the sub-prime crisis of
2008?
A key function of credit-rating agencies (CRAs) is to provide professional information about the
quality of securities. Credit rating plays a crucial role for supervisory purposes. However, they do
not always provide the most reliable information. For instance, during the financial crisis, the role of
8. Predict what will happen to interest rates on a corporation’s bonds if the federal government
guarantees today that it will pay creditors if the corporation goes bankrupt in the future.
What will happen to the interest rates on Treasury securities?
The government guarantee will reduce the default risk on corporate bonds, making them
more desirable relative to Treasury securities. The increased demand for corporate bonds and
9. Predict what would happen to the risk premiums of municipal bonds if the federal
government guarantees today that it will pay creditors if municipal governments default on
their payments. Do you think that it will then make sense for municipal bonds to be exempt
from income taxes?
If the federal government decides to guarantee payments on all municipal bonds, then these
bonds will effectively be default free. This characteristic will make them very desirable
assets, increasing their demand and thereby lowering their interest rates. If this were to

10. During 2008, the difference in yield (the yield spread) between three-month AA-rated
financial commercial paper and three-month AA-rated nonfinancial commercial paper
steadily increased from its usual level of close to zero, spiking to over a full percentage point
at its peak in October 2008. What explains this sudden increase?
The global financial crisis hit financial companies very suddenly and very hard, creating
much uncertainty about the soundness of the financial system, and doubt about the soundness
11. If the income tax exemption on municipal bonds were abolished, what would happen to the
interest rates on these bonds? What effect would the change have on interest rates on U.S.
Treasury securities?
Abolishing the tax-exempt feature of municipal bonds would make them less desirable
relative to Treasury bonds. The resulting decline in the demand for municipal bonds and
12. Prior to 2008, mortgage lenders required a house inspection to assess a home’s value, and
often used the same one or two inspection companies in the same geographical market.
Following the collapse of the housing market in 2008, mortgage lenders required a house
inspection, but this inspection was arranged through a third party. How does the pre-2008
scenario illustrate a conflict of interest similar to the role that credit-rating agencies played
in the global financial crisis?
Credit rating agencies had a conflict of interest that was said to contribute to the crisis in that
the rating agencies had an incentive to provide overly optimistic ratings to clients whom they
also advised. Similarly, the way in which lenders and the house inspection process occurred
13. “According to the expectations theory of the term structure, it is better to invest in one-year
bonds, reinvested over two years, than to invest in a two-year bond if interest rates on one-
year bonds are expected to be the same in both years.” Is this statement true, false, or
uncertain?

False. The expectations theory of the term structure implies that, with a $1 investment in one-
period bonds over two years, the expected return is given as
+e
ii
which equals 2it assuming
14. If bond investors decide that 30-year bonds are no longer as desirable an investment as they
were previously, predict what will happen to the yield curve, assuming (a) the expectations
theory of the term structure holds and (b) the segmented markets theory of the term structure
holds.
(a) Under the expectations theory of the term structure, if 30-year bonds become less desirable,
this will increase the demand for bonds of other maturities, since they are viewed as perfect
substitutes. The result is a higher price and a lower yield at all other maturities, and an
increase in yield at the end of the yield curve. In other words, the yield curve would steepen
15. Suppose the interest rates on one-, five-, and ten-year US Treasury bonds are currently 3%,
6%, and 6%, respectively. Investor A chooses to hold only one-year bonds, and Investor B is
indifferent with regard to holding five- and ten-year bonds. How can you explain the
behavior of Investors A and B?
Investor A, even though she receives a lower expected return, clearly prefers to hold short-
term debt, perhaps because it is more liquid. Investor A’s preferences are consistent with the
segmented markets theory. Investor B is apparently maximizing expected return, but since he
16. If a yield curve looks like the one shown in the figure below, what is the market predicting
about the movement of future short-term interest rates? What might the yield curve indicate
about the market’s predictions for the inflation rate in the future?
The flat yield curve at shorter maturities suggests that short-term interest rates are expected
to fall moderately in the near future, while the steep upward slope of the yield curve at longer
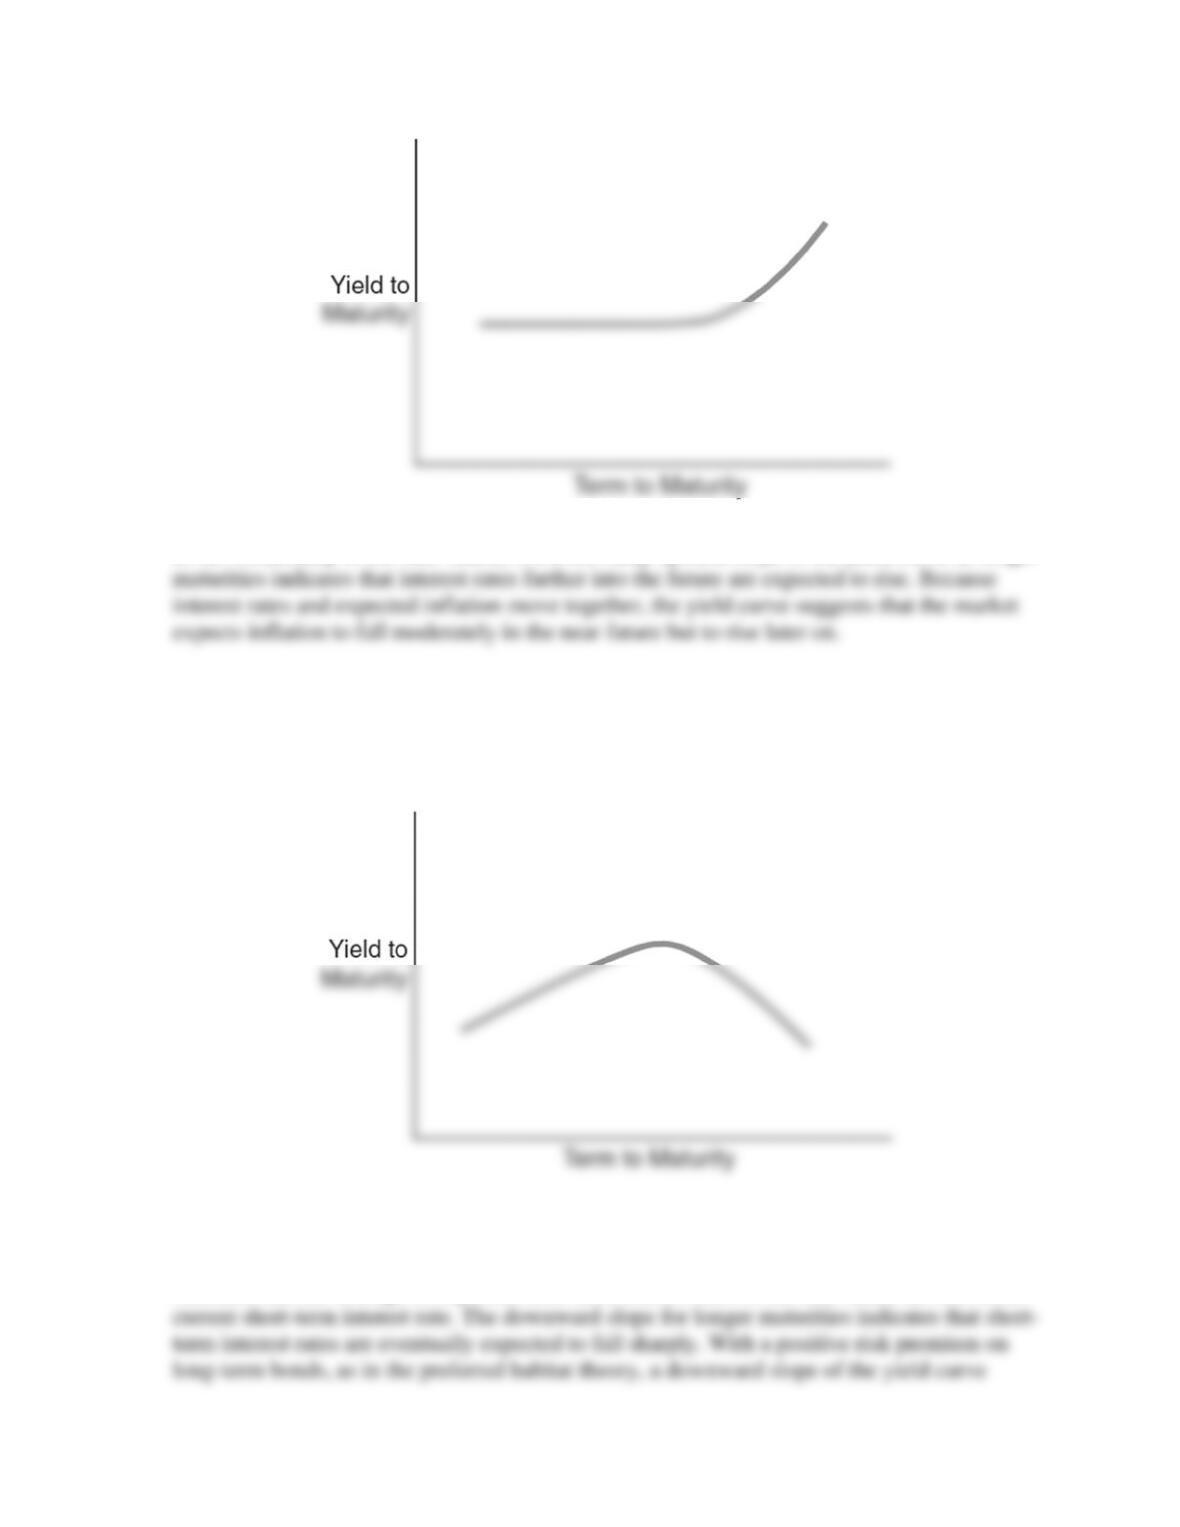
17. If a yield curve looks like the one shown in the figure below, what is the market predicting
about the movement of future short-term interest rates? What might the yield curve indicate
about the market’s predictions for the inflation rate in the future?
The steep upward-sloping yield curve at shorter maturities suggests that short-term interest
rates are expected to rise moderately in the near future because the initial, steep upward slope
indicates that the average of expected short-term interest rates in the near future are above the

18. If yield curves, on average, were flat, what would this say about the liquidity (term)
premiums in the term structure? Would you be more or less willing to accept the expectations
theory?
If yield curves on average were flat, this would suggest that the risk premium on long-term
19. If the yield curve suddenly became steeper, how would you revise your predictions of interest
rates in the future?
You would raise your predictions of future interest rates, because the higher long-term rates
20. If expectations of future short-term interest rates suddenly fell, what would happen to the
slope of the yield curve?
The slope of the yield curve would fall because the drop in expected future short rates means
21. Following a policy meeting on March 19, 2009, the Federal Reserve made an announcement
that it would purchase up to $300 billion of longer-term Treasury securities over the following
six months. What effect might this policy have on the yield curve?
If the Federal Reserve purchases a significant amount of longer-term treasury debt, this will
reduce the effective supply of treasuries of those particular maturities, resulting in a higher
ANSWERS TO APPLIED PROBLEMS
22. In 2010 and 2011, the government of Greece risked defaulting on its debt due to a severe
budget crisis. Using bond market graphs, compare the effects on the risk premium between
U.S. Treasury debt and comparable-maturity Greek debt.
As the risk of default by the Greek government increased, this reduced the demand for Greek

23. Assuming the expectations theory is the correct theory of the term structure, calculate the
interest rates in the term structure for maturities of one to four years, and plot the resulting
yield curves for the following paths of one-year interest rates over the next four years:
a. 4%, 6%, 11%, 15%
b. 3%, 5%, 13%, 15%
How would your yield curves change if people preferred shorter-term bonds to longer-term
bonds?
(a) The yield to maturity would be 4% for a one-year bond, 5% for a two-year bond, 7% for
24. Assuming the expectations theory is the correct theory of the term structure, calculate the
interest rates in the term structure for maturities of one to four years, and plot the resulting
yield curves for the following paths of one-year interest rates over the next four years:
a. 5%, 7%, 12%, 12%
b. 7%, 5%, 3%, 5%
How would your yield curves change if people preferred shorter-term bonds to longer-term
bonds?
(a) The yield to maturity would be 5% for a one-year bond, 6% for a two-year bond, 8% for a
three-year bond, and 9% for a four-year bond; (b) the yield to maturity would be 7% for a
one-year bond, 6% for a two-year bond, 5% for a three-year bond, and 5% for a four-year

25. The table below shows current and expected future one-year interest rates, as well as current
interest rates on multiyear bonds. Use the table to calculate the liquidity premium for each
multiyear bond.
Year
One-Year
Bond Rate
Multiyear
Bond Rate
1
2%
2%
2
4%
4%
3
5%
6%
4
8%
9%
5
The liquidity premium for a given year is the current rate on a multiyear horizon bond minus
the average of expected one-year interest rates over that horizon. Thus, the liquidity
premiums for each year are given as:
l11 = 2 – 2/1 = 0%.
l21 = 4 – (4 + 2)/2 = 1%.
ANSWERS TO DATA ANALYSIS PROBLEMS
1. Go to the St. Louis Federal Reserve FRED database and find data on Moody’s Aaa
corporate bond yield (AAA) and Moody’s Baa corporate bond yield (BAA). Download the
data into a spreadsheet.
a. Calculate the spread (difference) between the Baa and Aaa corporate bond yields for the
most recent month of data available. What does this difference represent?
b. Calculate the spread again, for the same month but one year prior, and compare the
result to your answer to part (a). What do your answers say about how the risk premium
has changed over the past year?
One year prior in June 2016, the Baa yield was 4.53% and the Aaa yield was 3.50%,
c. Identify the month of highest and lowest spreads since the beginning of the year 2000.
How do these spreads compare to the most current spread data available? Interpret the
results.
Since the year 2000, the highest credit spread occurred in December 2008, at 3.38
percentage points, and the lowest occurred in January 2000 at 0.55 percentage points. The
2. Go to the St. Louis Federal Reserve FRED database, and find daily yield data on the
following U.S. treasuries securities: one-month (DGS1MO), three-month (DGS3MO), six-
month (DGS6MO), one-year (DGS1), two-year (DGS2), three-year (DGS3), five-year
(DGS5), seven-year (DGS7), 10-year (DGS10), 20-year (DGS20), and 30-year (DGS30).
Download the last full year of data available into a spreadsheet.
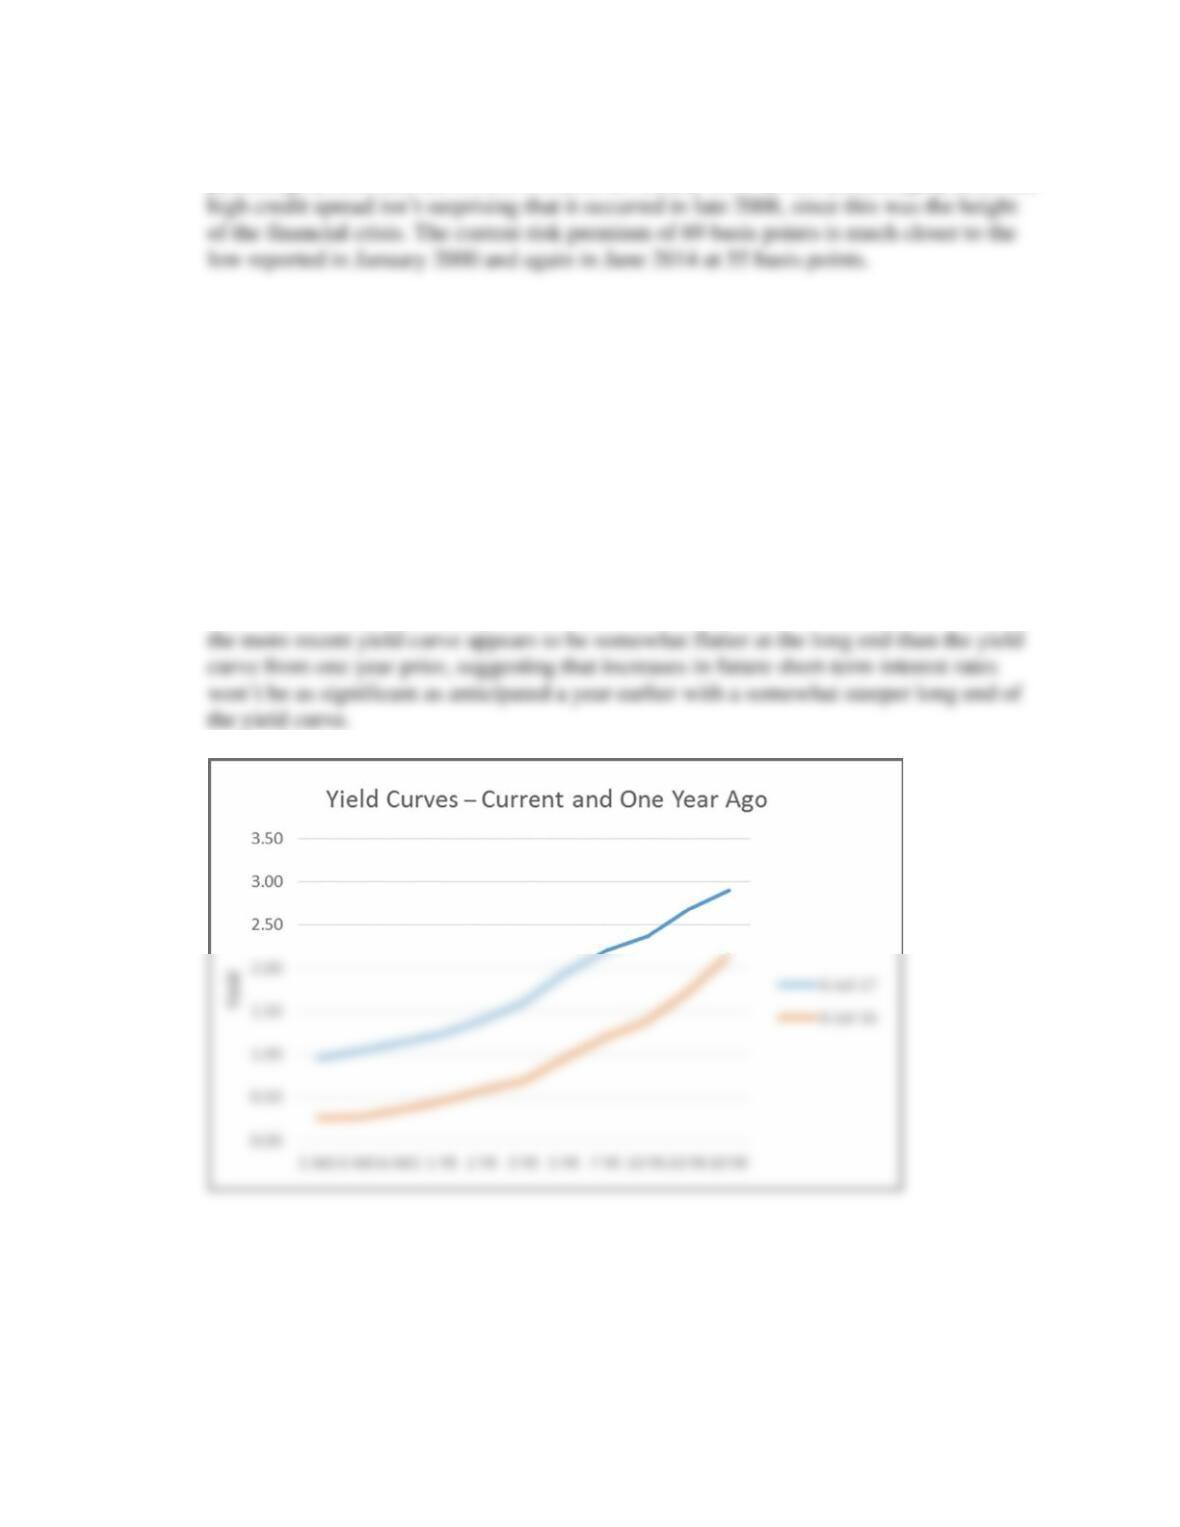
a. Construct a yield curve by creating a line graph for the most recent day of data
available, and for the same day (or as close to the same day as possible) one year prior,
across all the maturities. How do the yield curves compare? What does the changing
slope say about potential changes in economic conditions?
The yield curve is shown below, for July 6, 2017, and July 6, 2016. In general, the more
recent yield curve is shifted up across most maturities by about 75 basis points. However,
b. Determine the date of the most recent Federal Open Market Committee policy statement.
Construct yield curves for both the day before the policy statement was released and the
day on which the policy statement was released. Was there any significant change in the
yield curve as a result of the policy statement? How might this be explained?
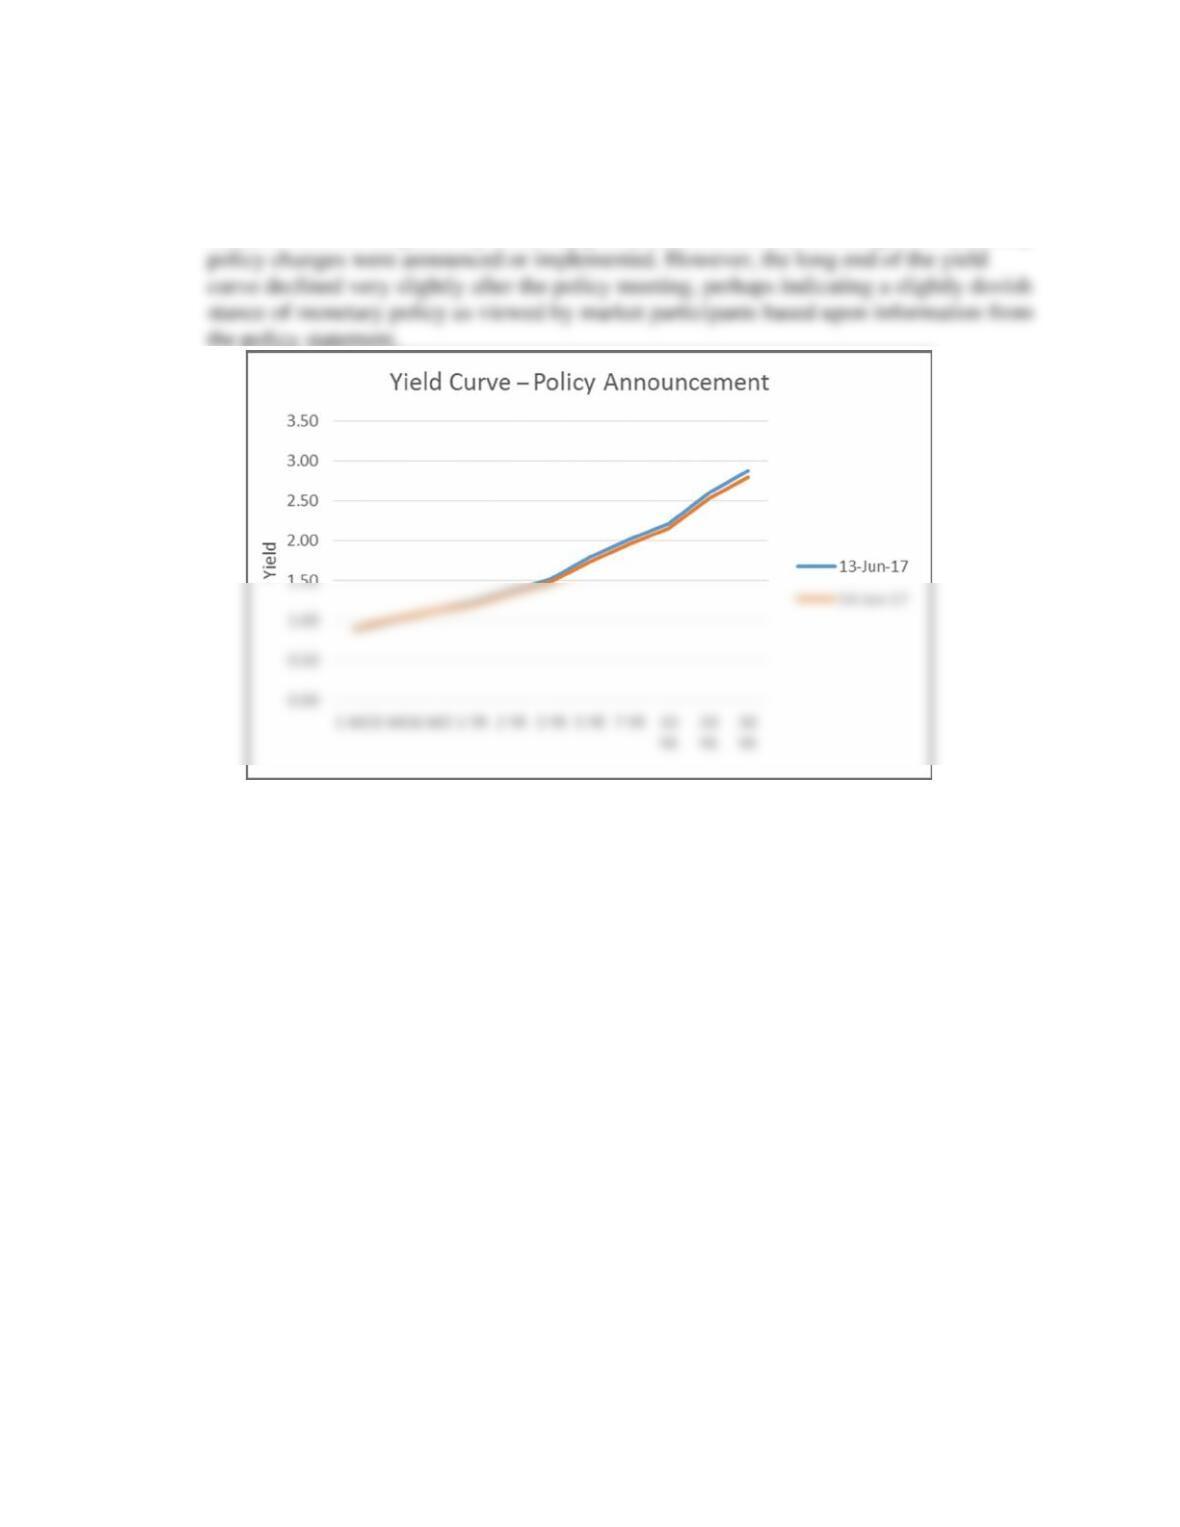
The most recent FOMC meeting policy statement occurred on June 14, 2017. The yield
curve below shows yields for the end of trading day on that day, and the day prior. There
is very little change between the two yield curves, indicating that for the most part,
markets were not surprised by monetary policy actions, and that no unexpected monetary
the policy statement.