Chapter 5
ANSWERS TO QUESTIONS
1. Explain why you would be more or less willing to buy a share of Microsoft stock in the
following situations:
a. Your wealth falls.
Less, because your wealth has declined
b. You expect the stock to appreciate in value.
More, because its relative expected return has risen
2. Explain why you would be more or less willing to buy a house under the following
circumstances:
a. You just inherited $100,000.
More, because your wealth has increased
b. Real estate commissions fall from 6% of the sales price to 5% of the sales price.
More, because the house has become more liquid
3. Explain why you would be more or less willing to buy gold under the following
circumstances:
a. Gold again becomes acceptable as a medium of exchange.
More, because it has become more liquid
4. Explain why you would be more or less willing to buy long-term Delta Air Lines bonds under
the following circumstances:
a. The company just released its financial statements, indicating that income decreased and
liabilities increased.
Less, because owning the company’s bonds has become riskier
b. You expect a bull market in stocks (stock prices are expected to increase).
Less, because their expected return has fallen relative to stocks
5. What will happen to the demand for Rembrandt paintings if the stock market undergoes a
boom? Why?
6. Raphael observes that at the current level of interest rates there is an excess supply of bonds
and therefore he anticipates an increase in the price of bonds. Is Raphael correct?
Raphael is incorrect. If at the current level of interest rates there is an excess supply of bonds,
the supply and demand analyses tells us that interest rates will increase, creating a movement
7. Suppose Maria prefers to buy a bond with a 7% expected return and 2% standard deviation
of its expected return, while Jennifer prefers to buy a bond with a 4% expected return and
1% standard deviation of its expected return. Can you tell if Maria is more or less risk-
averse than Jennifer?
Maria is choosing a bond with higher standard deviation, but also with higher expected return
than Jennifer. In order to decide whether Maria or Jennifer is more risk averse, one will need
to compare two bonds with the same expected return and different standard deviations of
8. What will happen in the bond market if the government imposes a limit on the amount of
daily transactions? Which characteristic of an asset would be affected?
If the government imposes a limit on the amount of daily transactions in the bond market,
then bonds will become less liquid with respect to alternative assets. Such a regulation will
9. How might a sudden increase in people’s expectations of future real estate prices affect
interest rates?
Interest rates would rise. A sudden increase in people’s expectations of future real estate
prices raises the expected return on real estate relative to bonds, so the demand for bonds
10. Suppose that many big corporations decide not to issue bonds, since it is now too costly to
comply with new financial market regulations. Can you describe the expected effect on
interest rates?
If many big corporations decide not to issue bonds because of new financial markets
regulations, this will affect the supply curve. The impact will translate into a shift to the left
11. In the aftermath of the global economic crisis that started to take hold in 2008, U.S.
government budget deficits increased dramatically, yet interest rates on U.S. Treasury debt fell
sharply and stayed low for quite some time. Does this make sense? Why or why not?
Given the answer to question 10 above, the supply effect of large deficits should lead to higher
12. Will there be an effect on interest rates if brokerage commissions on stocks fall? Explain
your answer.
13. The president of the United States announces in a press conference that he will fight the higher
inflation rate with a new anti-inflation program. Predict what will happen to interest rates if
the public believes him.
If the public believes the president’s program will be successful, interest rates will fall. The
president’s announcement will lower expected inflation so that the expected return on goods
decreases relative to bonds. The demand for bonds increases and the demand curve, Bd, shifts
14. Suppose that people in France decide to permanently increase their savings rate. Predict
what will happen to the French bond market in the future. Can France expect higher or
lower domestic interest rates?
If people in France decide to permanently increase their savings rate, then more wealth will
be accumulated over the years. This increase in wealth determines that more bonds will be
15. Suppose you are in charge of the financial department of your company and you have to
decide whether to borrow short or long term. Checking the news, you realize that the
government is about to engage in a major infrastructure plan in the near future. Predict what
will happen to interest rates. Will you advise borrowing short or long term?
If the government is planning to fund a major infrastructure plan, it will need to get funds,
16. Would fiscal policymakers ever have reason to worry about potentially inflationary
conditions? Why or why not?
Yes, fiscal policymakers should worry about potentially inflationary conditions. If people
17. Why should a rise in the price level (but not in expected inflation) cause interest rates to rise
when the nominal money supply is fixed?
When the price level rises, the quantity of money in real terms falls (holding the nominal
supply of money constant); to restore their holdings of money in real terms to their former
18. If the next chair of the Federal Reserve Board has a reputation for advocating an even
slower rate of money growth than the current chair, what will happen to interest rates?
Discuss the possible resulting situations.
Slower rate of money growth will lead to a liquidity effect, which raises interest rates, while
the lower price level, income, and inflation rates in the future will tend to lower interest rates.
There are three possible scenarios for what will happen: (a) if the liquidity effect is larger
19. M1 money growth in the U.S. was about 15% in 2011 and 2012, and 10% in 2013. Over the
same time period, the yield on 3-month Treasury bills was close to 0%. Given these high
rates of money growth, why did interest rates stay so low, rather than increase? What does
this say about the income, price-level, and expected-inflation effects?
With unusually high rates of money growth, this should lead to higher expected inflation, a
jump in the overall price level, and stronger economic growth. These factors should all result
ANSWERS TO APPLIED PROBLEMS
20. Suppose you visit with a financial adviser, and you are considering investing some of your
wealth in one of three investment portfolios: stocks, bonds, or commodities. Your financial
adviser provides you with the following table, which gives the probabilities of possible
returns from each investment.
Stocks
Bonds
Commodities
Probability
Return
Probability
Return
Probability
Return
0.2
15%
0.4
15%
0.2
20%
0.3
8.3%
0.6
5%
0.25
12%
0.2
10%
0.25
6%
0.3
5%
0.2
5%
a. Which investment should you choose to maximize your expected return: stocks, bonds, or
commodities?
The expected return on the stock portfolio is 0.20(15%) + 0.30(8.3%) + 0.20(10%) +
0.30(5%) = 8.99%. The expected return on the bond portfolio is 0.4(15%) + 0.6(5%) = 9%.
b. If you are risk-averse and had to choose between the stock and the bond investments,
which would you choose? Why?
21. An important way in which the Federal Reserve decreases the money supply is by selling
bonds to the public. Using a supply and demand analysis for bonds, show what effect this
action has on interest rates. Is your answer consistent with what you would expect to find
with the liquidity preference framework?
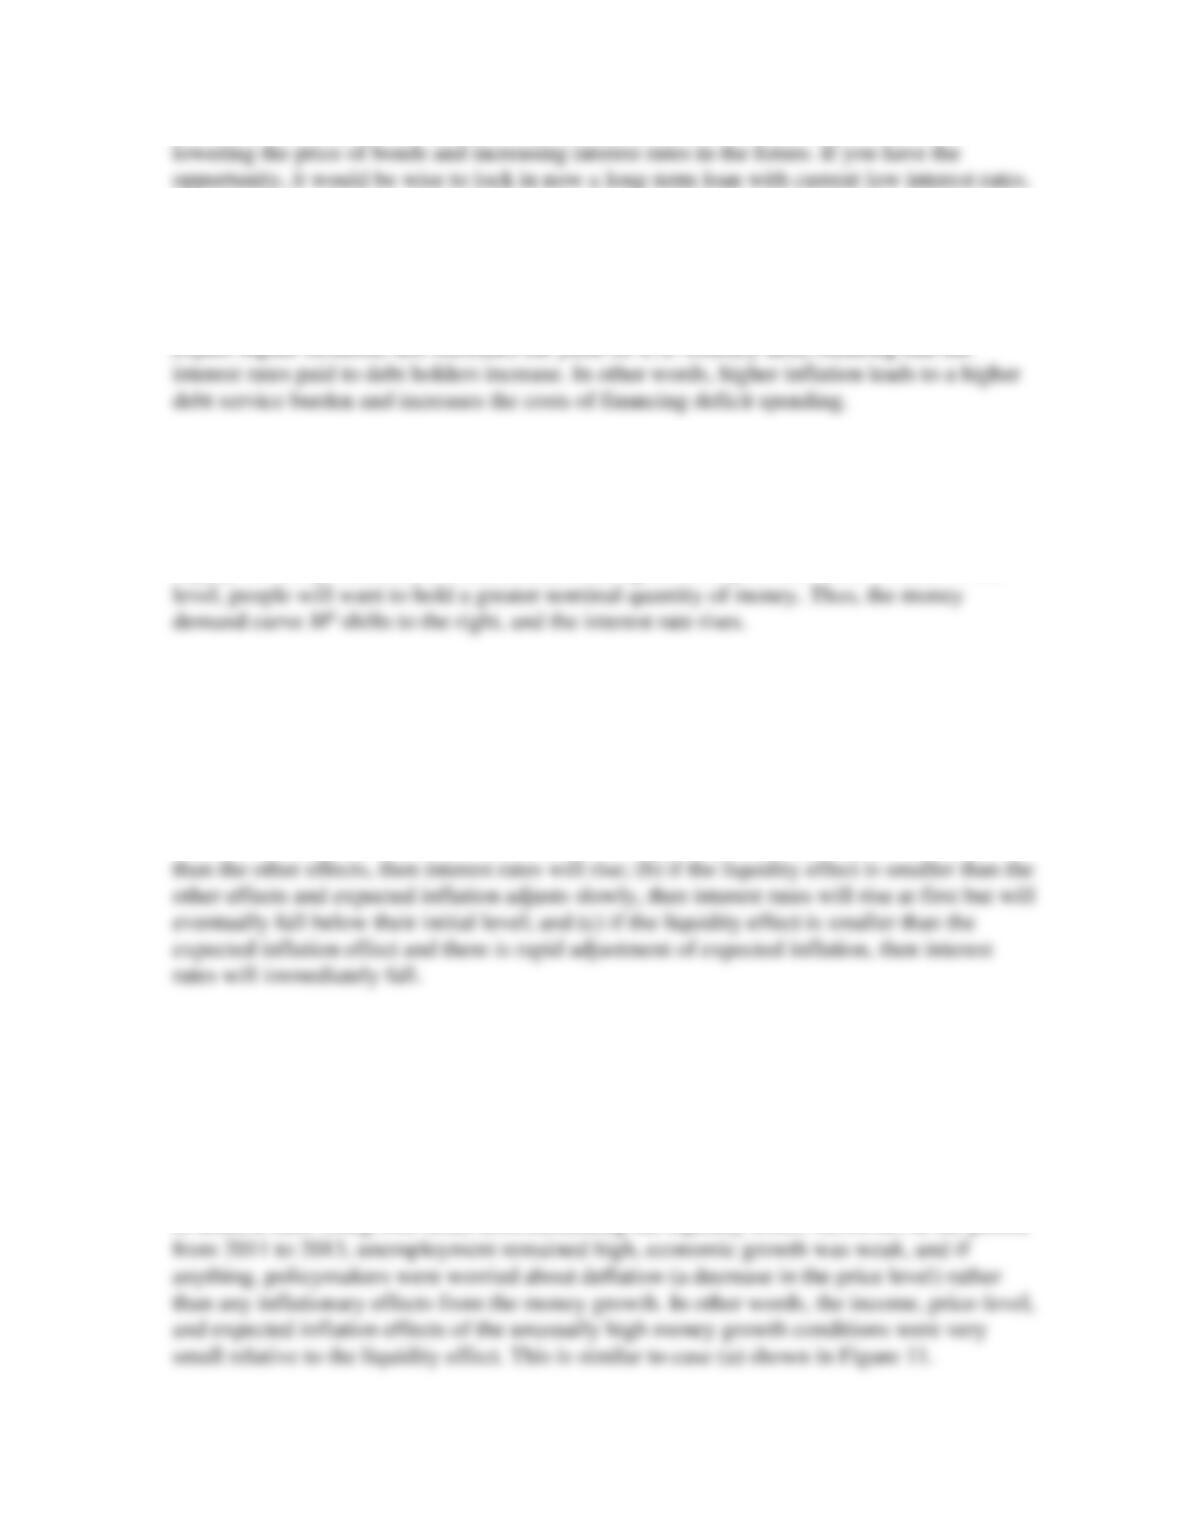
When the Fed sells bonds to the public, it increases the supply of bonds, thus shifting the
supply curve Bs to the right. The result is that the intersection of the supply and demand
curves Bs and Bd occurs at a lower price and a higher equilibrium interest rate, and the
22. Using both the liquidity preference framework and the supply and demand for bonds
framework, show why interest rates are procyclical (rising when the economy is expanding
and falling during recessions).
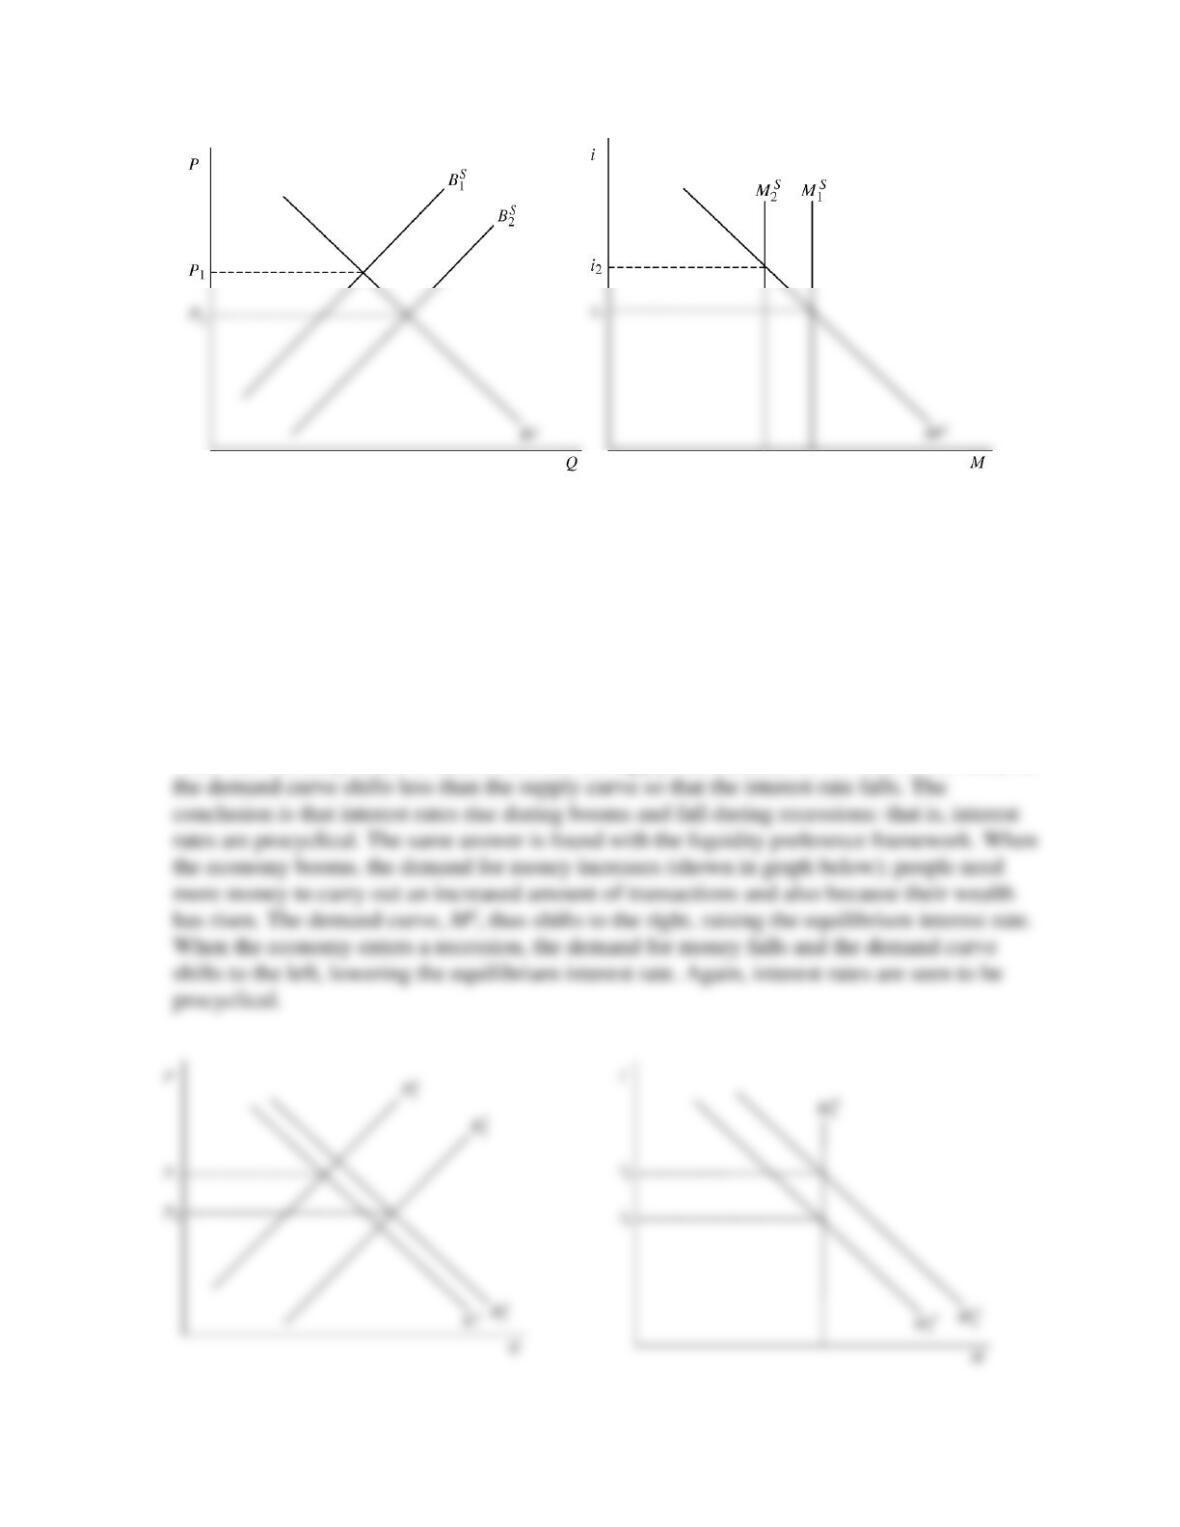
In the bond framework, when the economy booms, the demand for bonds increases. The
public’s income and wealth rises while the supply of bonds also increases, because firms
have more attractive investment opportunities. Both the supply and demand curves (Bd and
Bs) shift to the right (shown in graph below), but as is indicated in the text, the demand curve
probably shifts less than the supply curve so the equilibrium interest rate rises. Similarly,
when the economy enters a recession, both the supply and demand curves shift to the left, but
23. Using both the supply and demand for bonds and liquidity preference frameworks, show how
interest rates are affected when the riskiness of bonds rises. Are the results the same in the two
frameworks?
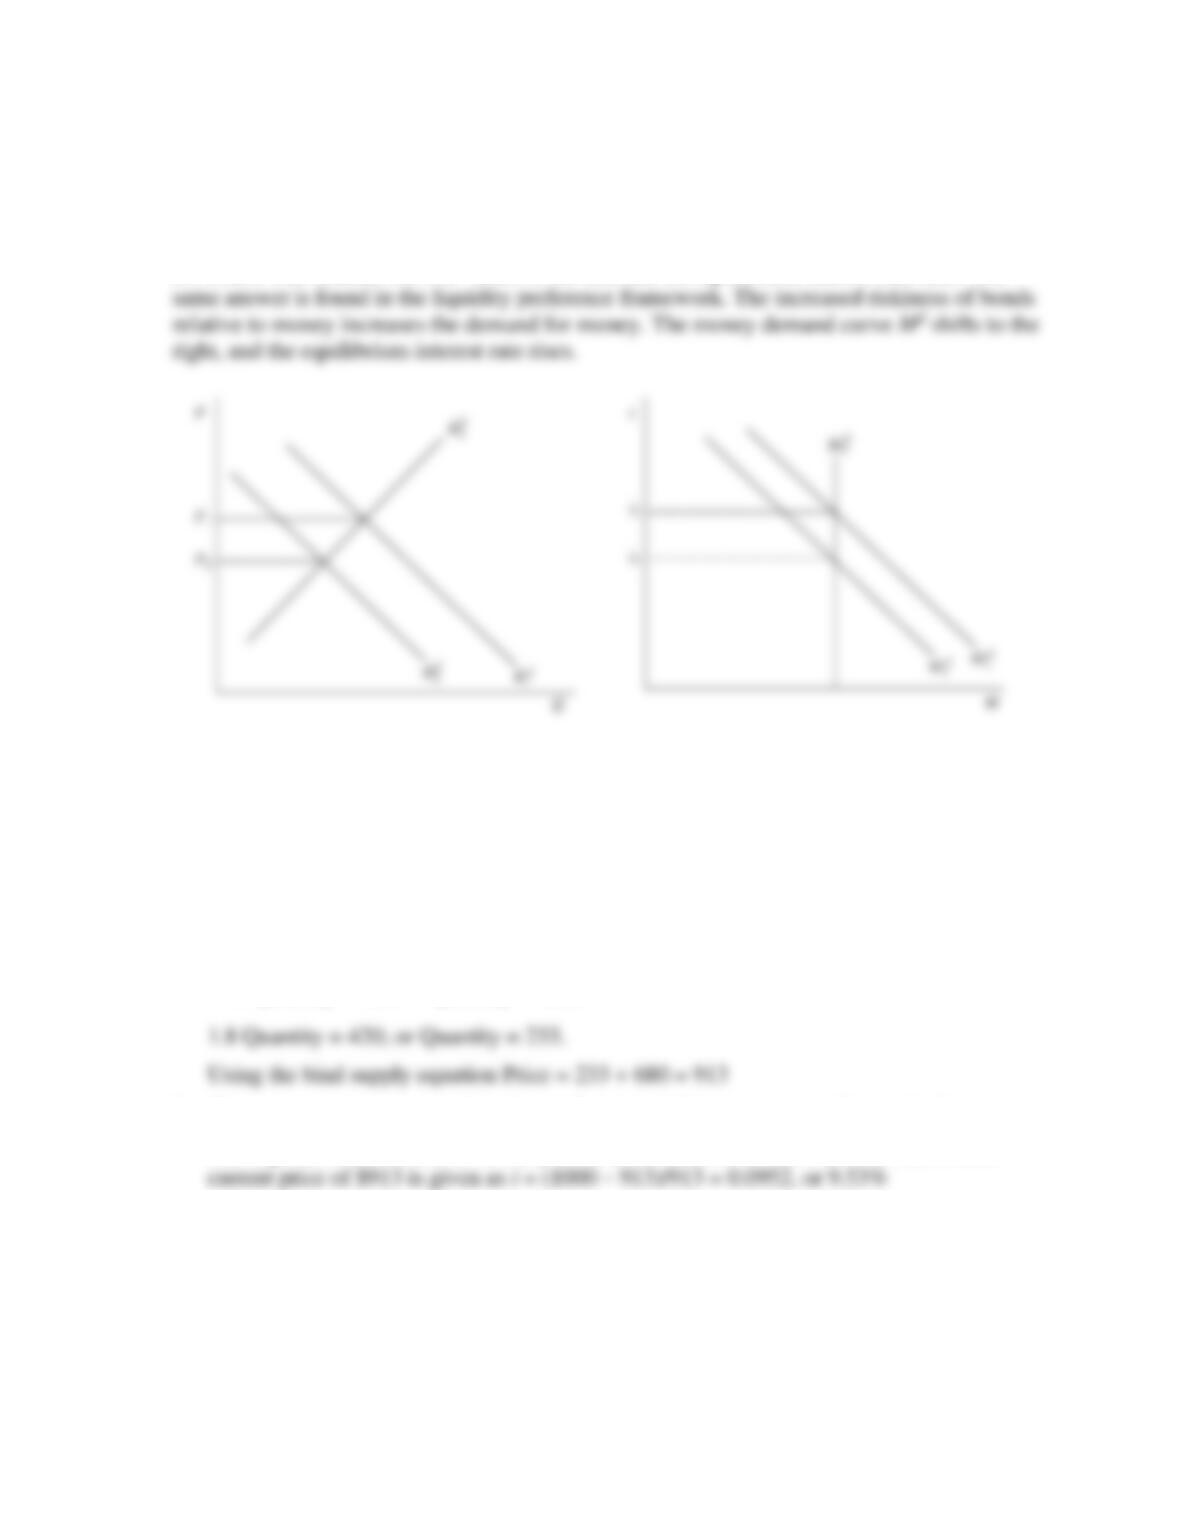
In the bond supply and demand analysis, the increased riskiness of bonds lowers the demand
for bonds. The demand curve Bd shifts to the left, and the equilibrium interest rate rises. The
24. The demand curve and supply curve for one-year discount bonds with a face value of $1,000
are represented by the following equations:
Bd: Price = −0.8 * Quantity + 1100
Bs: Price = Quantity + 680
a. What is the expected equilibrium price and quantity of bonds in this market?
Solving for the equilibrium gives:
–0.8 Quantity + 1100 = Quantity + 680;
b. Given your answer to part (a), what is the expected interest rate in this market?
The expected interest rate on a one-year discount bond with face value of $1,000 and
25. The demand curve and supply curve for one-year discount bonds with a face value of $1,050
are represented by the following equations:
Bd: Price = −0.8 * Quantity + 1160
Bs: Price = Quantity + 720
Suppose that, as a result of monetary policy actions, the Federal Reserve sells 90 bonds that
it holds. Assume that bond demand and money demand are held constant.
a. How does the Federal Reserve policy affect the bond supply equation?
The monetary policy action, essentially an open market operation, increases the supply of
bonds in the market by a quantity of 90, at any given price. Thus, the bond supply
equation will become Quantity = Price – 720 + 90, so that Price = Quantity + 630.
b. Calculate the effect on the equilibrium interest rate in this market, as a result of the
Federal Reserve’s action.
ANSWERS TO DATA ANALYSIS PROBLEMS
1. Go to the St. Louis Federal Reserve FRED database and find data on net worth of
households and nonprofits (HNONWRQ027S) and the 10-year U.S. treasury bond (GS10).
For the net worth indicator, adjust the units setting to “Percent Change from Year Ago,” and
for the 10-year bond, adjust the frequency setting to “Quarterly.”
a. What is the percent change in net worth over the most recent year of data available? All
else being equal, what do you expect should happen to the price and yield on the 10-year
treasury bond? Why?
b. What is the change in yield on the 10-year treasury bond over the last year of data
available? Is this result consistent with your answer to part (a)? Briefly explain.
Over the same time period, the yield on the 10-year treasury increased from 1.92% to
2.26%, which is inconsistent with the answer in part (a). It is likely that there are many
2. Go to the St. Louis Federal Reserve FRED database, and find data on the M1 money supply
(M1SL) and the 10-year U.S. treasury bond rate. For the M1 money supply indicator, adjust
the units setting to “Percent Change from Year Ago,” and for the 10-year treasury bond,
adjust the frequency setting to “Quarterly.” Download the data into a spreadsheet.
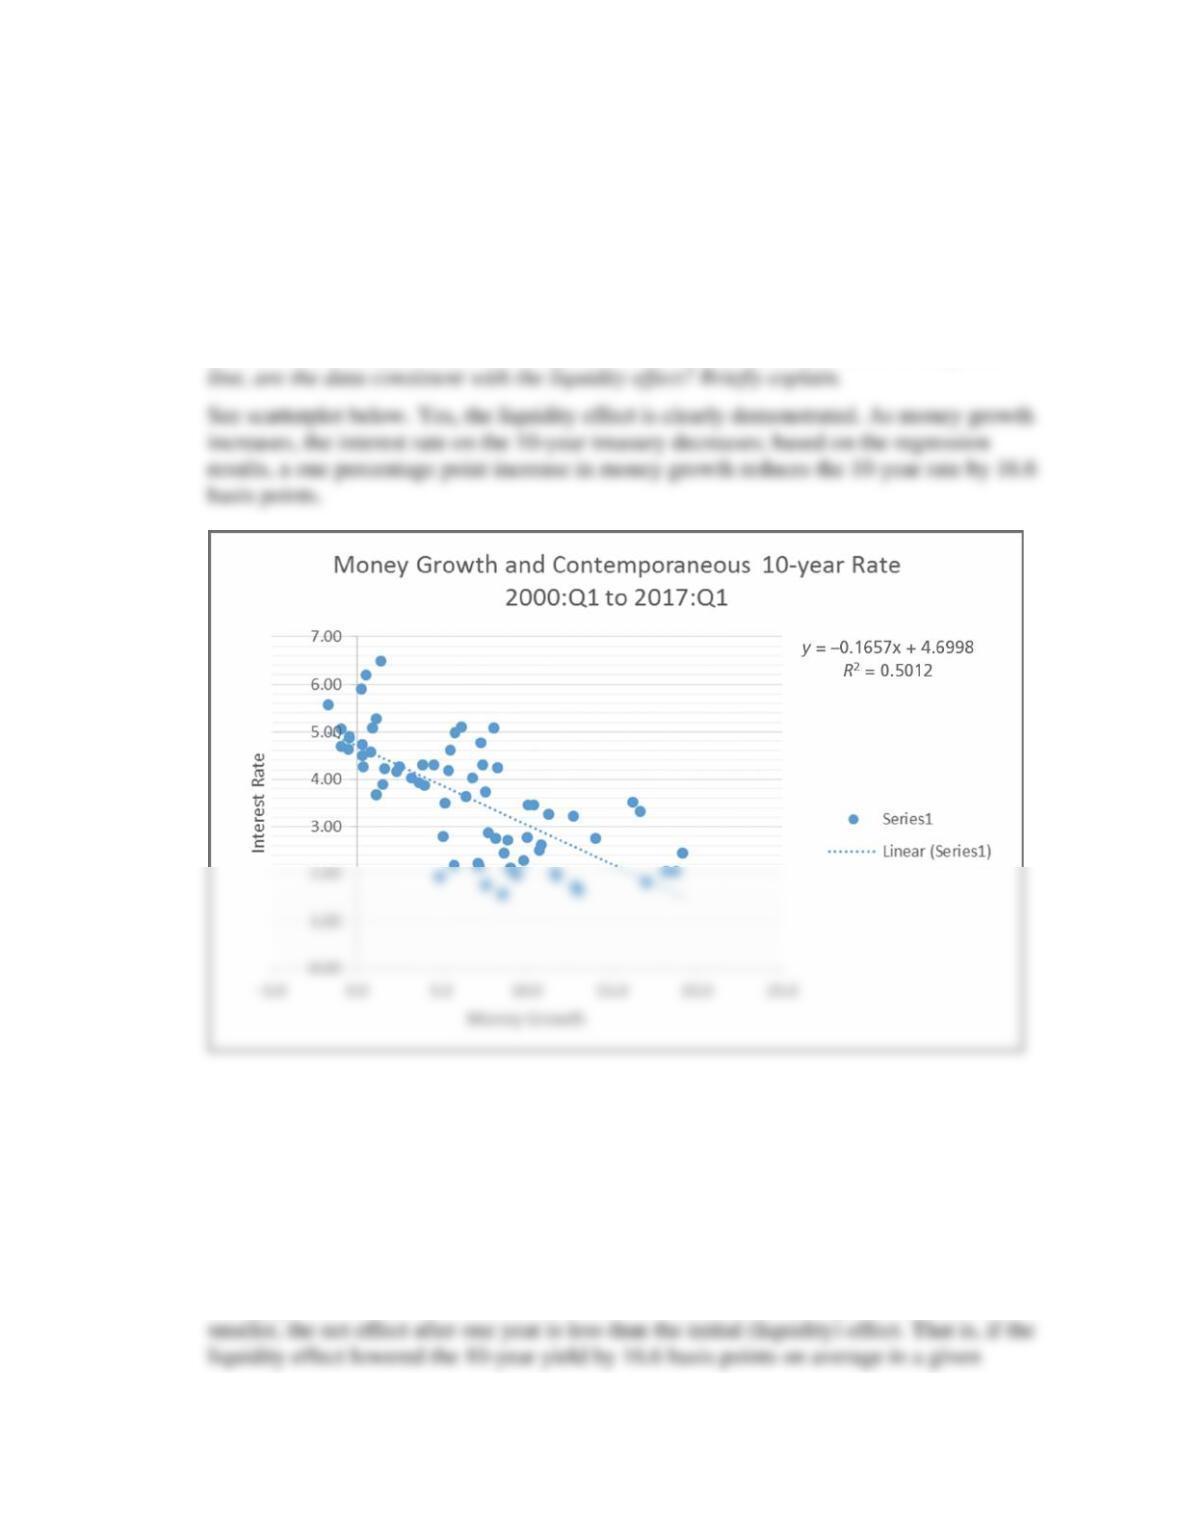
a. Create a scatter plot, with money growth on the horizontal axis and the 10-year treasury
rate on the vertical axis, from 2000:Q1 to the most recent quarter of data available. On
the scatter plot, graph a fitted (regression) line of the data (there are several ways to do
this; however, one particular chart layout has this option built in). Based on the fitted
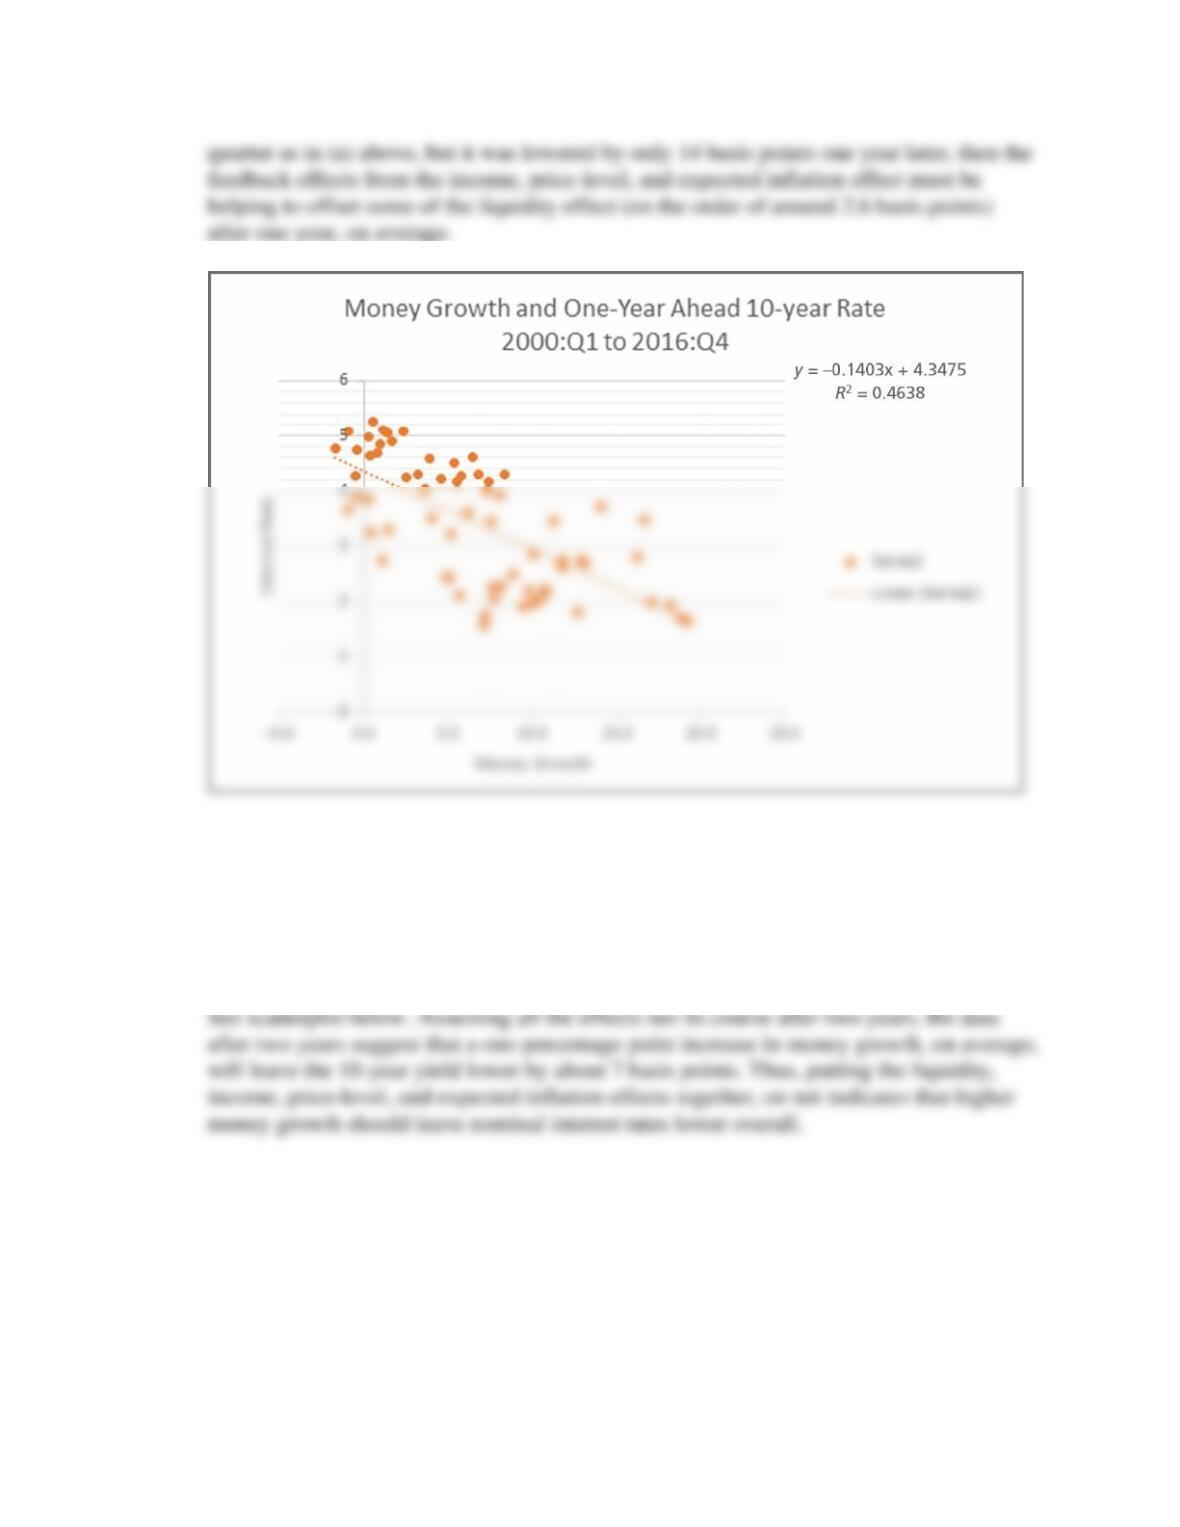
b. Repeat part (a), but this time compare the contemporaneous money growth rate with the
interest rate four quarters later. For example, create a scatter plot comparing money
growth from 2000:Q1 with the interest rate from 2001:Q1, and so on, up to the most
recent pairwise data available. Compare your results to those obtained in part (a), and
interpret the liquidity effect as it relates to the income, price-level, and expected-inflation
effects.
See scatterplot below. The effects of money growth one year later still seem to indicate
money growth lowers the interest rate on net. However, since the regression coefficient is
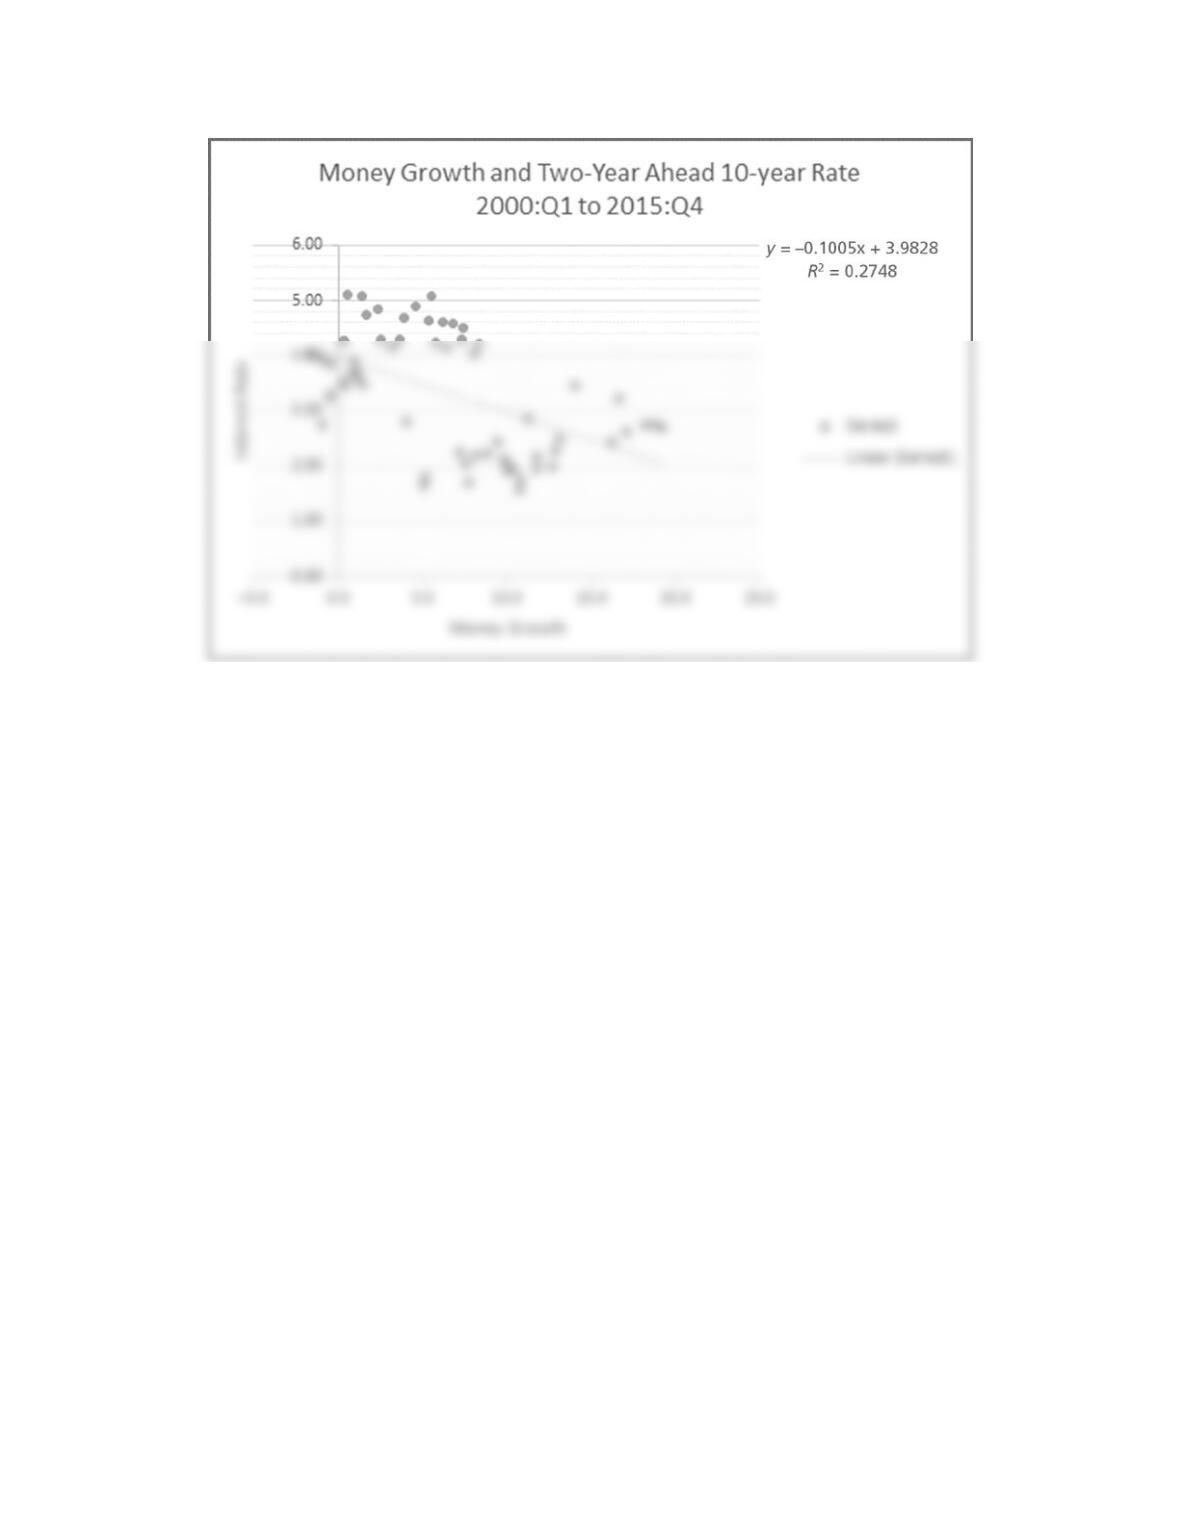
c. Repeat part (a) again, except this time compare the contemporaneous money growth rate
with the interest rate eight quarters later. For example, create a scatter plot comparing
money growth from 2000:Q1 with the interest rate from 2002:Q1, and so on, up to the
most recent pairwise data available. Assuming the liquidity and other effects are fully
incorporated into the bond market after two years, what do your results imply about the
overall effect of money growth on interest rates?
d. Based on your answers to parts (a) through (c), how do the actual data on money growth
and interest rates compare to the three scenarios presented in Figure 11 of this chapter?
The data interpretation illustrates a story consistent with panel (a) in the figure, where the
liquidity effect is dominant, and over time the income, price-level, and expected-inflation
effects slowly offset some of the downward effects of expansionary policy on the
nominal interest rate, but leave nominal interest rates lower on net overall.