Chapter 3
ANSWERS TO QUESTIONS
1. Why is simply counting currency an inadequate measure of money?
Since a lot of other assets have liquidity properties that are similar to currency but can be
used as money to purchase goods and services, not counting them would understate an
2. In prison, cigarettes are sometimes used among inmates as a form of payment. How is it
possible for cigarettes to solve the “double coincidence of wants” problem, even if a
prisoner does not smoke?
Even if he or she were a non-smoker, since the prisoner knows that others in the prison will
1. Three goods are produced in an economy by three individuals:
Good Producer
Apples Orchard Owner
Bananas Banana Grower
Chocolate Chocolatier
If the orchard owner likes only bananas, the banana grower likes only chocolate, and the
chocolatier likes only apples, will any trade between these three persons take place in a
barter economy? How will introducing money into the economy benefit these three
producers?
Because the orchard owner likes only bananas but the banana grower doesn’t like apples, the
banana grower will not want apples in exchange for his bananas, and they will not trade.
Similarly, the chocolatier will not be willing to trade with the banana grower because she
does not like bananas. The orchard owner will not trade with the chocolatier because he
doesn’t like chocolate. Hence, in a barter economy, trade among these three people may well
2. Suppose that the cost of a movie ticket is $12, and a latte costs $6. Why would the theater
management say the cost of admission is $12 and not two lattes? Explain why it is more
efficient to compare the value of commodities in monetary terms.
One of the main functions of money is to express a unit of account. In this example, money
represents units of currency and serves as a standard measure of value that allows the theater
5. Over several hundred years, payments systems used in countries across the world have
evolved. For each of the following situations identify the type of payment utilized and at least
one reason why economies are moving from checks to electronic payments.
a. Sheila visits a local grocery store to purchase a dozen eggs and a bag of dog food. She
uses a €100 note to pay for the goods.
Fiat money
6. In Brazil, a country that underwent a rapid inflation before 1994, many transactions were
conducted in dollars rather than in reals, the domestic currency. Why?
Because of the rapid inflation in Brazil, the domestic currency, the real, was a poor store of
7. Was money a better store of value in the United States in the 1950s than in the 1970s? Why
or why not? In which period would you have been more willing to hold money?
Because money was losing value at a slower rate (the inflation rate was lower) in the 1950s
8. Why have some economists described money during a hyperinflation as a “hot potato” that
is quickly passed from one person to another?
9. Why were people in the United States in the nineteenth century sometimes willing to be paid
by check rather than with gold, even though they knew there was a possibility that the check
might bounce?
Because a check was so much easier to transport than gold, people would frequently rather be
10. In ancient Greece, why was gold a more likely candidate for use as money than wine?
Wine is more difficult to transport than gold and is also more perishable. Gold is thus a better
11. If you use an online payment system such as PayPal to purchase goods or services on the
Internet, does this affect the M1 money supply, the M2 money supply, both, or neither?
Explain.
Neither. Although PayPal and many other e-money systems work as other forms of money
do to facilitate purchases of goods and services, it does not count in the M1 or M2 money
supplies. Because PayPal and similar payment systems are generally credit-based, this
requires payment at a future date for funds used today; those future payments must be made
12. Explain the concept of liquidity. Rank the following assets from most liquid to least liquid:
a. Land
b. The inventory of a merchandiser
c. Cash in hand
13. Which of the Federal Reserve’s measures of the monetary aggregates—M1 or M2—is
composed of the most liquid assets? Which is the larger measure?
M1 contains the most liquid assets. M2 is the largest measure.
14. It is not unusual to find a business that displays a sign saying “no personal checks, please.”
On the basis of this observation, comment on the relative degree of liquidity of a checking
account versus currency.
The degree of liquidity of an asset is measured by considering how much time and effort
(i.e., transaction costs) are needed to convert that asset into currency. Currency is by
definition the most liquid type of money. Different types of money have different degrees of
15. For each of the following assets, indicate which of the monetary aggregates (M1 and M2)
includes them:
a. Currency
b. Money market mutual funds
c. Small-denomination time deposits
16. Assume that you are interested in earning some return on the idle balances you usually keep
in your checking account and decide to buy some money market mutual funds shares by
writing a check. Comment on the effect of your action (with everything else the same) on M1
17. In April 2009, the growth rate of M1 fell to 6.1%, while the growth rate of M2 rose to 10.3%.
In September 2013, the year-over-year growth rate of the M1 money supply was 6.5%, while
the growth rate of the M2 money supply was about 8.3%. How should Federal Reserve
policymakers interpret these changes in the growth rates of M1 and M2?
During the period in question, the M1 growth rate fell by 0.4%, while the M2 growth rate
increased by 2.0%. Because these growth rates moved in opposite directions, it is difficult to
18. Suppose a researcher discovers that a measure of the total amount of debt in the U.S.
economy over the past twenty years was a better predictor of inflation and the business cycle
than M1 or M2. Does this discovery mean that we should define money as equal to the total
amount of debt in the economy?
Not necessarily. Although the total amount of debt has predicted inflation and the business
cycle better than M1 or M2, it may not be a better predictor in the future. Without some
ANSWERS TO APPLIED PROBLEMS
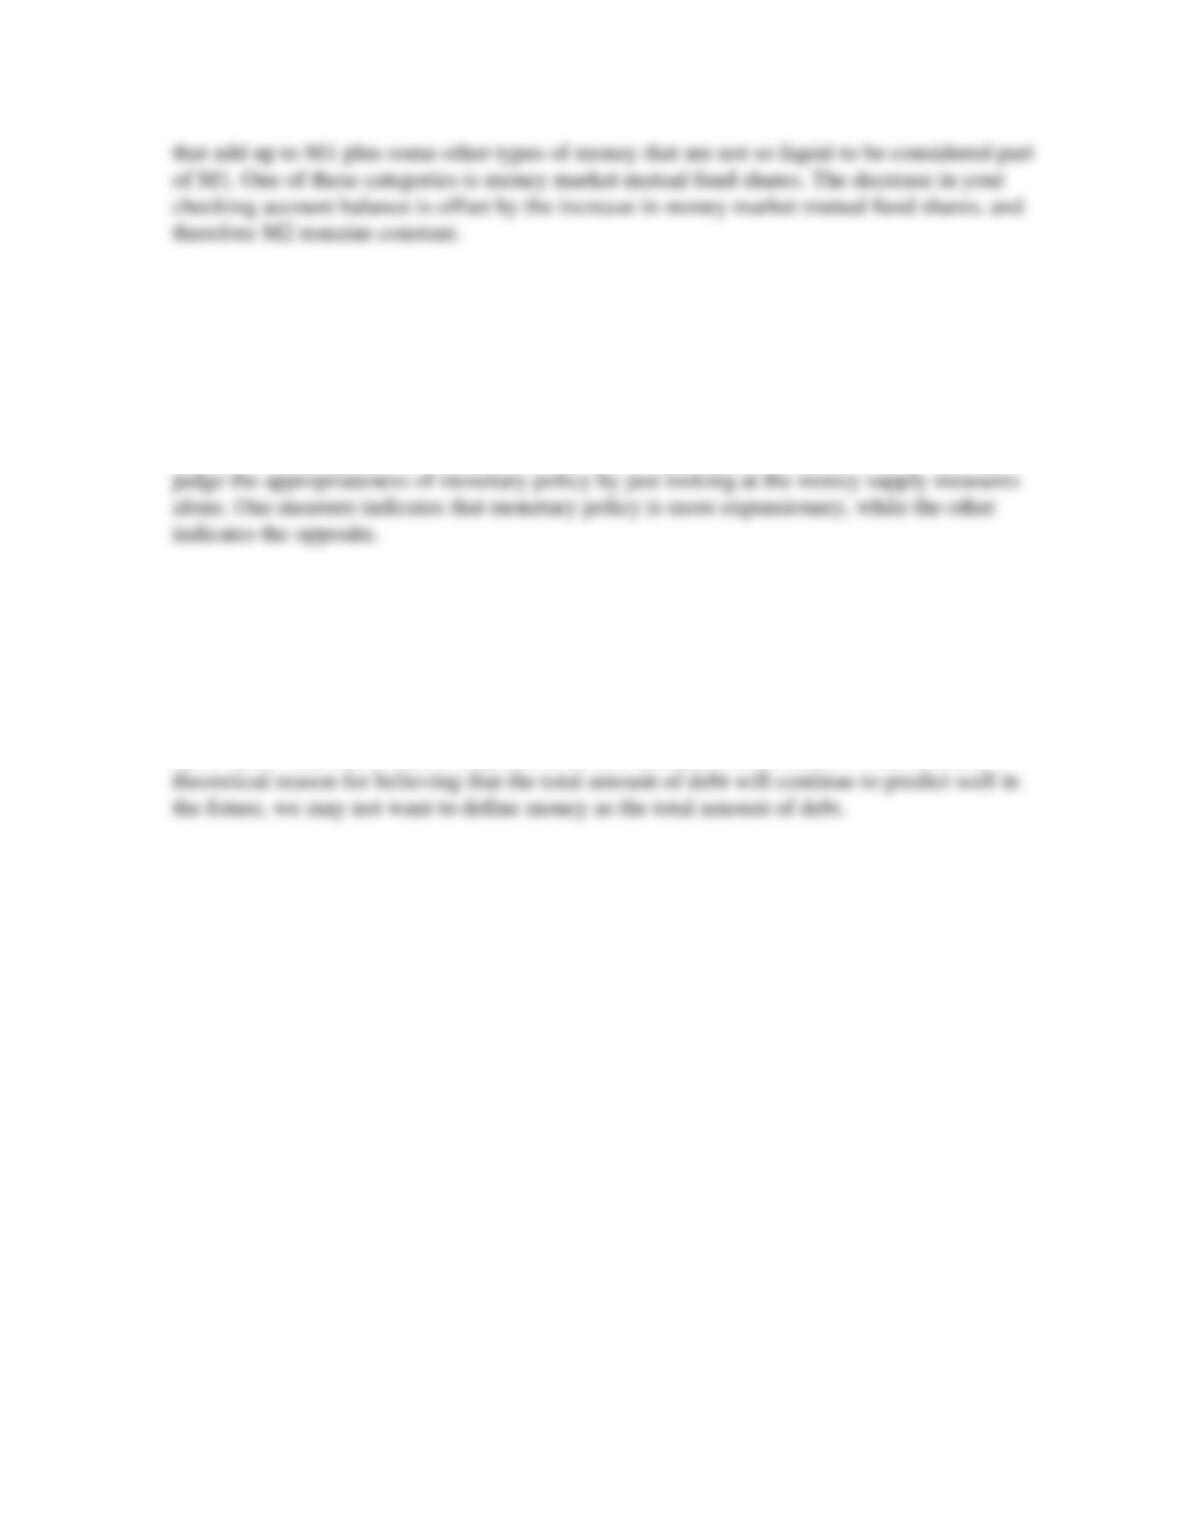
Q.19 The table below shows hypothetical values, in billions of dollars, of different forms of
money.
a. Use the table to calculate the M1 and M2 money supplies for each year, as well as the
growth rates of the M1 and M2 money supplies from the previous year.
b. Why are the growth rates of M1 and M2 so different? Explain..
2019
2020
2021
2022
A
Currency
880
895
900
906
B
Money market mutual fund shares
680
685
683
692
C
Saving account deposits
5,500
5,780
5,968
6,105
D
Money market deposit accounts
1,214
1,245
1,274
1,329
E
Demand and checkable deposits
1,000
972
980
993
F
Small denomination time deposits
840
871
1,133
1,576
G
Students should use the table to calculate the M1 and M2 money supply for each year.
The M1 money supply is the sum of rows A, E, and G for each year. The M2 money supply
is the sum of the components A−G for each year. Therefore, the M1 money supply for each
year is as follows: (Enter your responses rounded to the nearest dollar.)
M1
2019
880
+
1,000
+
5
=
1,885
2020
895
+
972
+
5
=
1,872
2021
900
+
980
+
4
=
1,884
The M2 money supply for each year is as follows: (Enter your responses rounded to the
nearest whole number.)
M2
2019
880
+
680
+
5,500
+
1,214
+
1,000
+
840
+
5
=
10,119
2020
895
+
685
+
5,780
+
1,245
+
972
+
871
+
5
=
10,453
2021
900
+
683
+
5,968
+
1,274
+
980
+
1,133
+
4
=
10,942
2022
906
+
692
+
6,105
+
1,329
+
993
+
1,576
+
3
=
11,604
Now, students need to calculate the growth rates of the M1 and M2 money supply from the
previous year using the following formula:
1
1
Percentage Change tt
t
VV
V
−
−
−
=
Where Vt is the value in year t and Vt−1 is the value in year t − 1.
2020
1,872
1,885
÷
1,885
×
100
=
2021
1,884
1,872
÷
1,872
×
100
=
M1 Growth Rate %
2020
10,453
−
10,119
÷
10,119
×
100
=
3.3
2021
10,942
−
10,453
÷
10,453
×
100
=
4.7
2022
11,604
10,942
÷
10,942
×
100
=
ANSWERS TO DATA ANALYSIS PROBLEMS
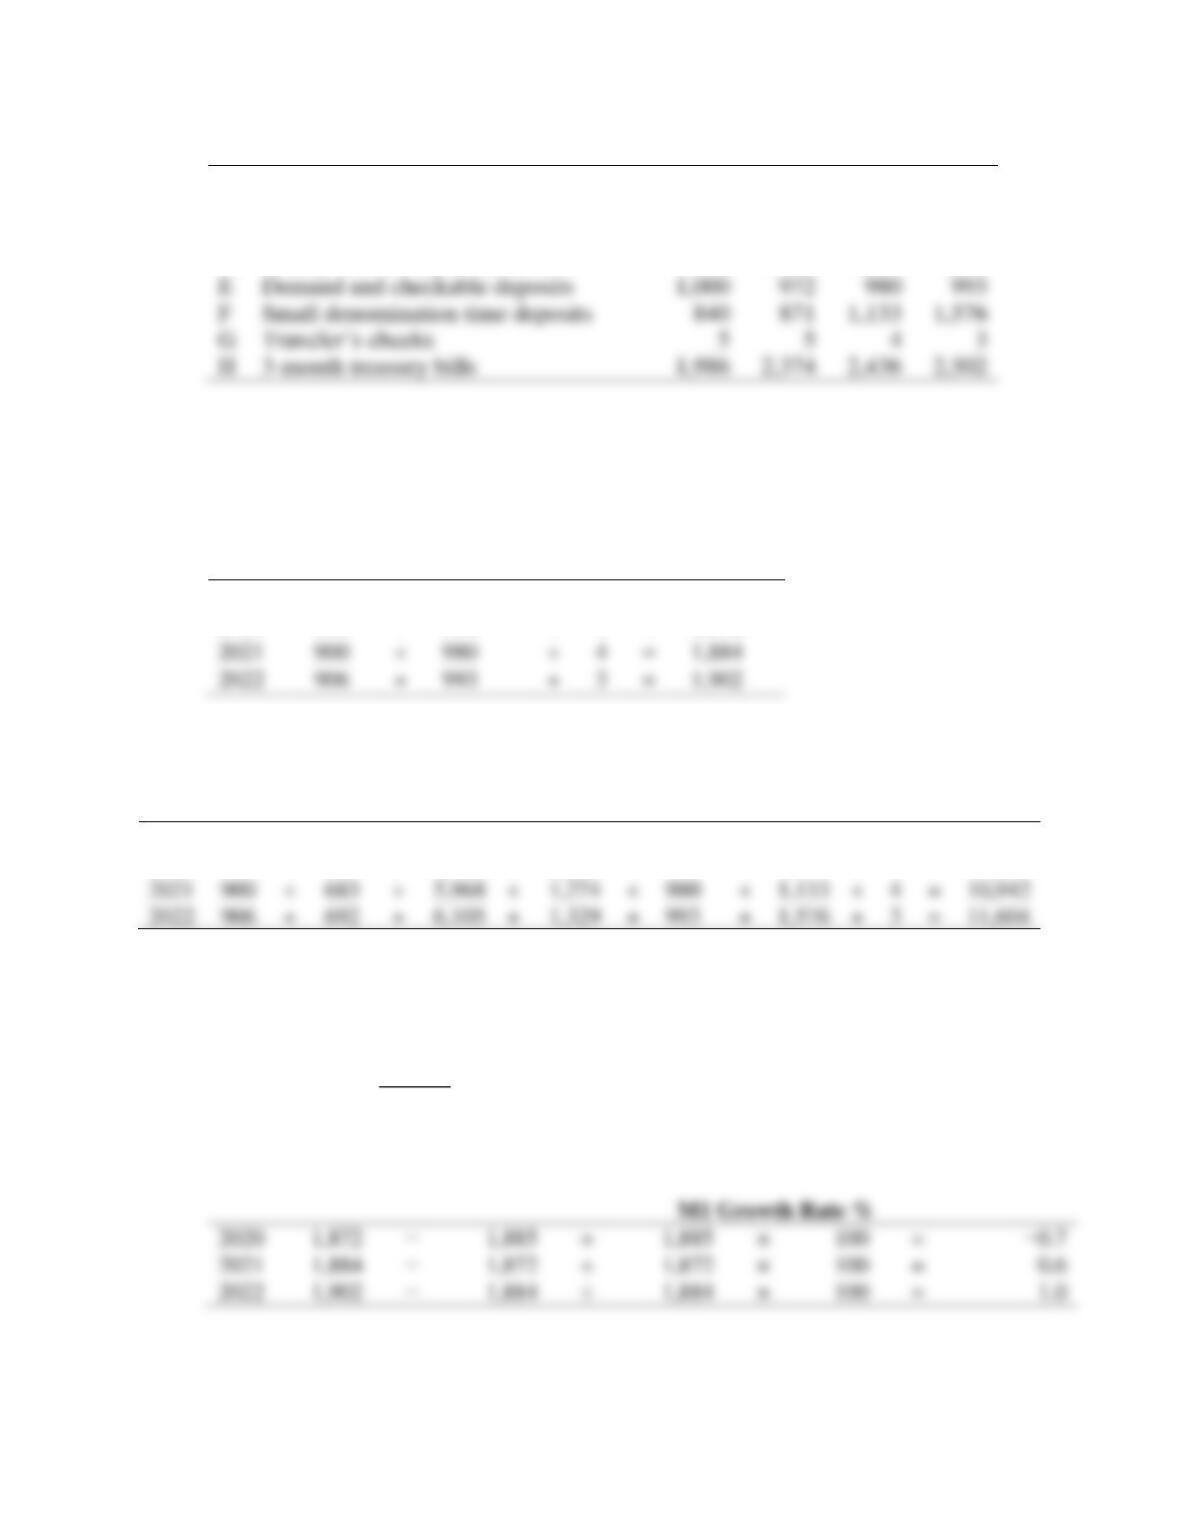
1. Go to the St. Louis Federal Reserve FRED database and find data on currency (CURRSL),
traveler’s checks (TVCKSSL), demand deposits (DEMDEPSL), and other checkable deposits
(OCDSL). Calculate the M1 money supply, and calculate the percentage change in M1 and
in each of the four components of M1 from the most recent month of data available to the
same time one year prior. Which component has the highest growth rate? The lowest growth
rate? Repeat the calculations using the data from January 2000 to the most recent month of
data available, and compare your results.
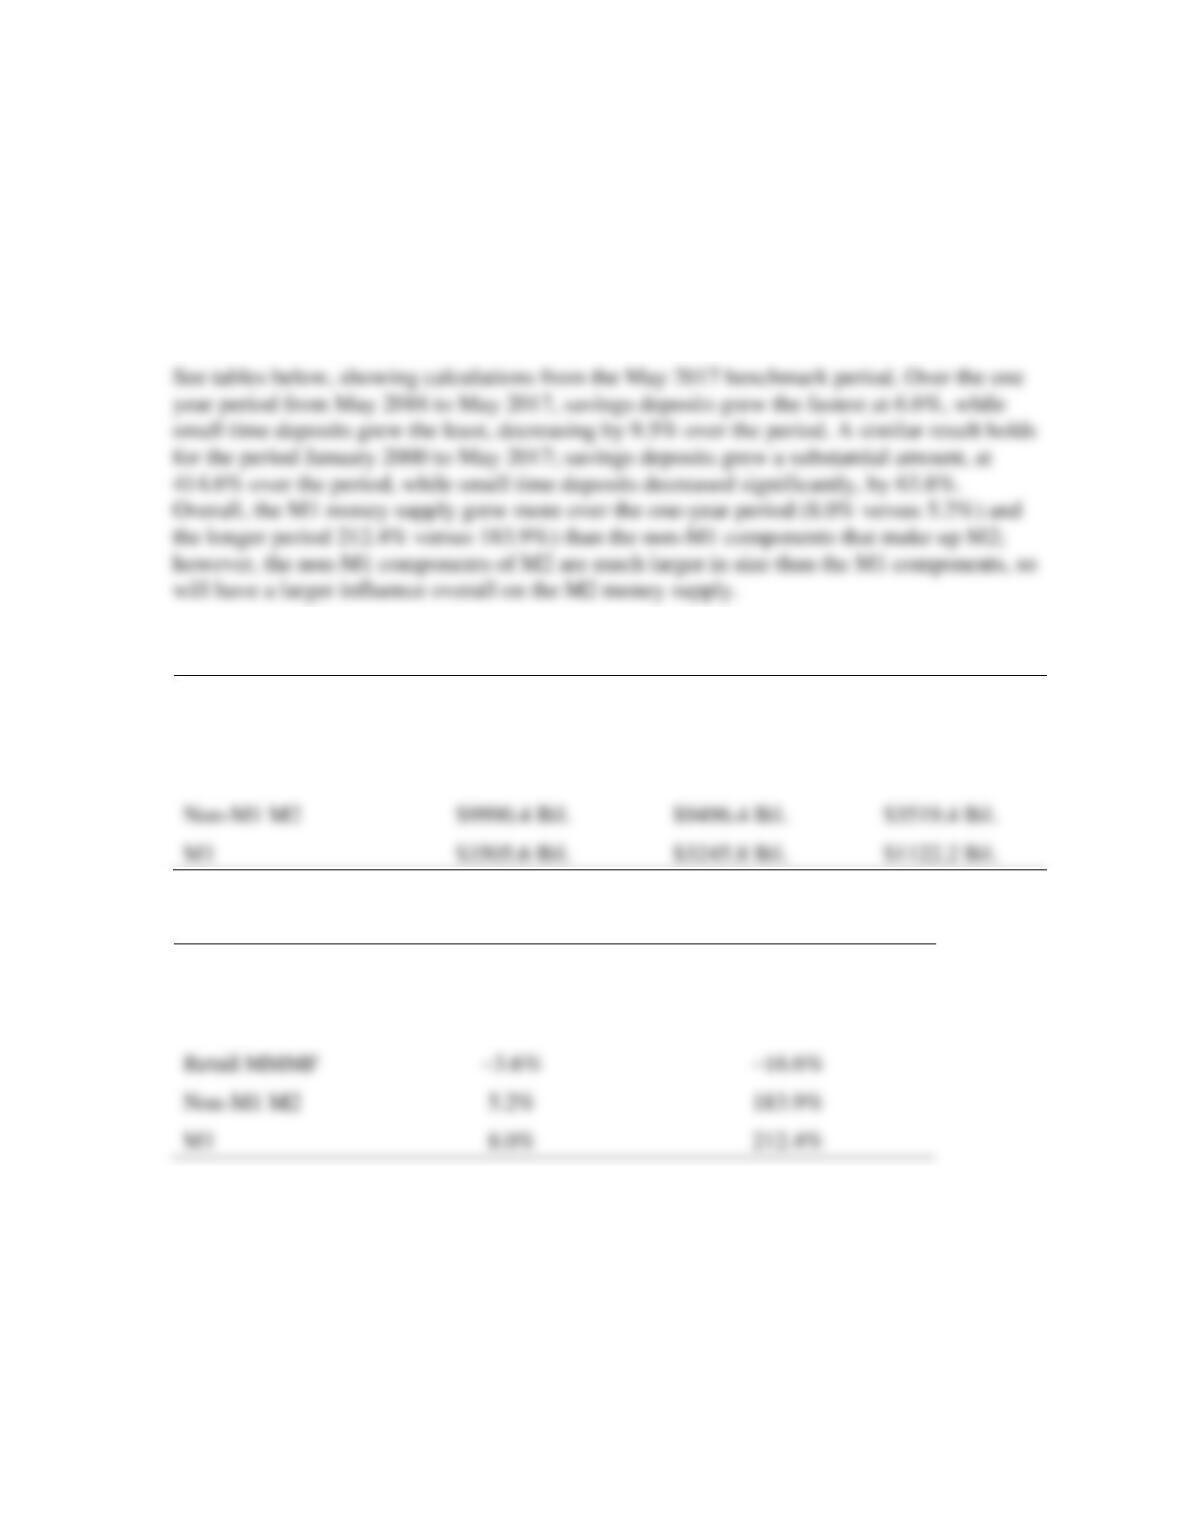
See tables below, showing calculations from the May 2017 benchmark period. Over the one
year period from May 2016 to May 2017, demand deposits grew the fastest at 9.1%, while
May 2017
May 2016
January 2000
Currency
$1468.5 Bil.
$1375.4 Bil.
$524.9 Bil.
Traveler’s Checks
$2.1 Bil.
$2.4 Bil.
$8.5 Bil.
Demand Deposits
Deposits
$3505.6 Bil.
$3245.9 Bil.
$1122.1 Bil.
May 2016 to May 2017
January 2000 to May 2017
Currency
6.8%
179.8%
Traveler’s Checks
−12.5%
−75.3%
Demand Deposits
9.1%
323.1%
Deposits
8.5%
135.1%
8.0%
212.4%
2. Go to the St. Louis Federal Reserve FRED database and find data on small-denomination
time deposits (STDSL), savings deposits and money market deposit accounts (SAVINGSL),
and retail money market funds (RMFSL). Calculate the percentage change of each of these
three components of M2 (not included in M1) from the most recent month of data available to
the same time one year prior. Which component has the highest growth rate? The lowest
growth rate? Repeat the calculations using the data from January 2000 to the most recent
month of data available, and compare your results. Use your answers from question 1 to
determine which grew faster: the non-M1 components of M2 or the M1 money supply.
May 2017
May 2016
January 2000
Small Time Deposits
$349.0 Bil.
$385.7 Bil.
$963.4 Bil.
Savings/MMDA
$8962.0 Bil.
$8405.9 Bil.
$1741.6 Bil.
Retail MMMF
$679.4 Bil.
$704.8 Bil.
$814.4 Bil.
Non-M1 M2
$9990.4 Bil.
$9496.4 Bil.
$3519.4 Bil.
$3505.6 Bil.
$3245.8 Bil.
$1122.2 Bil.
May 2016 to May 2017
January 2000 to May 2017
Small Time
Deposits
−9.5%
−63.8%
Savings/MMDA
6.6%
414.6%
Retail MMMF
−3.6%
−16.6%
Non-M1 M2
5.2%
183.9%
8.0%
212.4%