Instructor Guide for The Essential Cosmic Perspective, Eighth Edition 151
Chapter 12. Surveying the Stars
This chapter outlines how we measure and classify stars. It introduces many
important ideas, such as the relationship among luminosity, brightness, and
distance. The chapter also introduces the H-R diagram.
Whenever possible, we have used real stellar data from Hipparcos and
other sources to construct the H-R diagrams in Chapters 12 and 13.
Teaching Notes (by Section)
Section 12.1 Properties of Stars
This section explains how we determine basic properties of stars: luminosity,
surface temperature, and mass.
We avoid using the term flux
for students. Instead, we use the term apparent brightness, which refers
explicitly to the concept of brightness one would observe. Likewise, we
We introduce the magnitude system in this section, but we do not teach
magnitudes in our own general education courses at all. We find that
understanding magnitudes requires great effort for students (particularly
students who are taking astronomy in order to satisfy a physical science
requirement) yet adds
152 Bennett, Donahue, Schneider, Voit
The discussion of star colors, temperatures, and absorption lines assumes
that students have covered the material on light and color in Chapter 5.
We have found that hosting a student contest to identify a modern
mnemonic always stimulates some witty and timely mnemonics
Students, particularly female students, enjoy the stories of Annie Jump
Cannon and Cecilia Payne-Gaposchkin. For many of them, these are the
Teaching students about measuring masses is one of the main themes in
our course. We found that the most effective way to communicate this
difficult but pervasive concept in a large class is to use a combination
of frequent conceptual questions in class and peer instruction. (See Eric
Section 12.2 Patterns Among Stars
This section summarizes stellar classification and introduces the H-R diagram.
The previous section laid the groundwork for this section. While students can
understand the observational H-R diagram before studying stellar masses, we
find it prudent to discuss the H-R diagram after covering masses, because we can
Instructor Guide for The Essential Cosmic Perspective, Eighth Edition 153
immediately point out that the main sequence is fundamentally a sequence of
stellar masses. This approach helps counteract the tendency of students to think
of the main sequence as a temporal evolution of stellar properties.
In small class sections, it can be illustrative to have students plot stellar
Section 12.3 Star Clusters
The chapter concludes with this section on star clusters, emphasizing that they are
excellent laboratories for comparing the properties of stars and establishing how
stars evolve.
-element content also
affects its color. Heavy elements tend to hinder the flow of energy in the
Answers/Discussion Points for Think About It/See It for Yourself
Questions
The Think About It and See It for Yourself questions are not numbered in the
book, so we list them in the order in which they appear, keyed by section number.
Section 12.1
(p. 311, SIFY) Star charts use different sizes of dots to denote stars of
154 Bennett, Donahue, Schneider, Voit
Section 12.2
(p. 319) The colors of the stars are similar to the star colors determined by
thermal radiation at the given surface temperature. The colors of stars are
not necessarily related to their interior temperatures. For example, a red
supergiant and a red main-sequence star have very different core
temperatures.
(p. 323) Bellatrix: spectral type B, luminosity class V, radius
~7
R
.
.
Section 12.3
(p. 327) The main-sequence turnoff point for a 10-billion-year-old star
cluster should be around 1LSun , because the Sun itself leaves the main
Solutions to End-of-Chapter Problems (Chapter 12)
Visual Skills Check
Instructor Guide for The Essential Cosmic Perspective, Eighth Edition 155
Review Questions
1. A snapshot of the heavens, like a snapshot of a family at a family reunion,
2. Stars are similar in the sense that they all convert hydrogen to helium in
their cores during their main sequence phase, which is the longest phase of
3. luminosity measures how much energy it radiates into space.
The apparent brightness tells us how bright it seems in our sky. The two
4. Stellar parallax
motion around the Sun. Because more distant stars show smaller parallaxes
5. Spectral types are a way of classifying stars according to their color or what
6. There are three kinds of binary star systems. The first is visual binaries,
those in which we can see both stars distinctly as they orbit each other.
The second type of binary system is the eclipsing binary, which we see
7. A sketch of an H-R diagram will look like Figure 12.10. Cool and dim stars
are located in the lower right hand corner. Hot and dim stars are found to the
156 Bennett, Donahue, Schneider, Voit
8. Luminosity classes of stars are designated by Roman numerals and tell us
what region of the H-R diagram the star falls in. We use both spectral type
9. The defining characteristic of a main-sequence star is that it falls along a
specific line on the H-R diagram, and so it exhibits a particular relationship
10. Lower mass stars have longer lifetimes than higher mass stars. This is
because the more massive stars are much more luminous than the lower
11. Giant and supergiant stars have left the main sequence after exhausting their
supplies of hydrogen fuel in their central cores. They release fusion energy
12.
13. Open clusters are located in the galactic disk. They contain up to several
14. The H-R diagram looks different for clusters of stars because the largest stars
Instructor Guide for The Essential Cosmic Perspective, Eighth Edition 157
Does It Make Sense?
15. Two stars that look very different must be made of different kinds of
16. Two stars that have the same apparent brightness in the sky must also
17. Sirius looks brighter than Alpha Centauri, but we know that Alpha Centauri
18. Stars that look red-hot have hotter surfaces than stars that look blue. This
statement does not make sense. Blue stars are hotter than red stars.
19. Some of the stars on the main sequence of the H-R diagram are not
20. The smallest, hottest stars are plotted in the lower left-hand portion of the
H-R diagram. This statement makes sense. Temperature on the H-R diagram
21. Stars that begin their lives with the most mass live longer than less massive
stars because they have so much more hydrogen fuel. This statement does
22. Star clusters with lots of bright, blue stars of spectral types O and B are
23. All giants, supergiants, and white dwarfs were once main-sequence stars.
24. Most of the stars in the sky are more massive than the Sun. This statement
Quick Quiz
158 Bennett, Donahue, Schneider, Voit
Process of Science
35. in a sequence based on the presence
and absence of spectral features and not just on the hydrogen lines. That
system simplified and reordered the previous system significantly. Progress
36. If high-mass star lifespans are shorter than low-mass star lifespans, and if
Group Work Exercise
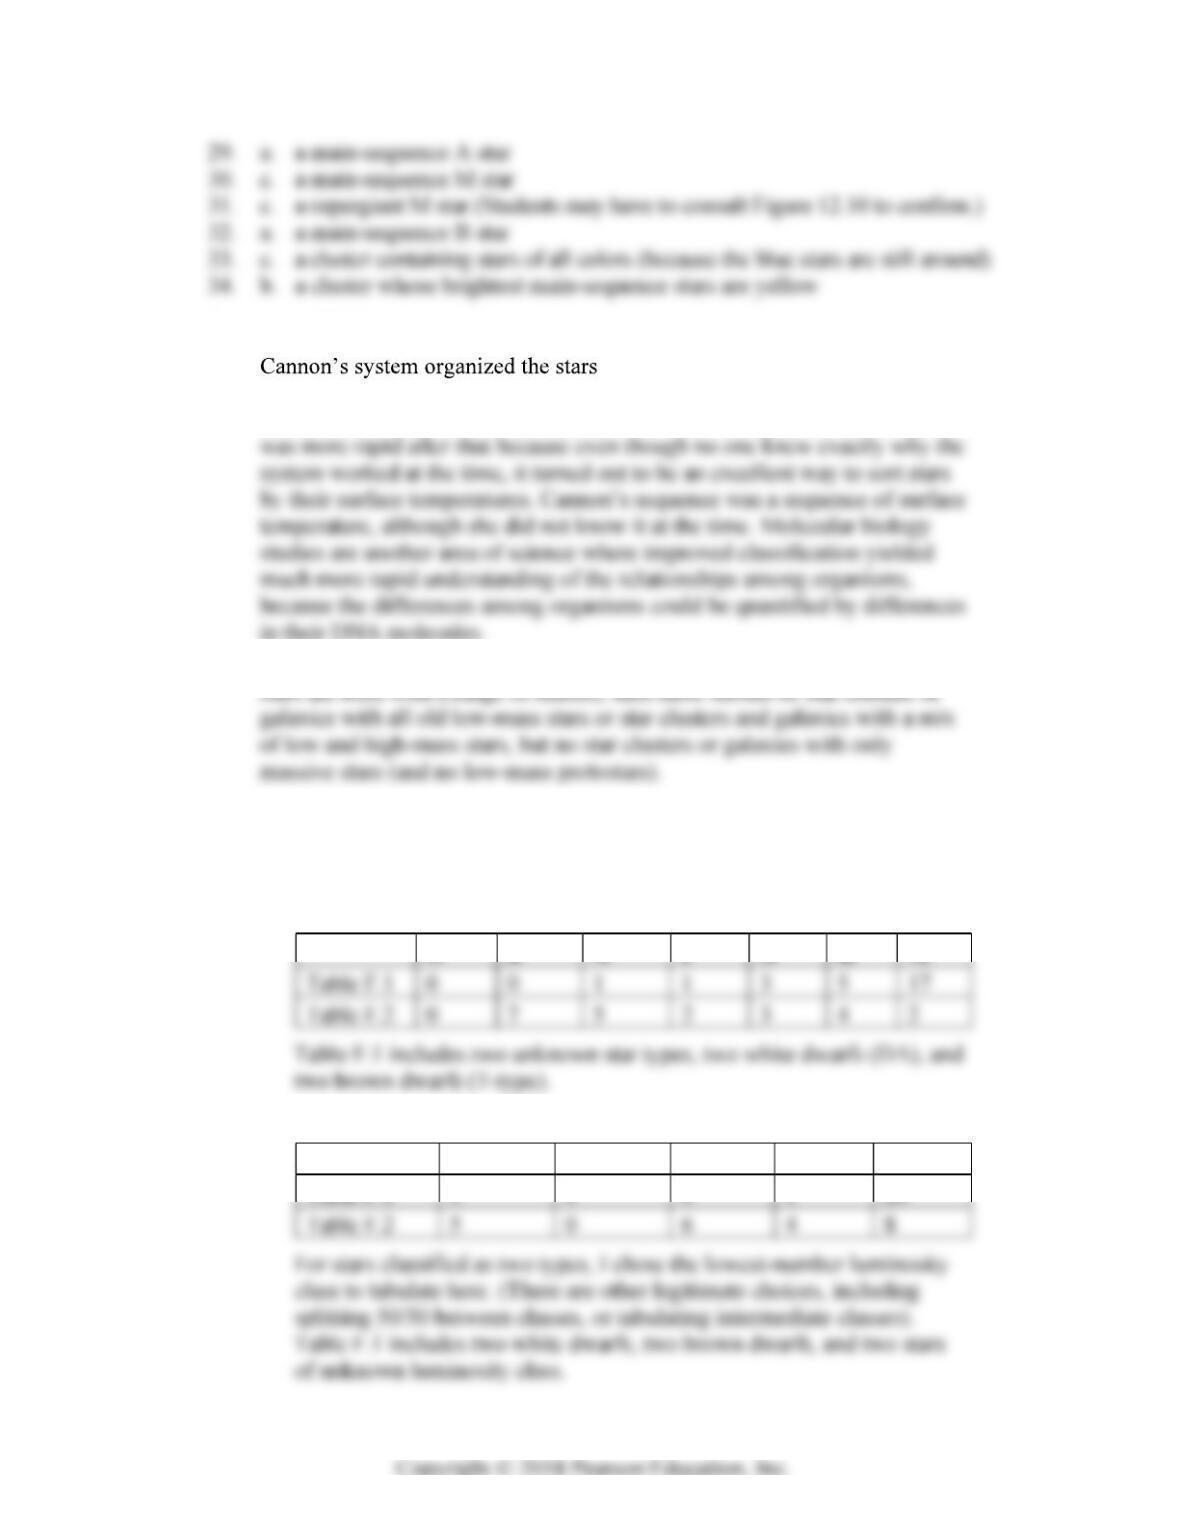
37. Brief descriptions of the correct answers are provided here. These results are
based on information in Tables F.1 and F.2.
a. Stars by spectral type:
O B A F G K M
Table F.1
0
0
1
1
3
5
17
b. Stars by luminosity class (size):
I II III IV V
Table F.1
0
0
0
1
26
Instructor Guide for The Essential Cosmic Perspective, Eighth Edition 159
c, d. Table F.1 lists the closest stars, and is not biased to only the brightest
stars. (Shorthand: I -limited, or volume-limited down to a
e. The nearest star of each spectral type:
O B A F G K M
N/A N/A Sirius Procyon
Sun
Alpha
Proxima
f. The brightness limit of Table F.2 is defined by the faintest star in it, Beta
Short Answer/Essay Questions
160 Bennett, Donahue, Schneider, Voit
39. The list of the brightest stars will include the very luminous hot stars from
distances greater than 12 light-years, while the list of the fainter yet closer
low-mass stars will not. The list of stars within 12 light-
40. In Figure 12.10, Proxima Centauri is redder and has a cooler surface
temperature than Sirius. Proxima Centauri is at least 10 times smaller in
41. The parallax of stars, as viewed from the orbit of Jupiter, would be about
five times larger than the parallax from Earth
42. If a star doubled in size with no change in luminosity, its surface
temperature would go down, because the surface area of the star would
increase, but its energy output would stay the same, so a lower temperature
43. In Figure 12.8, the blue star is smaller than the red star, so when the blue
44. Both star systems are at the same distance from Earth, so the fact that one
physically smaller. Because smaller orbits for a given mass imply larger
45. This is an essay question. The key points are that stars of all colors (with
colors and luminosities described by the main sequence) form as the cluster
Quantitative Problems
46. an AU to do this problem, because the apparent
brightness (flux) of the Sun scales with distance.
Distance from Sun
(dnew) New Apparent Brightness
(watts/m2)
47. a. We rearrange the formula for the inverse square law for light to solve for
the luminosity:
d
new
1
AU
1
(dnew /1 AU)2
162 Bennett, Donahue, Schneider, Voit
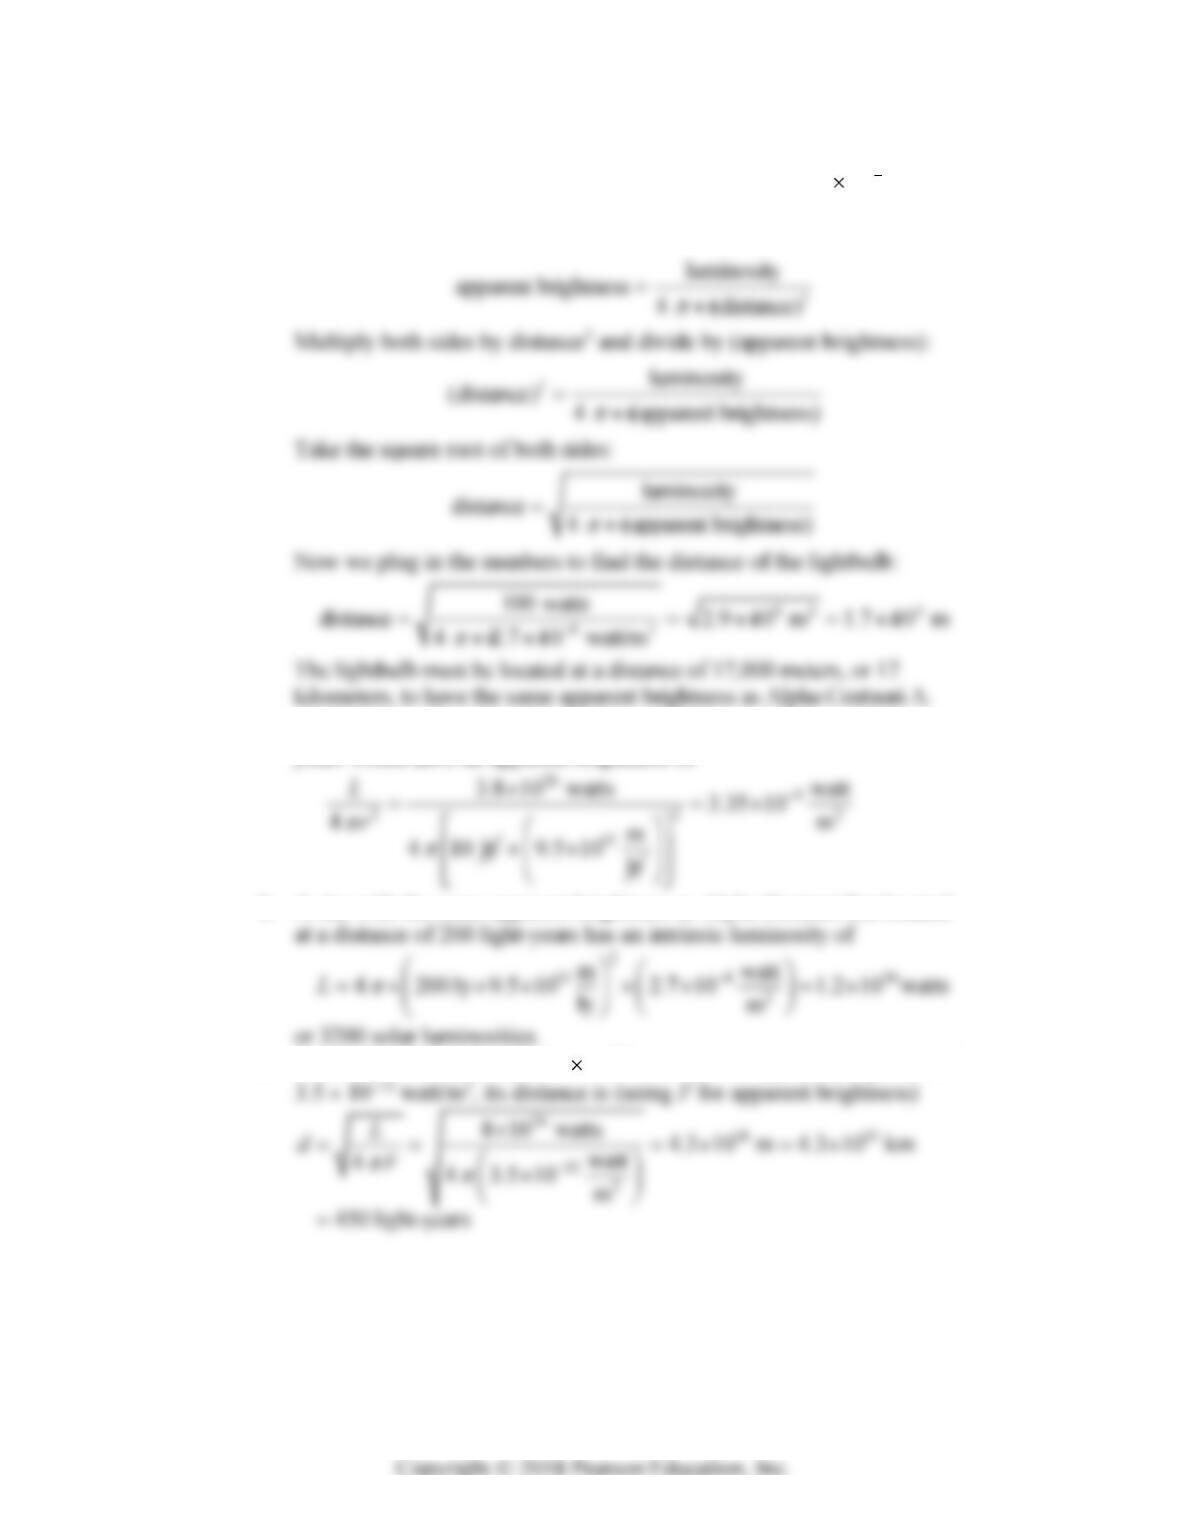
b. In this problem, we must solve for the distance of a lightbulb with a
luminosity of 100 watts and an apparent brightness of 2.7 10 8
watt/m2. First, we solve the formula for the distance. We begin with the
formula for the inverse square law:
48. a. A star with the same luminosity as our Sun but at a distance of 10 light–
years would have an apparent brightness of
b. A star with the same apparent brightness as Alpha Centauri but located
c. If a star has a luminosity of 8 1026 watts and an apparent brightness of
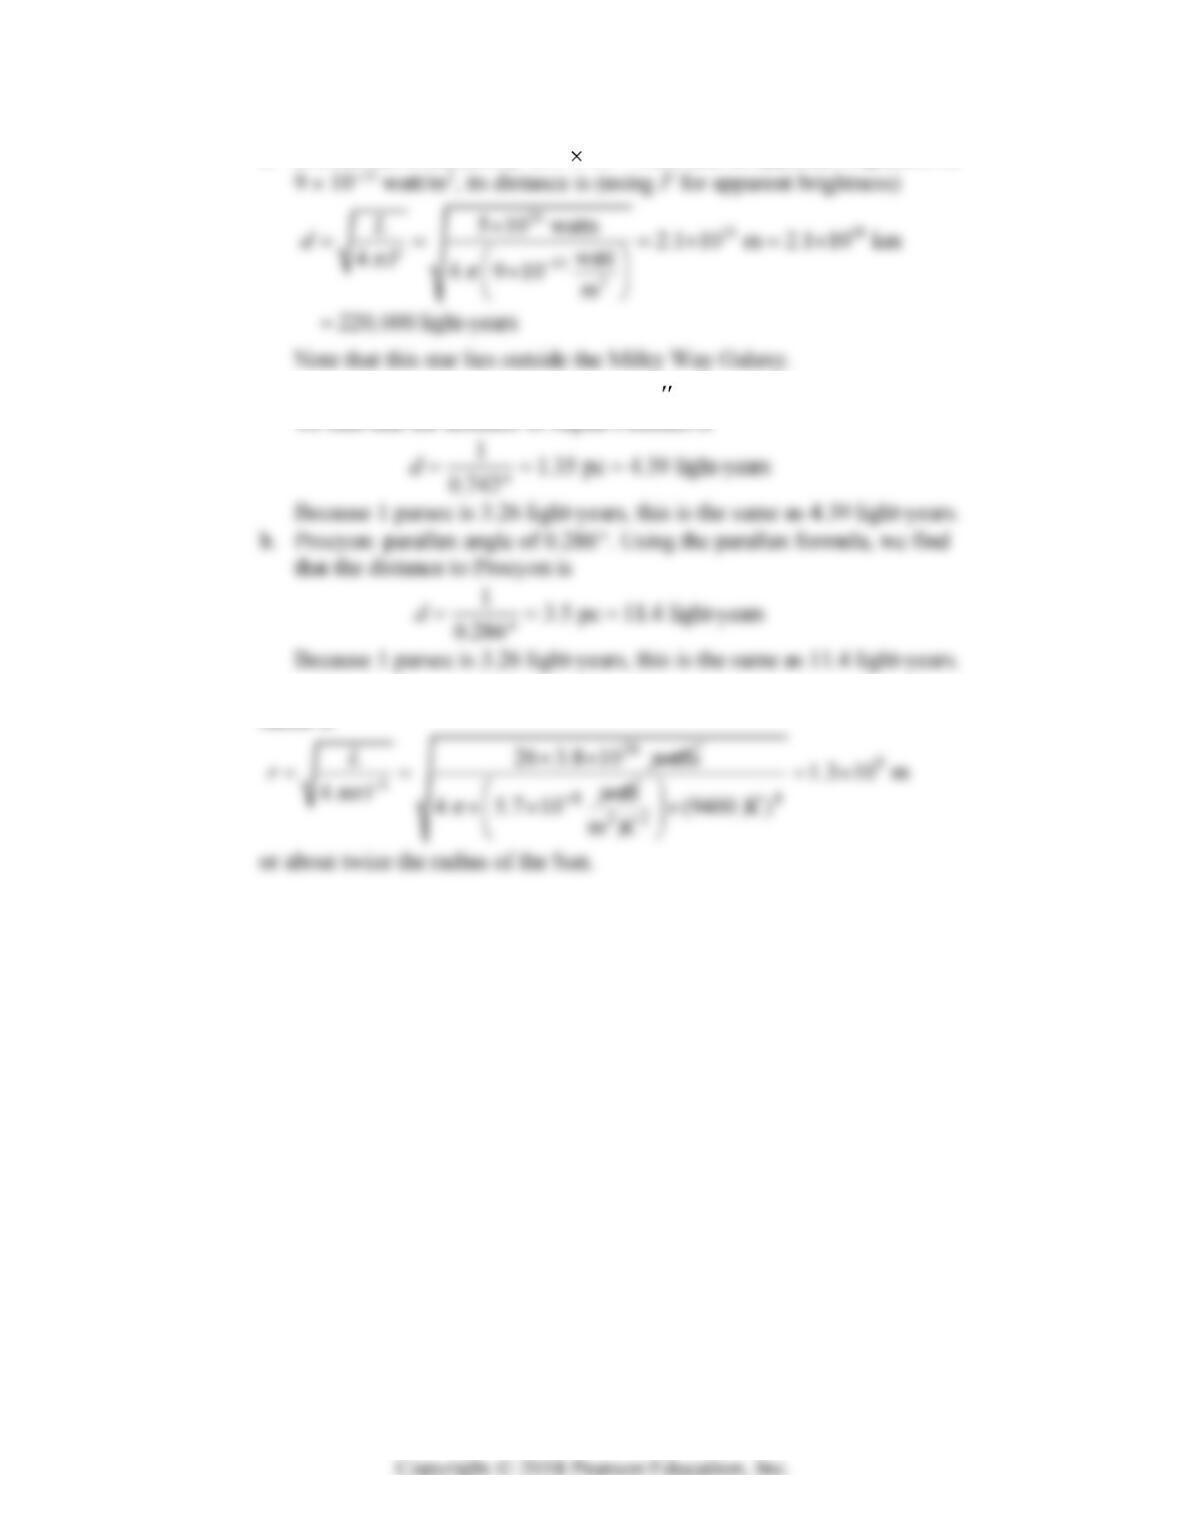
Instructor Guide for The Essential Cosmic Perspective, Eighth Edition 163
d. If a star has a luminosity of 5 1029 watts and an apparent brightness of
49. a. Alpha Centauri: parallax angle of 0.742 . Using the parallax formula,
we find that the distance to Alpha Centauri is
50. Sirius has a luminosity of 26LSun and a surface temperature of 9400 K, so its
radius is