Requirement 9-d
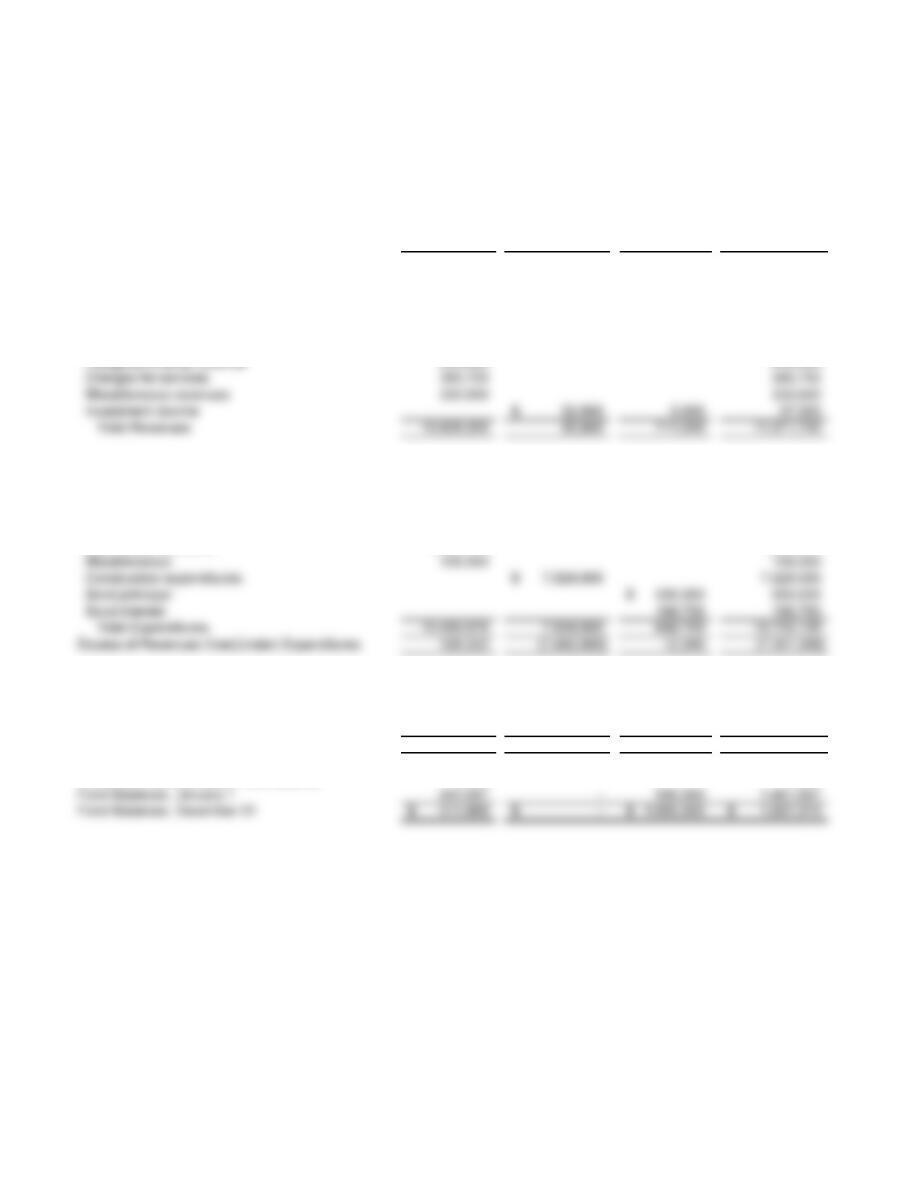
City Hall Annex Total
General Construction Debt Service Governmental
Fund Fund Fund Funds
Revenues
Taxes—property 7,680,000$ 705,400$ 8,385,400$
Taxes—sales 775,590 775,590
Interest and penalties on taxes 22,860 630 23,490
Licenses and permits 479,000 479,000
Fines and forfeits 519,000 519,000
Expenditures
General government 2,606,816$ 2,606,816$
Public safety 3,779,294 3,779,294
Public works 1,778,281 1,778,281
Health and welfare 1,162,873 1,162,873
Culture and recreation 1,064,614 1,064,614
Other Financing Sources (Uses) –
Premium on bonds 50,225 50,225
Proceeds of bonds 7,500,000 7,500,000
Interfund transfers (75,000) (8,000) 83,000 –
Total Other Financing Sources/Uses (75,000) 7,492,000 133,225 7,550,225
Increase (Decrease) in Fund Balances 53,322 – 145,505 198,827
City of Bingham
Statement of Revenues, Expenditures and Changes in Fund Balances
Governmental Funds
For the Year Ended December 31, 2023
Requirement 9-d
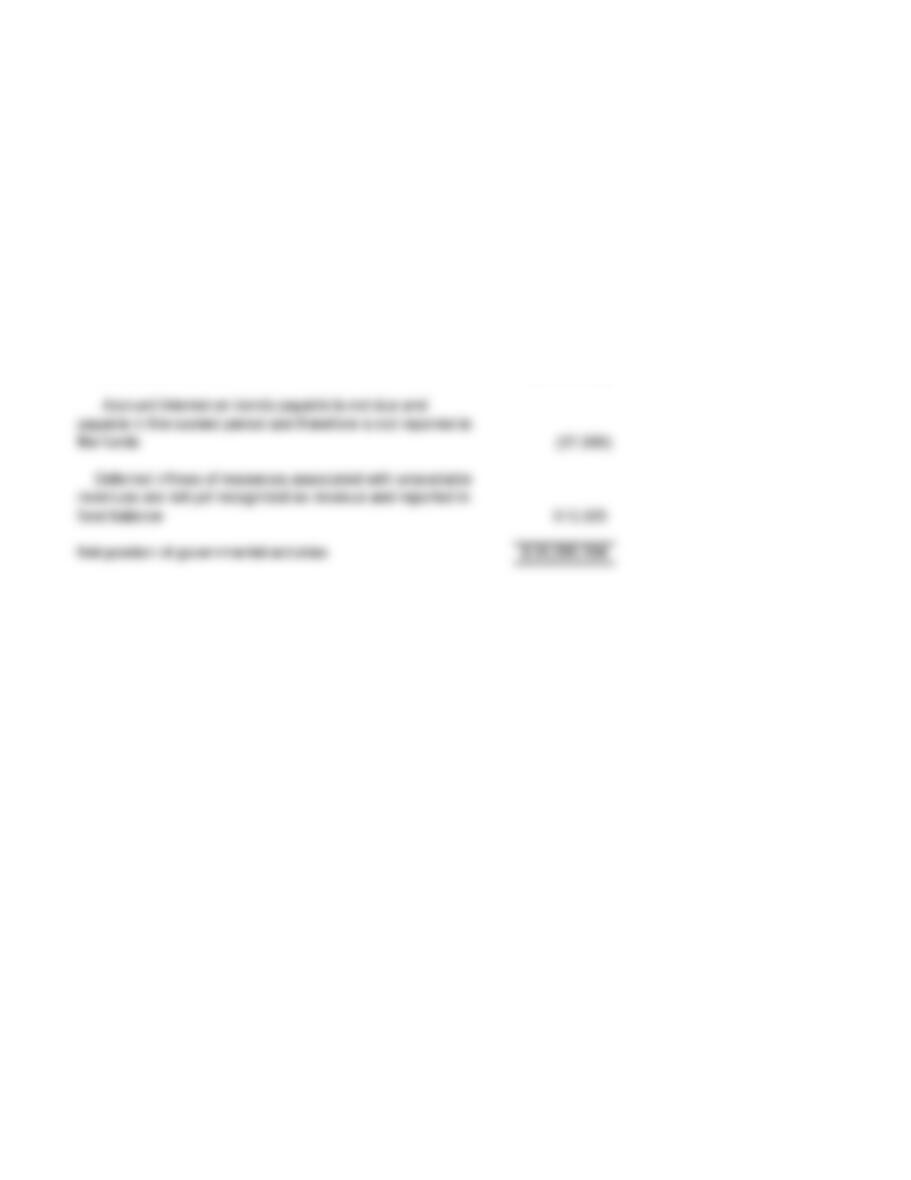
Total fund balances 1,607,474$
Capital assets used in governmental activities are not
financial resources and therefore are not reported in in the
funds
37,511,475
Long-term liabilities, including unamortized premium, are
not due and payable in the current period and therefore are
not reported in the funds
(11,328,610)
Accrued interest on bonds payable is not due and
Deferred inflows of resources associated with unavailable
fund balance
City of Bingham
Reconciliation of the Governmental Funds Balance Sheet
to the Government-wide Statement of Net Position
As of December 31, 2023
Requirement 9-d
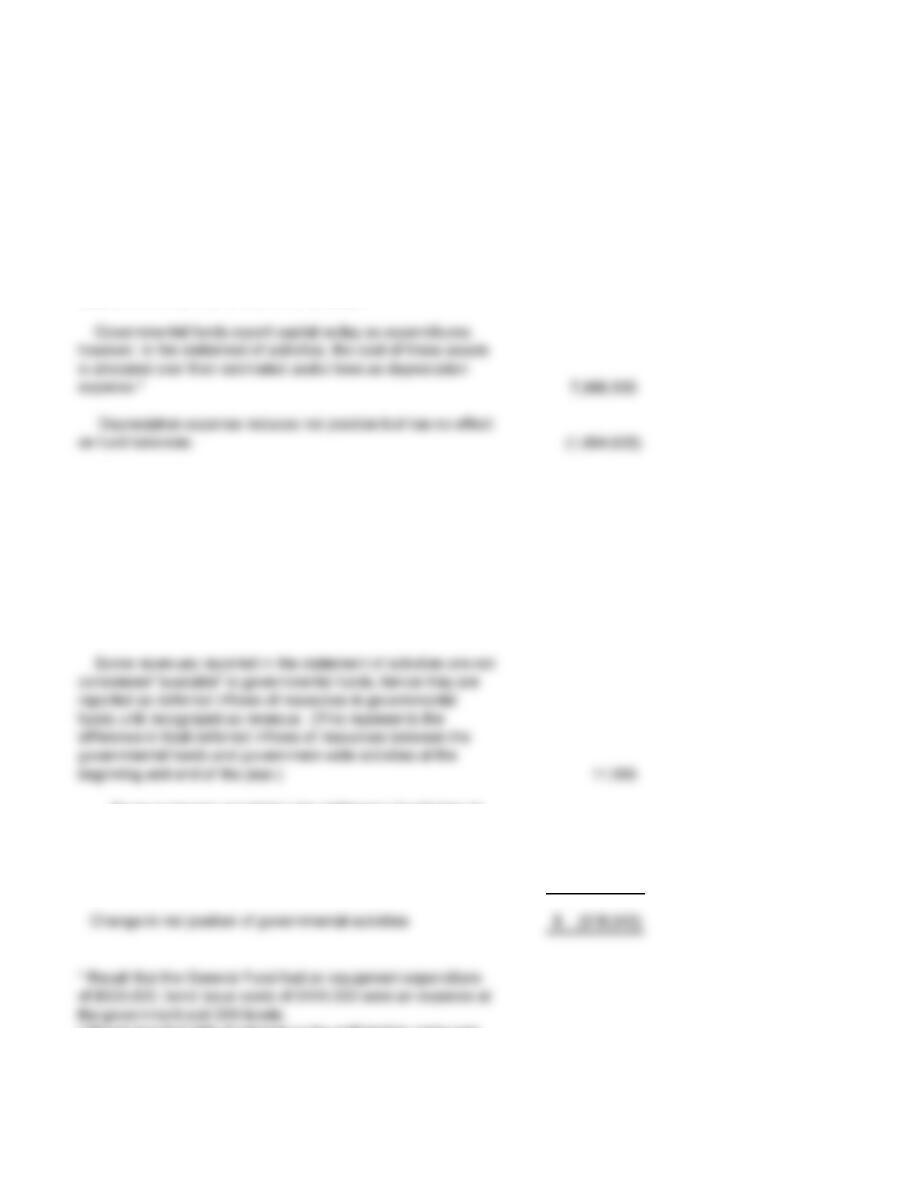
Net changes in fund balances—total governmental funds 205,827$
Amounts reported for the governmental activities in the
statement of activities are different because:
Depreciation expense reduces net position but has no effect
on fund balances.
Bond proceeds provide current financial resources to
governmental funds, but issuing debt increases long-term
liabilities in the statement of net position. Repayment of bond
principal is an expenditure in the governmental funds, but the
repayment reduces long-term liabilities in the statement of net
position. There was $500,000 repayment of bond principal
during the year, new bonds of $7,550,225 were issued
(includes unamortized premium of $50,225).
(7,050,225)
beginning and end of the year.)
Some expenses reported in the statement of activities do
not require the use of current financial resources and therefore
are not reported as expenditures in governmental funds.
Interest expense exceeded interest expenditures by $21,985,
which includes $15,515 of premium that was amortized.**
(21,985)
the government and GW levels.
**Recall that $10,000 of interest on tax anticipation notes was
recorded as a miscellaneous expenditure in the General Fund.
City of Bingham
Reconciliation of the Statement of Revenues, Expenditures,
and Changes in Fund Balances of Governmental Funds
to the Government-wide Statement of Activities
For the Year Ended December 31, 2023
Requirement 9-d
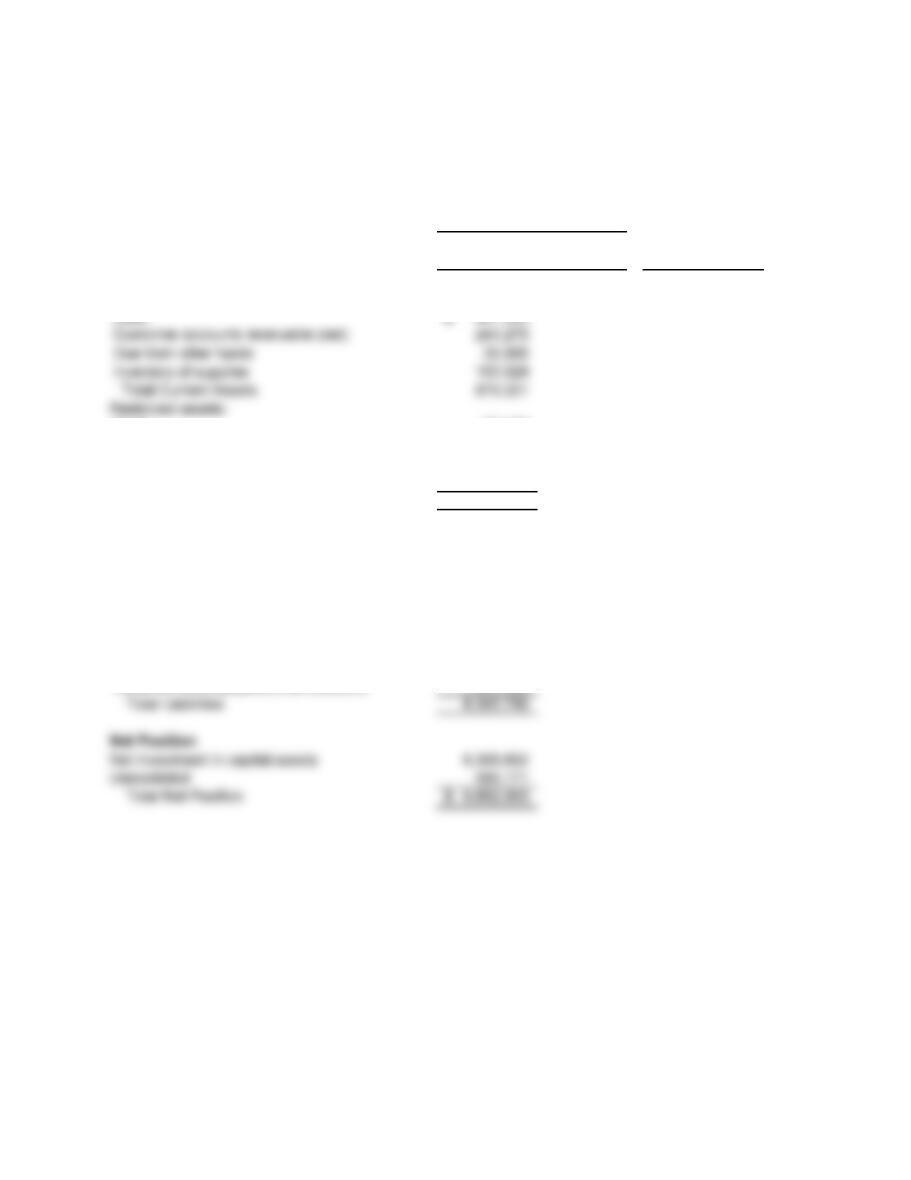
Water Utility
Fund
Totals
Assets
Current assets:
Cash 80,198
Utility plant:
Utility plant in service (net) 13,312,579
Construction work in progress 925,695
Total Assets 15,197,793
Liabilities
Current liabilities:
Vouchers payable 174,150
Accrued interest payable 120,000
Total Current Liabilities 294,150
Liabilities payable from restricted assets:
Customer deposits 80,198
Long-term liabilities:
Internal Service
Funds
City of Bingham
Statement of Net Position
Proprietary Funds
As of December 31, 2023
Business-type Activities
Governmental
Customer accounts receivable (net) 241,275
Requirement 9-d
Water Utility
Fund
Totals
Operating Revenue
Operating Expenses
Operation 842,804
Maintenance 439,400
Depreciation expense 315,637
Total operating expenses 1,597,841
Operating Income 1,642,936
Non-operating Expenses
Interest on long-term debt 265,462
Internal Service
Funds
City of Bingham
Statement of Revenue, Expenses, and Changes in Net Position
Proprietary Funds
For the Year Ended December 31, 2023
Business-type Activities
Governmental
Requirement 9-d
Water Utility
Fund
Totals
Cash flows from operating activities:
Cash received from customers 3,167,054$
Cash paid to employees for services (815,150)
Cash flows from capital and related financing
activities:
Construction of utility plant (867,500)
Interest paid on long-term bonds (262,500)
Net cash used in capital and related financing activities: (1,130,000)
Operating Income 1,642,936$
Adjustments:
Depreciation expense 315,637
Increase in net accounts receivable (57,427)
Increase in due from other funds (15,600)
Decrease in inventories 600
Increase in vouchers payable 81,600
Internal Service
Funds
Reconciliation of Operating Income to Net Cash Provided
City of Bingham
Statement of Cash Flows
Proprietary Funds
For the Year Ended December 31, 2023
Business-type Activities
Governmental
Indicator (Ill. 10-3) Formula Source Values Calculation
Revenue Measures:
Total operating revenues General fund financial statements 11,334,230$
Population Provided in problem 10,000
Total General Fund revenues General fund financial statements 10,628,200$
Expenditures Measures:
Total operating expenditures* General fund financial statements 10,573,628$
Population Provided in problem 10,000
Number of municipal employees Provided in problem 159
Population (or households) Provided in problem 10,000
Operating Position Measures:
Total operating revenues Governmental fund financial statements 11,334,230$
Total operating expenditures* Governmental fund financial statements 10,573,628$
General Fund operating surplus/deficit* General fund financial statements 753,322$
General Fund operating revenues General fund financial statements 10,628,200$
General Fund balances General fund financial statements 511,969$
General Fund operating revenues General fund financial statements 10,628,200$
Current liabilities Governmental fund financial statements 316,396$
Debt Indicators:
Current liabilities Governmental fund financial statements 316,396$
Operating revenues Governmental fund financial statements 11,334,230$
General Fund operating revenues General fund financial statements 10,628,200$
Capital Plant Indicators:
Capital outlay from operating funds Governmental fund financial statements 7,649,500$
Operating expenditures Governmental fund financial statements 10,573,628$
Performance Measure (Ill. 10-4)
Financial Position:
Unrestricted net position Government-wide financial statements 1,025,294$
Total governmental activities revenue Government-wide financial statements 11,383,295$
Chapter 10 – Ratio Analysis
5) Revenues over expenditures 1.072
1) Revenues per capita 1133.423
4) Employees per capita 0.016
6) Operating surplus/deficit 0.071
9) Current liabilities 0.028
Unrestricted net position 0.090
11) Capital Outlay 0.723
1)
Governmental activities current assets Government-wide financial statements 2,437,195$
Governmental activities current liabilities** Government-wide financial statements 1,603,896$
Financial Performance:
Total ending net position (governmental activities)
– beginning net position
Government-wide financial statements (618,943)$
Total beginning net position (governmental activities
Government-wide financial statements 28,885,106$
Financial Capability:
Long-term debt-Self-supporting debt Government-wide financial statements 11,328,610$
Assessed Valuation Provided in problem 1,409,090,909$
General obligation bonded debt Government-wide financial statements 11,328,610$
Population Provided in problem 10,000
General obligation bonded debt Government-wide financial statements 11,328,610$
Legal debt limit Calculated in chapter 6 of problem 70,454,545$
Property tax levy Chapters 4 and 6 or Chapter 8 8,454,545$
Population Provided in problem 10,000
GW ledger 33,588,025$
4) Change in net position -0.021
3) Current ratio 1.520
7) Long-term debt 0.80%
11) Property taxes per capita 845.455
10) Available legal debt limit 0.161
Chapter 10 Interpretation of Ratios
(Note to Instructor – It is not expected that your students would need to prepare all of the
following ratios.)
Ratios from Illustration 10-3:
1) Revenues per capita – In this fictional city, revenues per capita equal $1,133.42, of which
property tax per capita is $845.45 (#11 below). Expenditures per capita (#3) average $1,057.36.
This is best analyzed over several years.
3) Expenditures per capita – Expenditures per capita average $1,057.36, compared to revenues
per capita of $1,133.42.
4) Employees per capita – The .016 indicates that the City employs only a small percentage of
the population. This is best analyzed over several years.
7) Fund balances – At a ratio of .048, the fund balances ratio is less than .05. Generally, a ratio
of .05 or less is considered a red flag by creditors. (Instructor Note: For credit purposes, many
governments have a policy of maintaining fund balance ratios of .10 – .15.)
10) Debt service – Bingham’s debt service ratio is relatively low at .066. A warning value would
be .20 or greater.
11) Capital Outlay – Bingham’s capital outlay is relatively high, indicating that 72.3% of
operating expenditures are spent on capital assets.
Ratios from Illustration 10-4:
2) Debt ratio – At a ratio of .294, approximately 29.2% of the city’s assets are held by creditors,
the rest of the assets are held by the citizens.
3) Current ratio – The current ratio for Bingham is 1.52, indicating a stable financial position
ratio; however, this ratio should be monitored. (Instructor Note: Although 1.0 is considered
an acceptable benchmark current ratio in business, a ratio of 2.0 is often considered for
governments.)
6) BTA self–sufficiency – The ratio of 1.739 indicates that the water utility revenues are more
than covering expenses.
7) Long-term debt – This measure of .8% is well below a 10% warning sign.
8) Pension funded ratio – N/A
10) Available legal debt limit – At a ratio of .161, Bingham is well below the available legal
debt limit.
11) Property taxes per capita – In this fictional city, revenues per capita equal $1,133.42 (#1
above), of which property tax per capita is $845.45. Expenditures per capita (#3 above)
average $1,057.36. This is best analyzed over several years.
Overall the City of Bingham seems to be in an acceptable financial position. The ratios indicate
that the city will be able to cover its obligations in the short term and the liquidity ratio is
currently quite strong. The financial condition of the city is stable; however, revenues are just
Chapter 11 Preparation of Audit Report
An unmodified auditor’s report appears to be appropriate for the City of Bingham for the year
An unmodified audit report on the City of Bingham should appear as follows:
Independent Auditor‘s Report
To the Honorable Mayor, City Council, and City Manager of the City of Bingham
Report on the Financial Statements
We have audited the accompanying financial statements of the governmental activities, the
business-type activities, the aggregate discretely presented component units, each major fund,
and the aggregate remaining fund information of the City of Bingham, as of and for the year
Management’s Responsibility for the Financial Statements
Management is responsible for the preparation and fair presentation of these financial statements
in accordance with accounting principles generally accepted in the United States of America; this
Auditor’s Responsibility
Our responsibility is to express opinions on these financial statements based on our audit. We
conducted our audit in accordance with auditing standards generally accepted in the United
States of America. Those standards require that we plan and perform the audit to obtain
reasonable assurance about whether the financial statements are free from material misstatement.
An audit involves performing procedures to obtain audit evidence about the amounts and
disclosures in the financial statements. The procedures selected depend on the auditor’s
We believe that the audit evidence we have obtained is sufficient and appropriate to provide a
basis for our audit opinions.
Opinions
In our opinion, the financial statements referred to above present fairly, in all material respects,
the respective financial position of the governmental activities, the business-type activities, each
—End—