255
CHAPTER 9
FINANCIAL STATEMENT ANALYSIS
CLASS DISCUSSION QUESTIONS
1. Horizontal analysis is the percentage analy-
sis of increases and decreases in compara-
tive financial statements. Each item on the
most recent statement is compared with the
related item on one or more earlier state-
ments in terms of the following:
a. Amount of increase or decrease.
2. Comparative statements provide information
as to changes between dates or periods.
Trends indicated by comparisons may be far
more significant than the data for a single
date or period.
3. Before this question can be answered, the
increase in net income should be compared
4. You should first determine if the expense
amount in the base year (denominator) is
significant. A 70% or more increase of a
very small expense item may be of little
concern. However, if the expense amount in
the base year is significant, then over a 70%
increase may require further investigation.
5. Generally, the two ratios would be very
capital, gives a better analysis of the current
position. Such a comparison shows:
Current Preceding
Year Year
Working capital ……. $162,000 $138,000
Current ratio ……….. 2.8 3.3
Walmart. Such sales are “on account,” and
thus create accounts receivable that must
be collected. A recent financial statement
showed Walmart’s accounts receivable turn-
ing 64 times, while Procter & Gamble’s
turned only 6 times.
8. No, an accounts receivable turnover of 9
with sales on an n/30 basis is not satisfacto-
collectibility on the books.
9. a. A high inventory turnover minimizes the
amount invested in inventories, thus
freeing funds for more advantageous
use. Storage costs, administrative ex-
penses, and losses caused by obsoles-
cence and adverse changes in prices
c. No. The inventory turnover ratio and the
number of days’ sales in inventory ratio
are interrelated. Both ratios are comput-
ed using the average inventory [(Begin-
ning Inventory + Ending Inventory) ÷ 2]
and the cost of goods sold. Specifically,
365 days divided by the inventory turn-
over ratio equals the number of days’
sales in inventory.
10. The ratio of fixed assets to long-term liabilities
increased from 3.6 ($1,260,000 ÷ $350,000)
11. a. The rate earned on total assets adds
interest expense to the net income,
holders’ investment.
b. The rate earned on stockholders’ equity
is normally higher than the rate earned
on total assets. This is because of lev-
erage, which compensates stockholders
for the higher risk of their investments.
12. a. Due to leverage, the rate on stockhold-
ers’ equity will often be greater than
b. Higher. The concept of leverage applies
to preferred stock as well as debt. The
rate earned on common stockholders’
equity ordinarily exceeds the rate
earned on total stockholders’ equity
because the amount earned on assets
acquired through the use of funds pro-
vided by preferred stockholders normal-
ly exceeds the dividends paid to pre-
ferred stockholders.
13. The earnings per share in the preceding
14. A share of common stock is currently selling
15. The dividend yield on common stock is a
measure of the rate of return to common
stockholders in terms of cash dividend dis-
16. During periods when sales are increasing, it
is likely that a company will increase its
inventories and expand its plant. Such situa-
tions frequently result in an increase in
current liabilities out of proportion to the
increase in current assets and thus lower
the current ratio.
17. One report is the Report on Internal Control,
which verifies management’s conclusions on
257
EXERCISES
E9–1
a.
SEARLE TECHNOLOGIES CO.
Comparative Income Statement
For the Years Ended December 31, 20Y8 and 20Y7
20Y8 20Y7
Amount Percent Amount Percent
Sales …………………………………….. $ 900,000 100.0% $ 725,000 100.0%
Cost of goods sold ………………… 558,000 62.0 435,000 60.0
Gross profit …………………………... $ 342,000 38.0% $ 290,000 40.0%
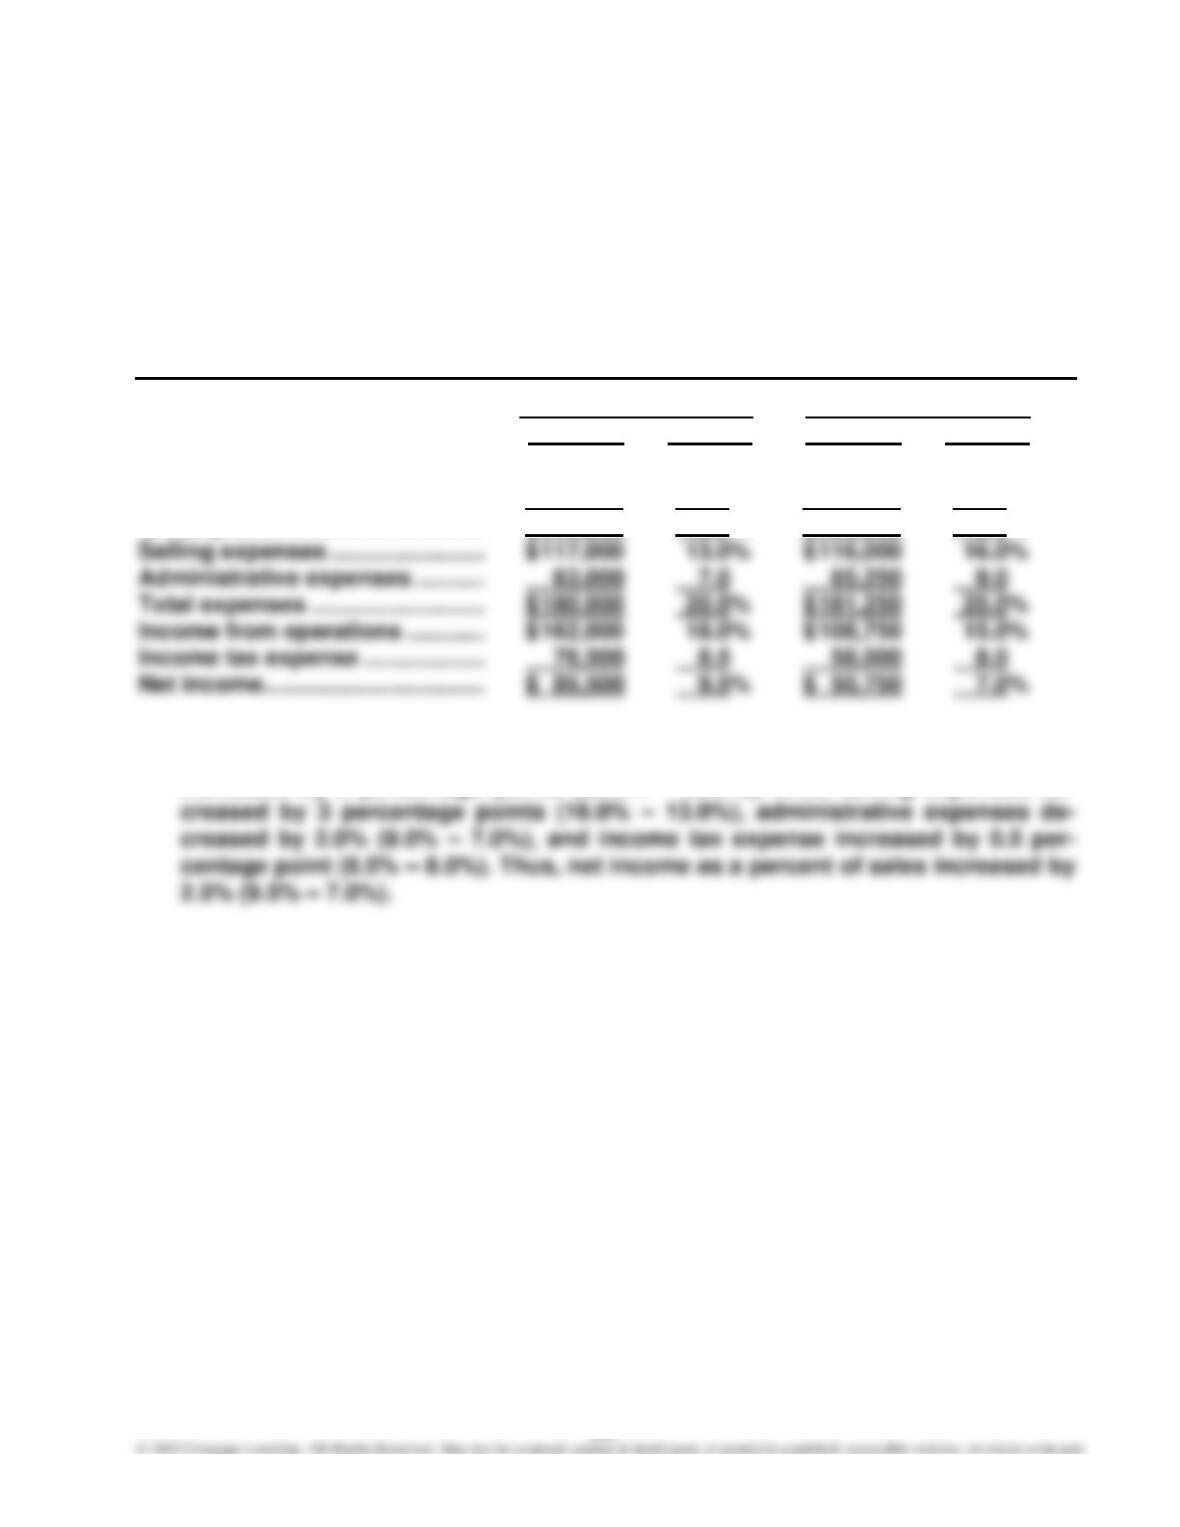
b. The vertical analysis indicates that the cost of goods sold as a percent of sales
increased by 2 percentage points (62.0% – 60.0%), while selling expenses de-
E9–2
a.
SPEEDWAY MOTORSPORTS, INC.
Comparative Income Statement (in thousands of dollars)
Year 2 Year 1
Revenues:
Admissions ………………………………. $130,239 25.7% $139,125 27.7%
Event-related revenue ……………….. 163,621 32.3 156,691 31.2
NASCAR broadcasting revenue …. 185,394 36.7 178,722 35.6
Other operating revenue ……………. 26,591 5.3 27,705 5.5
Total revenue ……………………….. $505,845 100.0% $502,243 100.0%
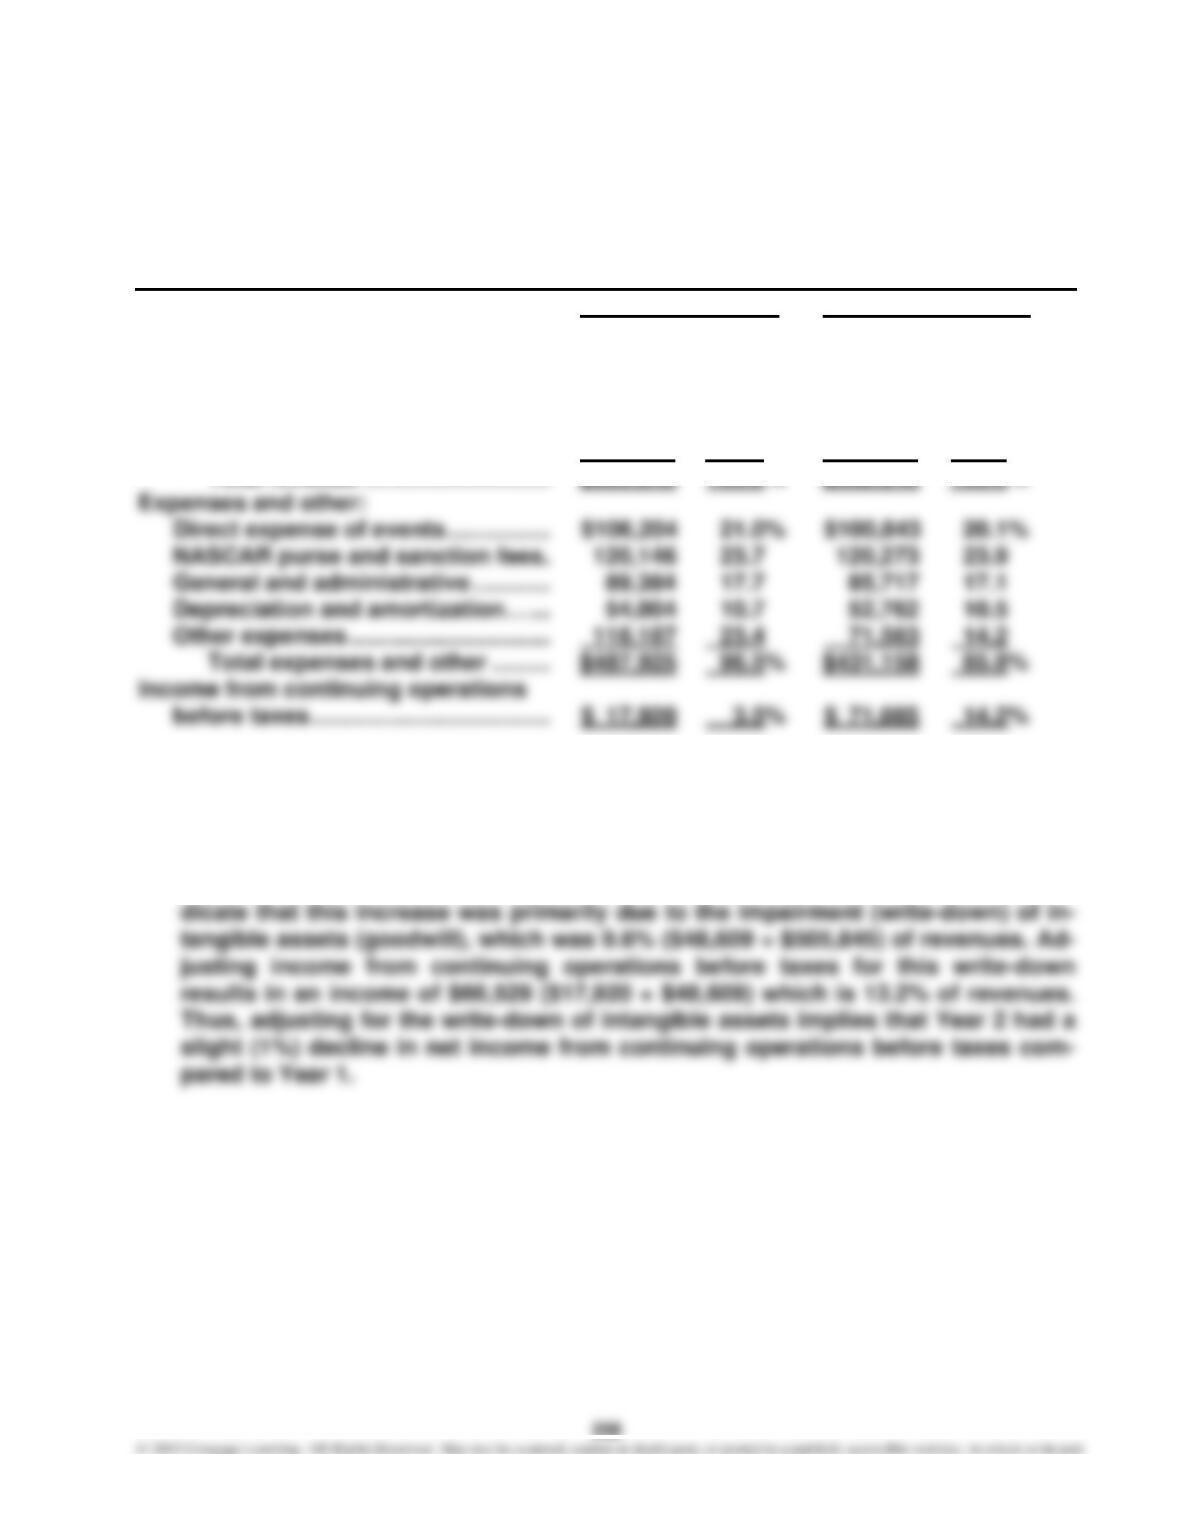
b. Overall revenue remained approximately the same for Years 1 and 2. However,
the total expenses as a percent of total revenue increased by 10.7% (96.5% –
85.8%), which resulted in income from continuing operations before taxes as a
percent of revenue decreasing by 10.7% (14.2% – 3.5%). The largest increase in
expenses occurred in other expenses. The notes to the financial statements in-
E9–3
a.
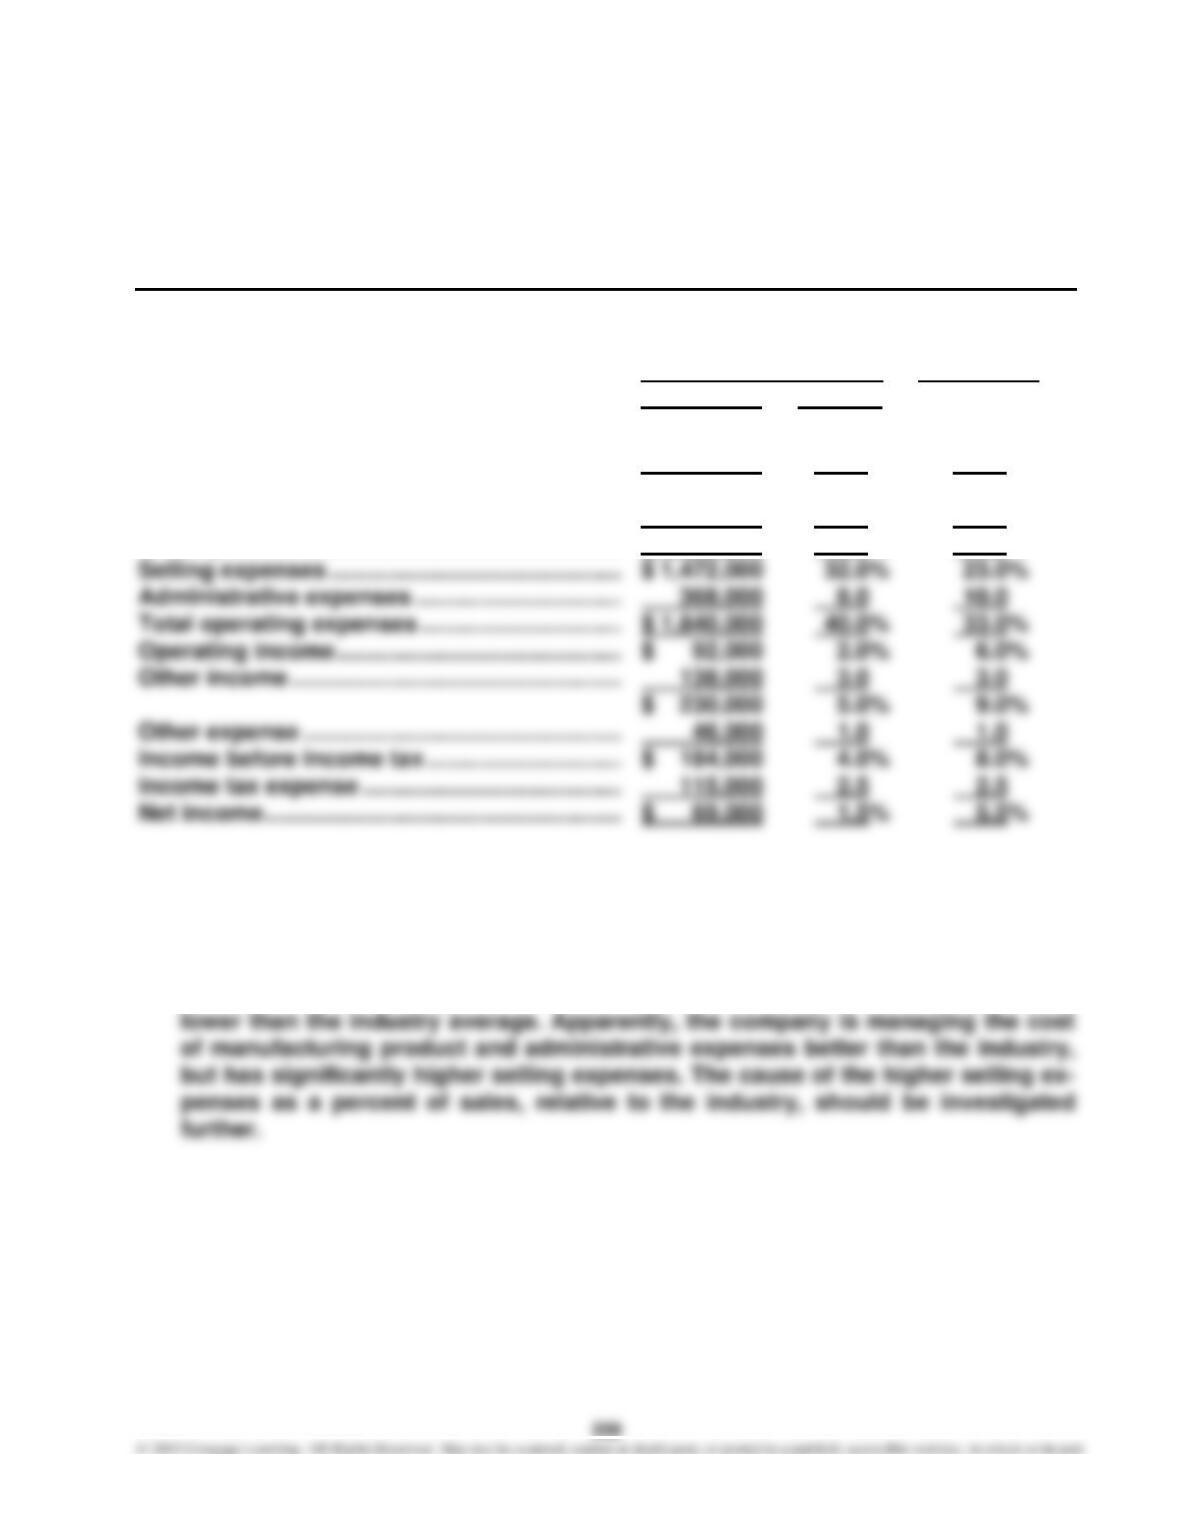
GARRITY ELECTRONICS COMPANY
Common-Sized Income Statement
Garrity Electronics
Electronics Industry
Company Average
Amount Percent
Sales ……………………………………………………….. $ 4,728,800 102.8% 102.5%
Sales returns and allowances …………………… 128,800 2.8 2.5
Net sales …………………………………………………. $ 4,600,000 100.0% 100.0%
Cost of goods sold …………………………………… 2,668,000 58.0 61.0
Gross profit ……………………………………………… $ 1,932,000 42.0% 39.0%
b. The cost of goods sold is 3 percentage points (61.0% – 58.0%) lower than the
industry average, but the selling expenses are 9 percentage points (32.0% –
23.0%) higher than the industry average. Administrative expenses are 2 percent-
age points (10.0% – 8.0%) lower than the industry average. The combined impact
is for net income as a percent of sales to be 4 percentage points (5.5% – 1.5%)
260
E9–4
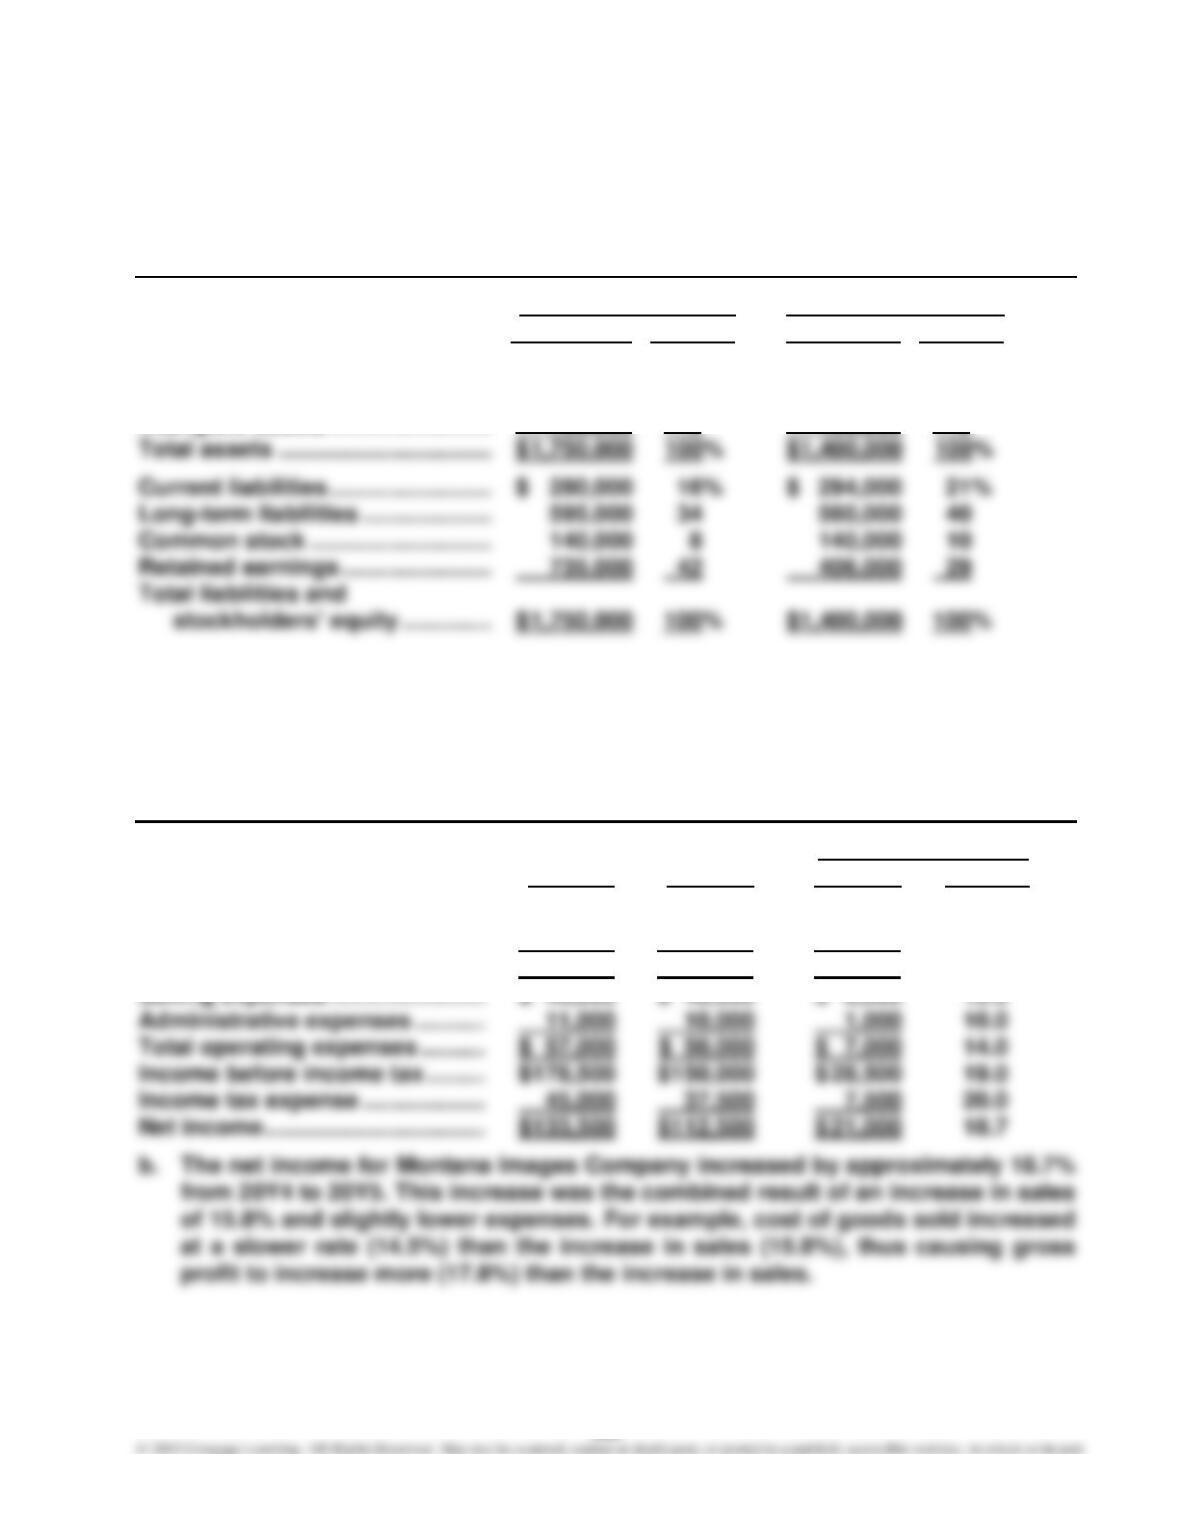
OTTER CREEK COMPANY
Comparative Balance Sheet
December 31, 20Y2 and 20Y1
20Y2 20Y1
Amount Percent Amount Percent
Current assets ……………………….. $ 700,000 40% $ 504,000 36%
Property, plant, and equipment 945,000 54 770,000 55
Intangible assets ……………………. 105,000 6 126,000 9
E9–5
a. MONTANA IMAGES COMPANY
Comparative Income Statement
For the Years Ended December 31, 20Y5 and 20Y4
20Y5 20Y4 Increase (Decrease)
Amount Amount Amount Percent
Sales …………………………………….. $ 579,000 $ 500,000 $ 79,000 15.8%
Cost of goods sold ………………… 343,500 300,000 43,500 14.5
Gross profit …………………………... $ 235,500 $ 200,000 $ 35,500 17.8
E9–6
a. (1) Working Capital = Current Assets – Current Liabilities
20Y9: $700,000 = $1,200,000 – $500,000
20Y8: $480,000 = $880,000 – $400,000
b. The liquidity of Tiger Shapes has improved from the preceding year to the cur-
rent year. The working capital, current ratio, and quick ratio have all increased.
Most of these changes are the result of an increase in current assets.
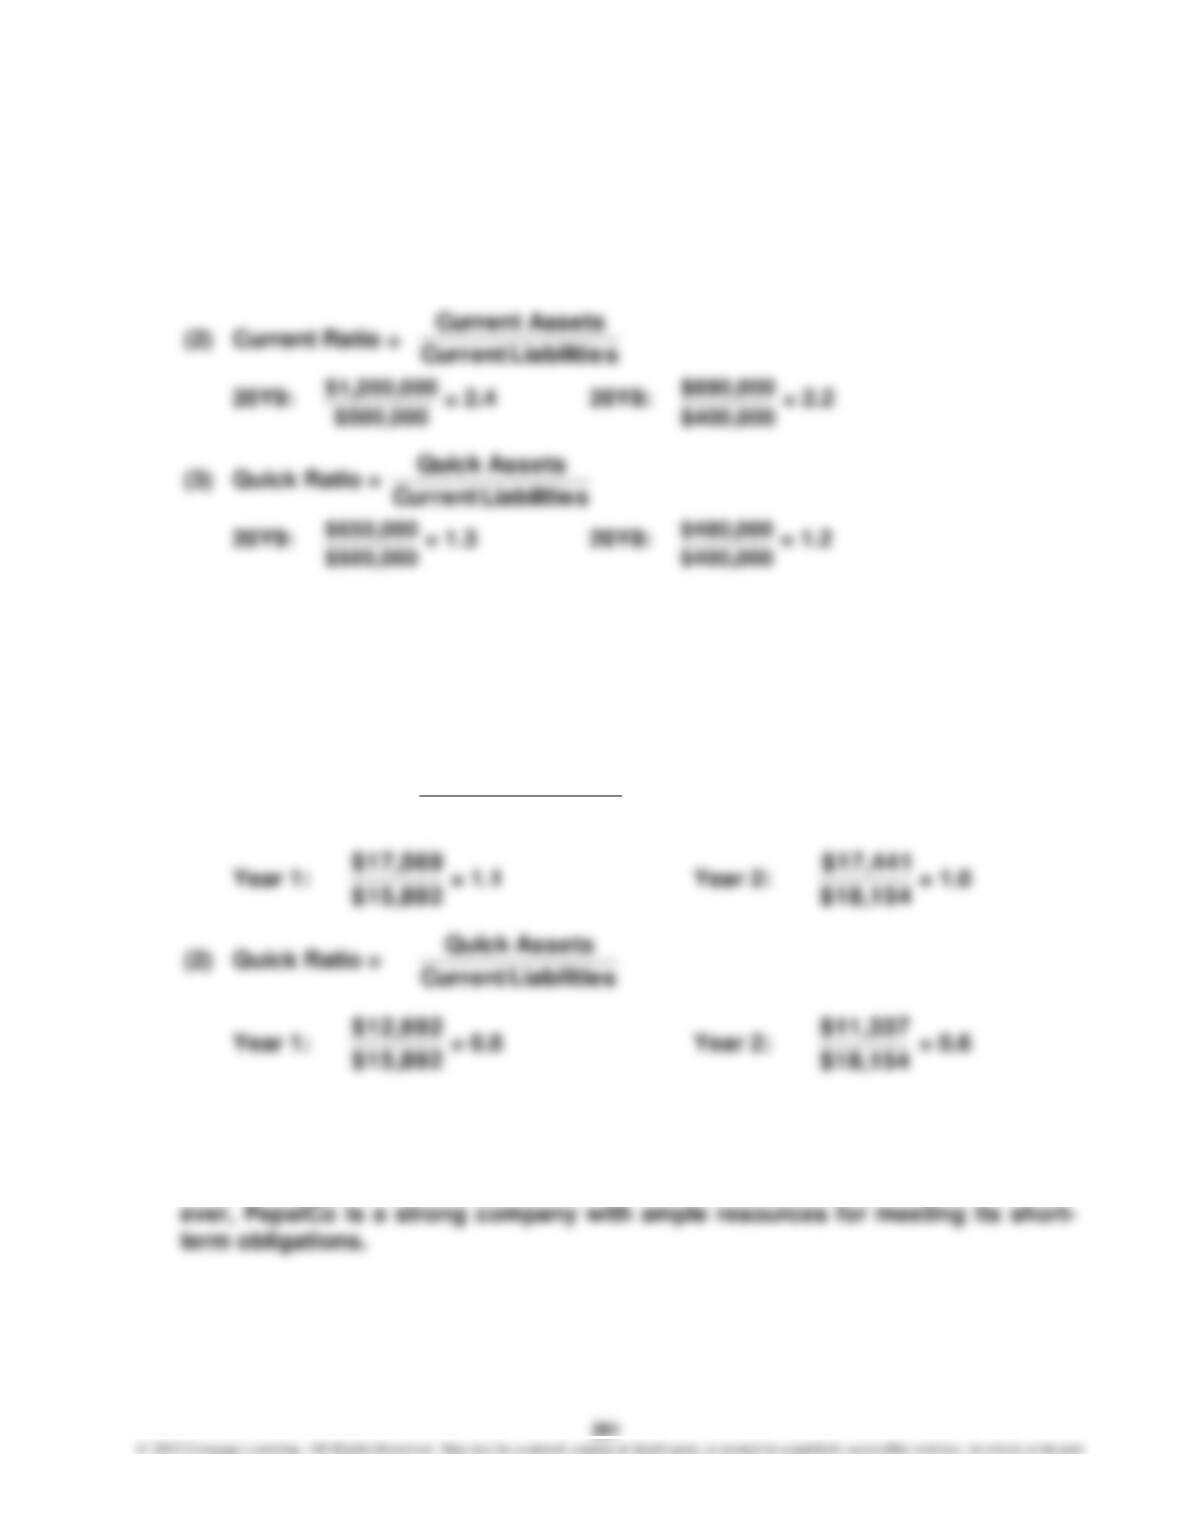
E9–7
a. (1) Current Ratio =
sLiabilitieCurrent
setsCurrent As
b. The liquidity of PepsiCo has decreased some over this time period. Both the cur-
rent and quick ratios have decreased. The current ratio decreased from 1.1 to
1.0, and the quick ratio decreased from 0.8 to 0.6. Despite these decreases, how-
262
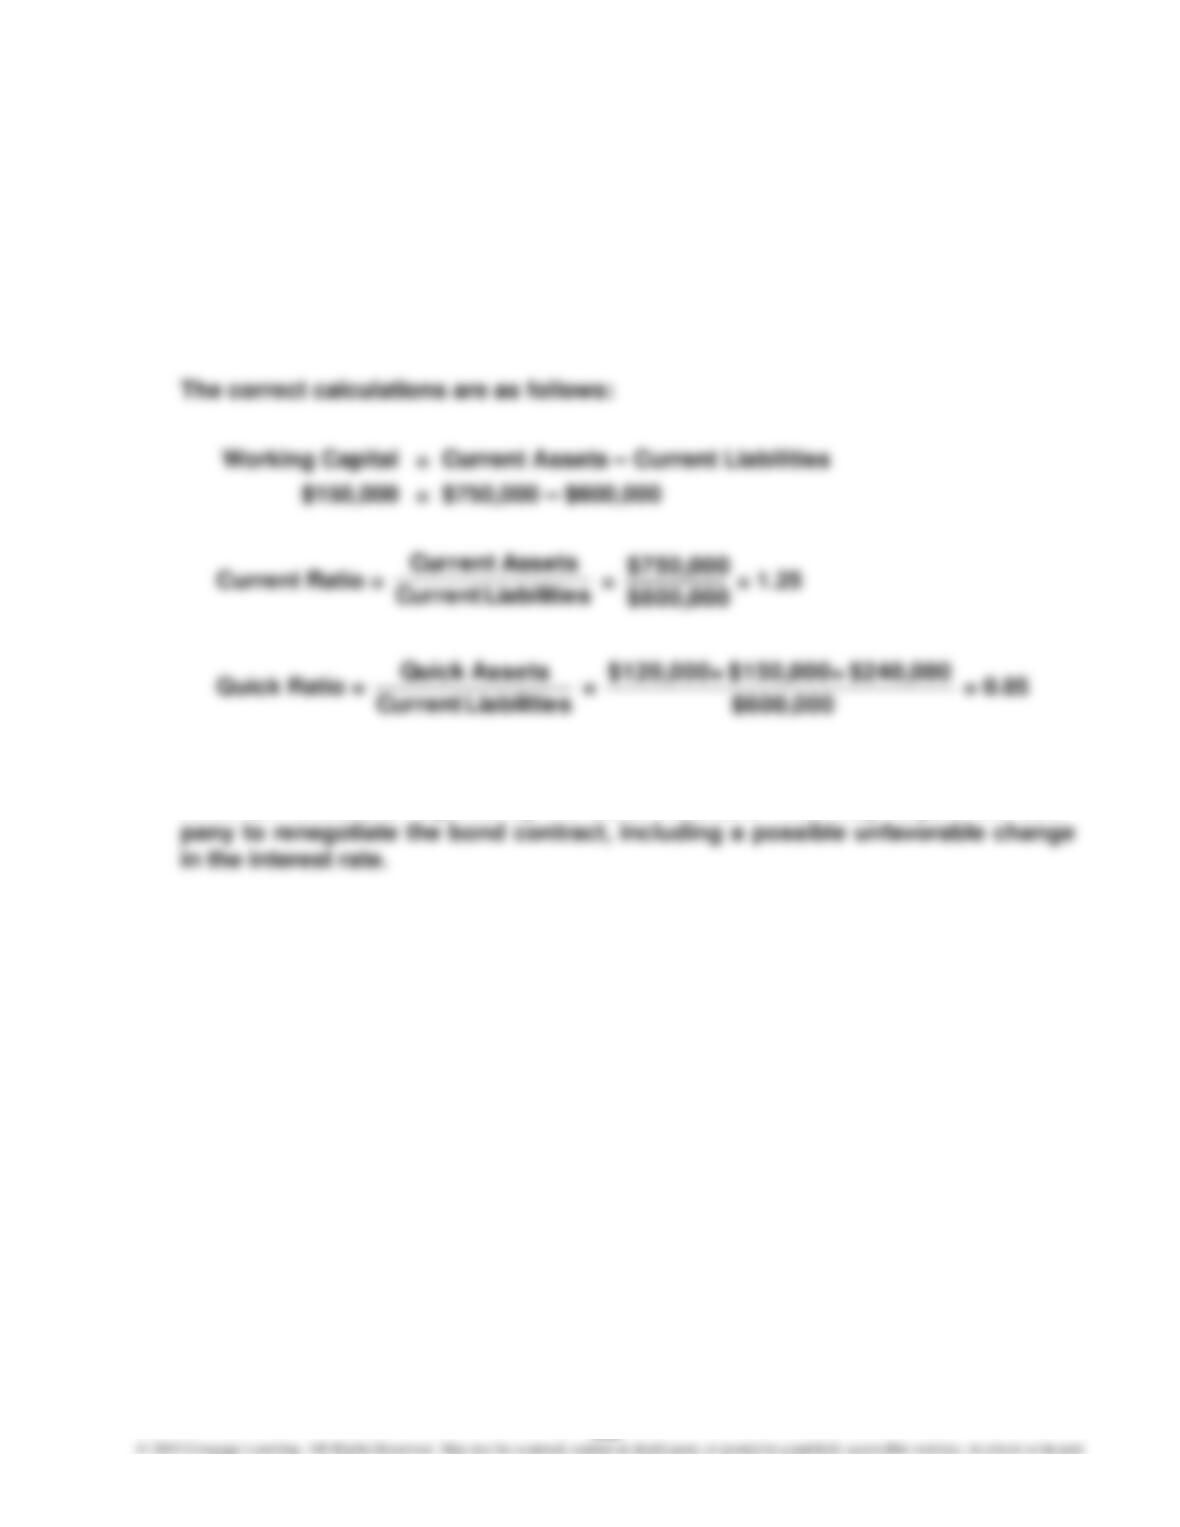
E9–8
a. The working capital, current ratio, and quick ratio are calculated incorrectly. The
working capital and current ratio incorrectly include intangible assets and prop-
erty, plant, and equipment as a part of current assets. Both are noncurrent. The
quick ratio has an incorrect denominator in that it does not include accrued
liabilities. The denominator of the quick ratio should be total current liabilities.
b. Unfortunately, the working capital, current ratio, and quick ratio are all below the
minimum threshold required by the bond indenture. This may require the com-
263
E9–9
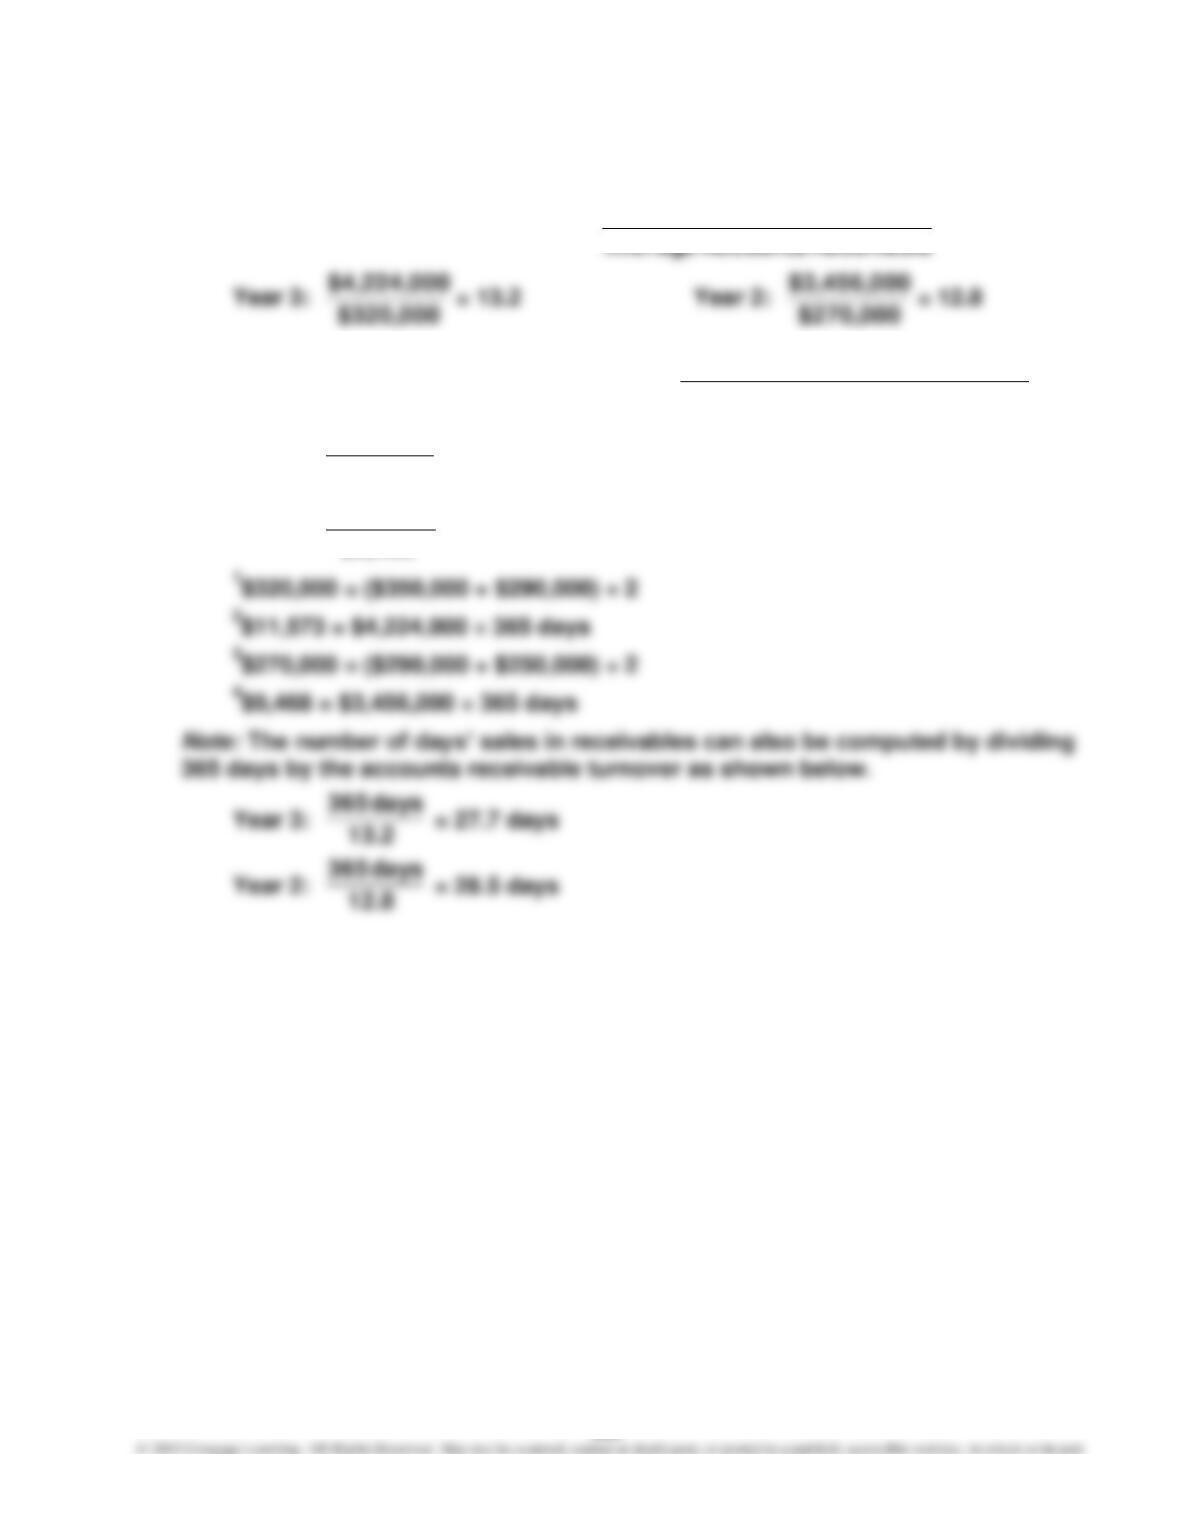
a. (1) Accounts Receivable Turnover =
Accounton SalesNet
(2) Number of Days’ Sales in Receivables =
Accounton Sales Daily Average
Receivable AccountsAverage
Year 3:
2
1
$11,573
$320,000
= 27.7 days
Year 2:
4
3
$9,468
$270,000
= 28.5 days
b. The collection of accounts receivable has improved. This can be seen in both the
increase in accounts receivable turnover from 12.8 to 13.2 and the reduction in
the collection period from 28.5 days to 27.7 days. The credit terms require pay–
ment in 30 days.
E9–10
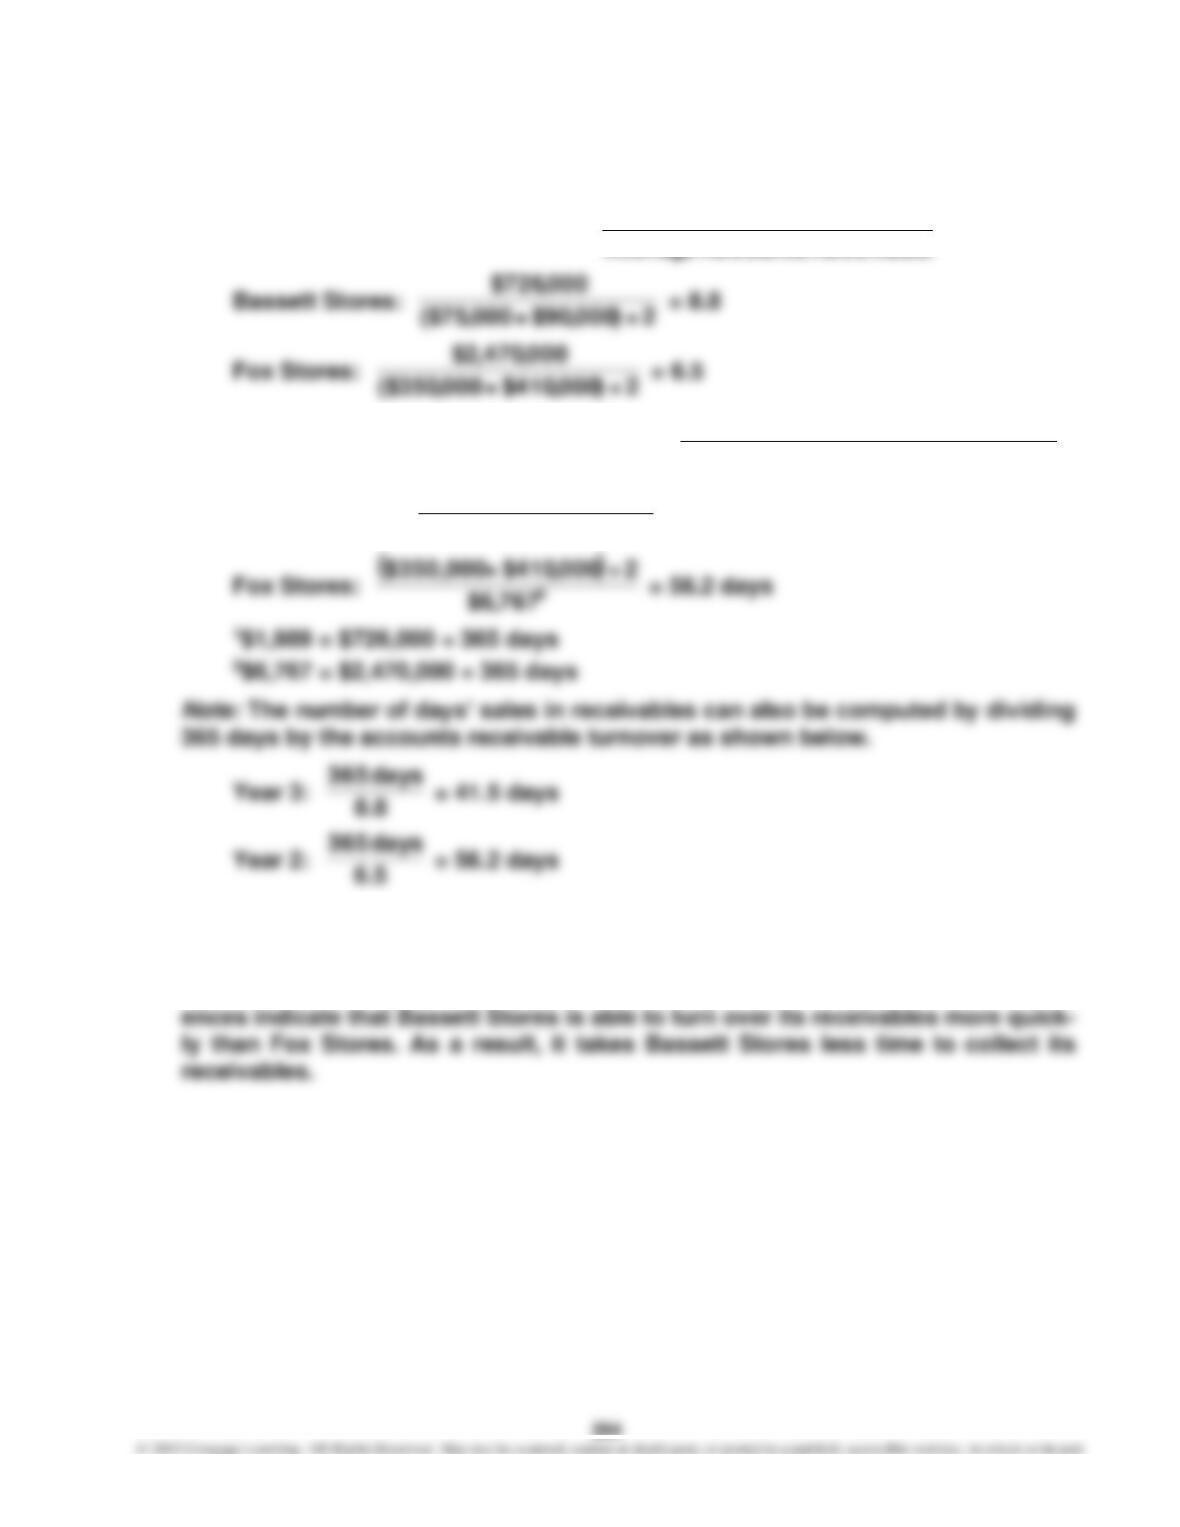
a. (1) Accounts Receivable Turnover =
Receivable AccountsAverage
Accounton SalesNet
(2) Number of Days’ Sales in Receivables =
Accounton Sales Daily Average
Receivable Accounts
Bassett Stores:
( )
1
$1,989
2÷000,90$ + $75,000
= 41.5 days
b. Bassett Stores’ accounts receivable turnover is much higher than Fox Stores
(8.8 compared to 6.5). The number of days’ sales in receivables is lower for Bas-
sett Stores than for Fox Stores (41.5 days compared to 56.2 days). These differ-
265
E9–11
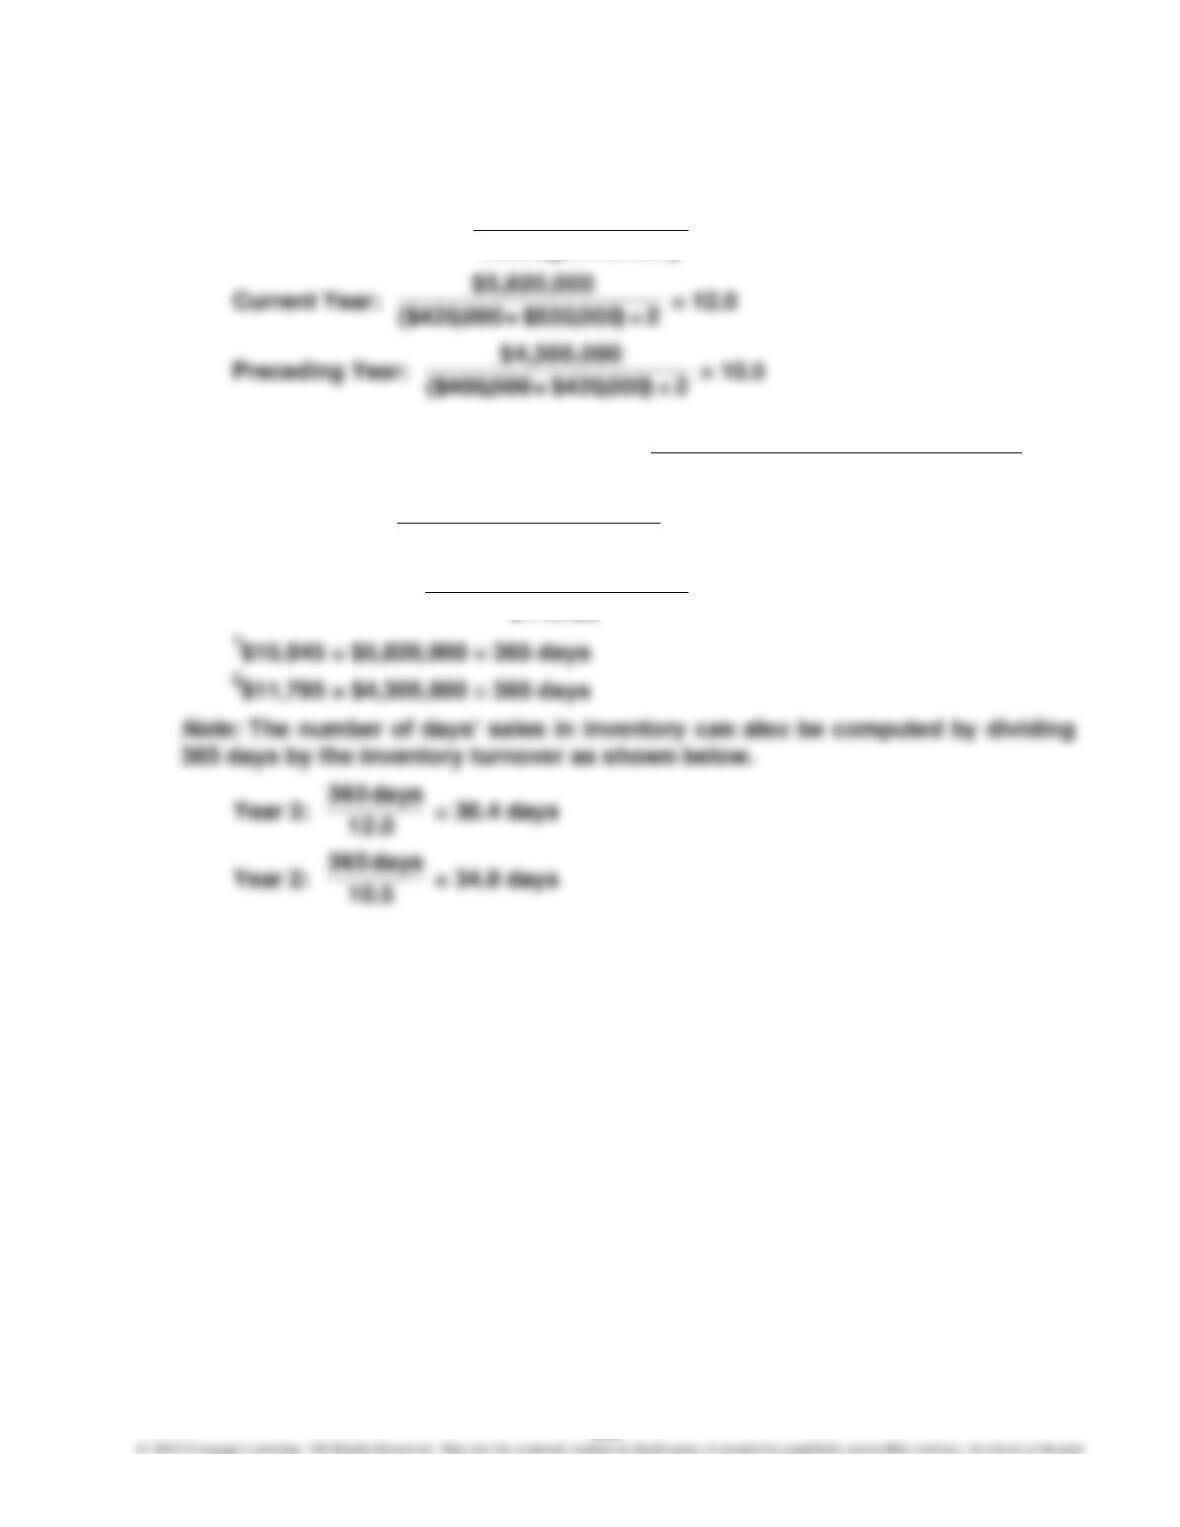
a. (1) Inventory Turnover =
Inventory Average
Sold Goods ofCost
(2) Number of Days’ Sales in Inventory =
Sold Goods ofCost Daily Average
Inventory Average
Current Year:
1
$15,945
2÷)000,550$+000,420($
= 30.4 days
Preceding Year:
2
$11,795
2÷)000,420$+000,400($
= 34.8 days
b. The inventory position of the business has improved. The inventory turnover has
increased, while the number of days’ sales in inventory has decreased. The sales
volume has increased faster than the inventory has increased, thus resulting in
the improving inventory position.
E9–12
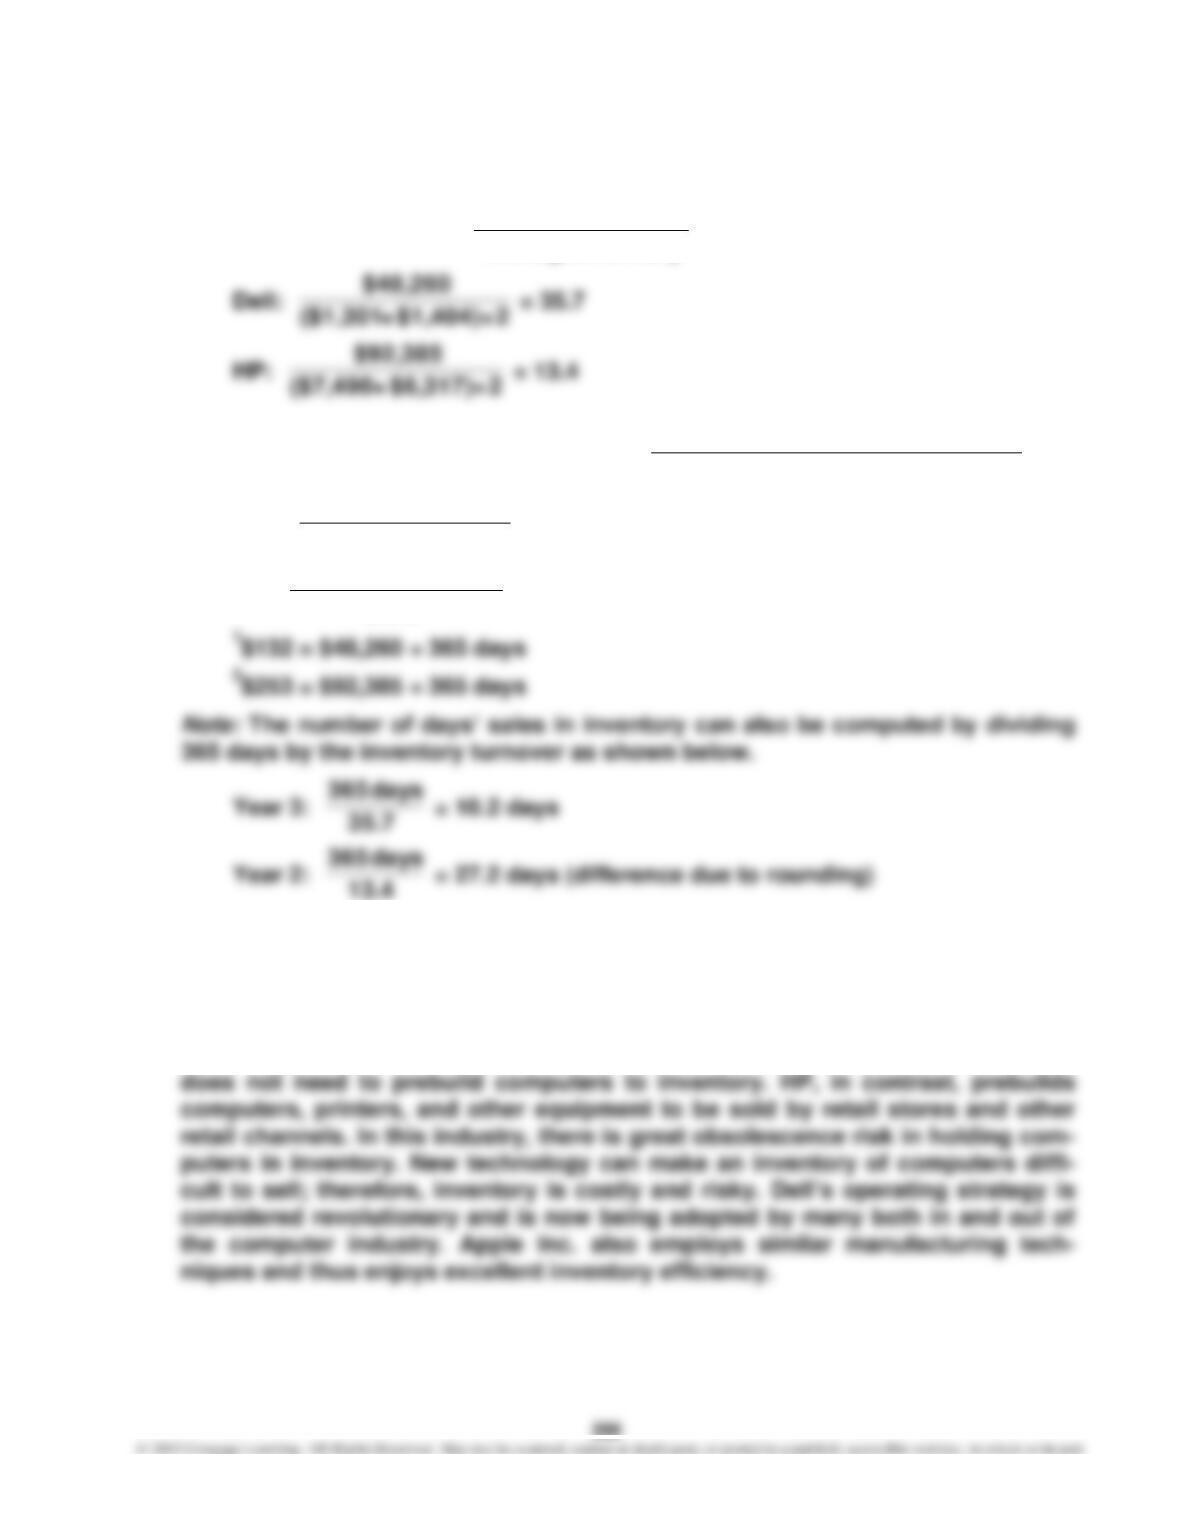
a. (1) Inventory Turnover =
Inventory Average
Sold Goods ofCost
(2) Number of Days’ Sales in Inventory =
Sold Goods ofCost Daily Average
Inventory Average
Dell:
1
$132
2÷$1,404)+($1,301
= 10.2 days
HP:
2
$253
2÷$6,317)+($7,490
= 27.3 days
b. Dell has a much higher inventory turnover ratio than does HP (35.7 for Dell vs.
13.4 for HP). Likewise, Dell has a much smaller number of days’ sales in invent-
tory (10.2 days for Dell vs. 27.3 days for HP). These significant differences are a
result of Dell’s make-to-order strategy. Dell has successfully developed a manu-
facturing process that is able to fill a customer order quickly. As a result, Dell
267
E9–13
a. Ratio of Liabilities to Stockholders’ Equity =
Total Liabilities
Total Stockholders’ Equity
b.
Earned AreChargesInterest
Bond Times of Number
=
ExpenseInterest
ExpenseInterest + Tax Before Income
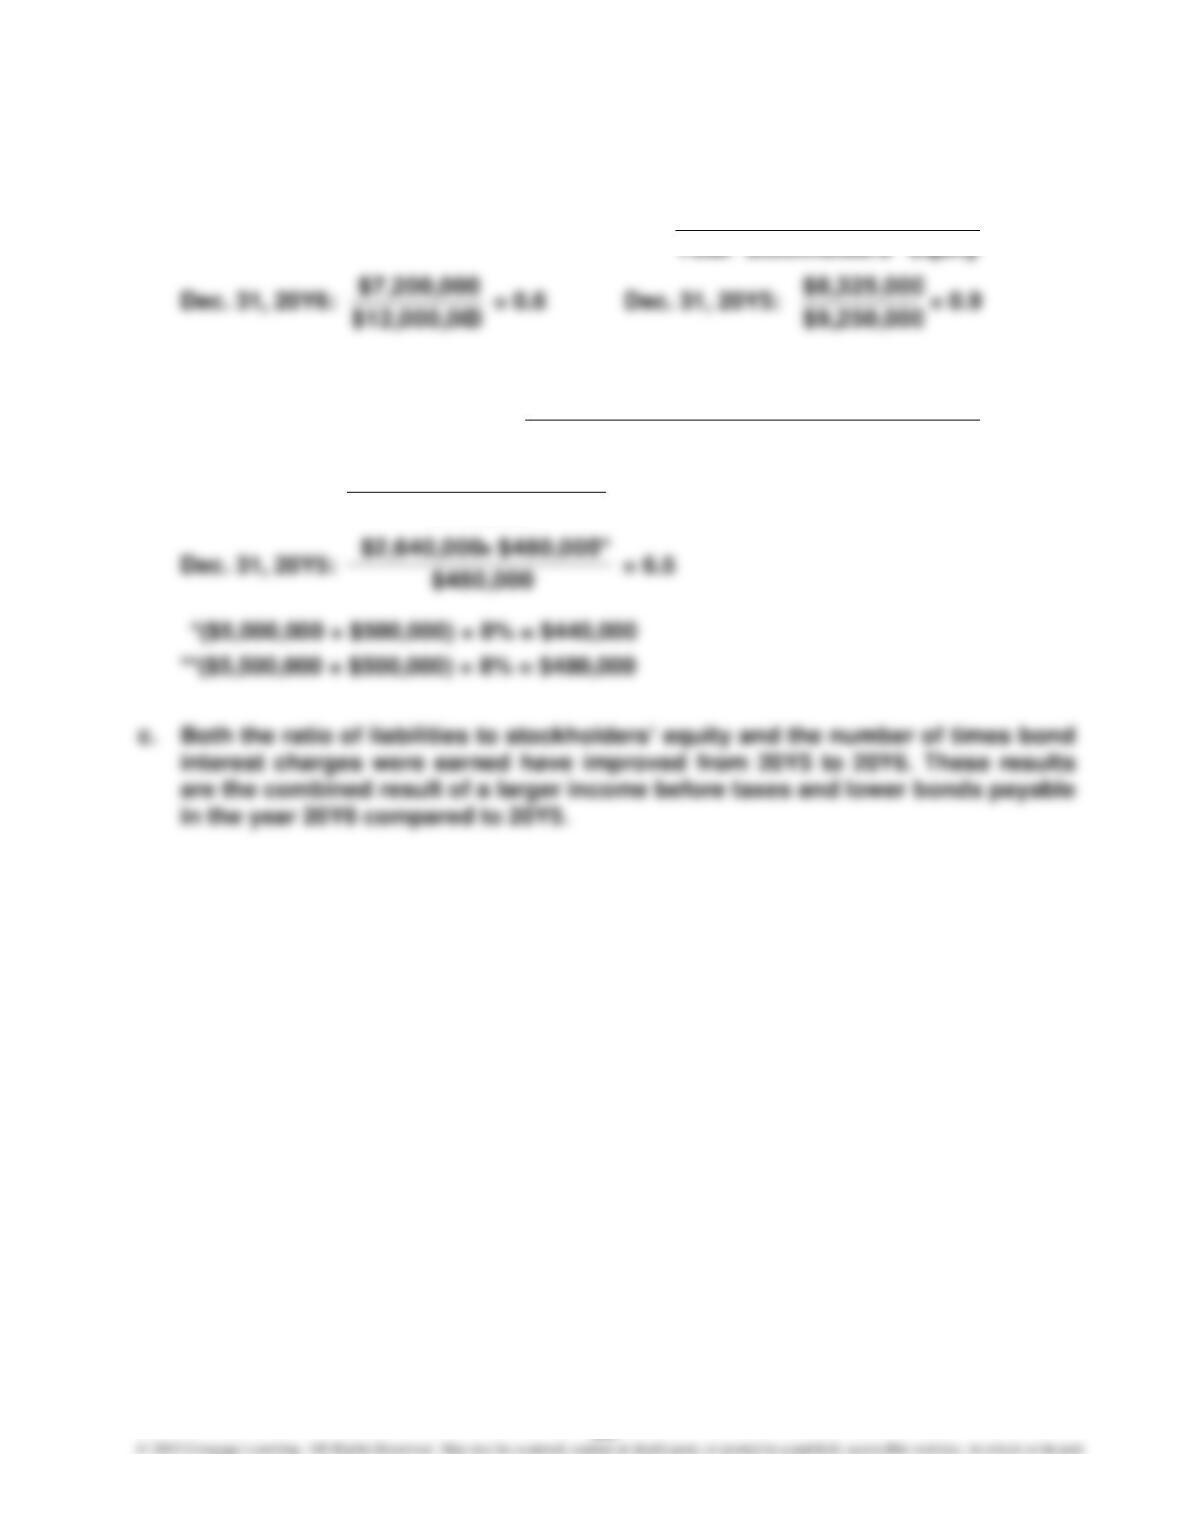
Dec. 31, 20Y6:
$440,000
000$440 + $2,816,000 *,
= 7.4
268
E9–14
a. Ratio of Liabilities to Stockholders’ Equity =
Equity rs’Stockholde Total
sLiabilitie Total
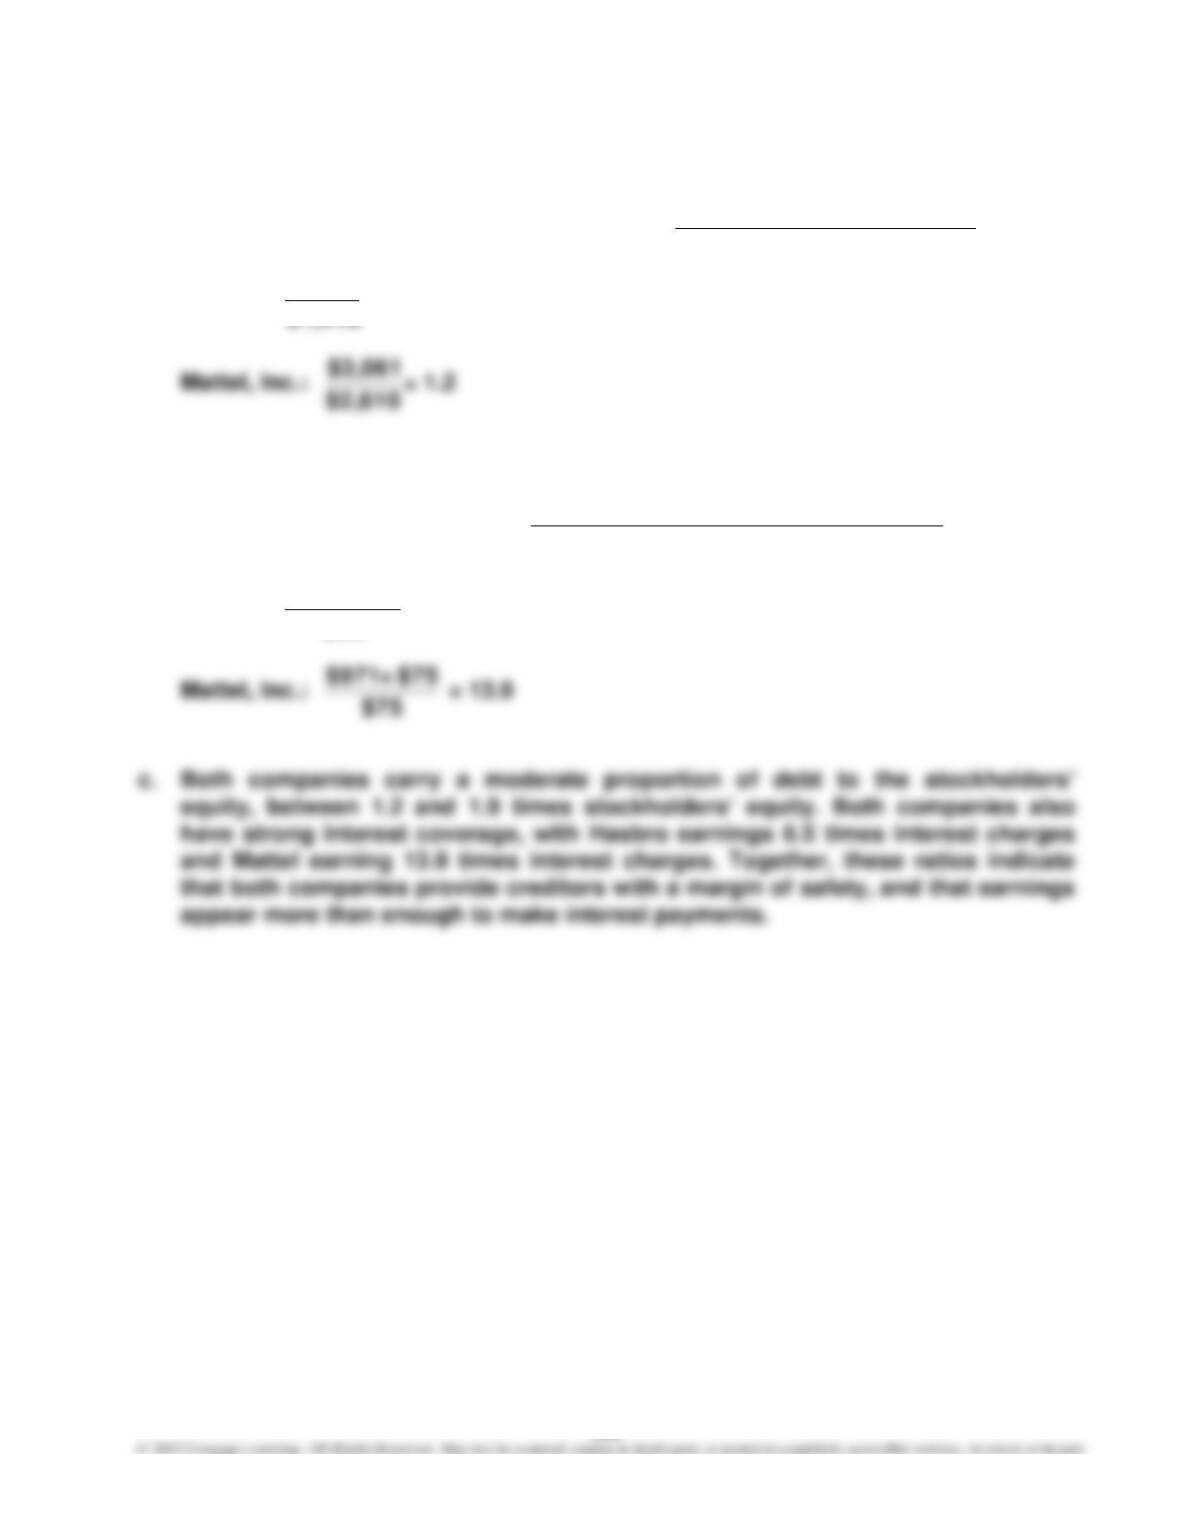
Hasbro:
$2,713
= 1.9
b.
Earned AreChargesInterest
Times of Number
=
ExpenseInterest
ExpenseInterest + Tax Before Income
Hasbro:
$89
$89 + $486
= 6.5
269
E9–15
a. Ratio of Liabilities to Stockholders’ Equity =
Equity rs‘Stockholde Total
sLiabilitie Total
H.J. Heinz:
$2,759
$1,683 + $4,780 + $2,648
= 3.3
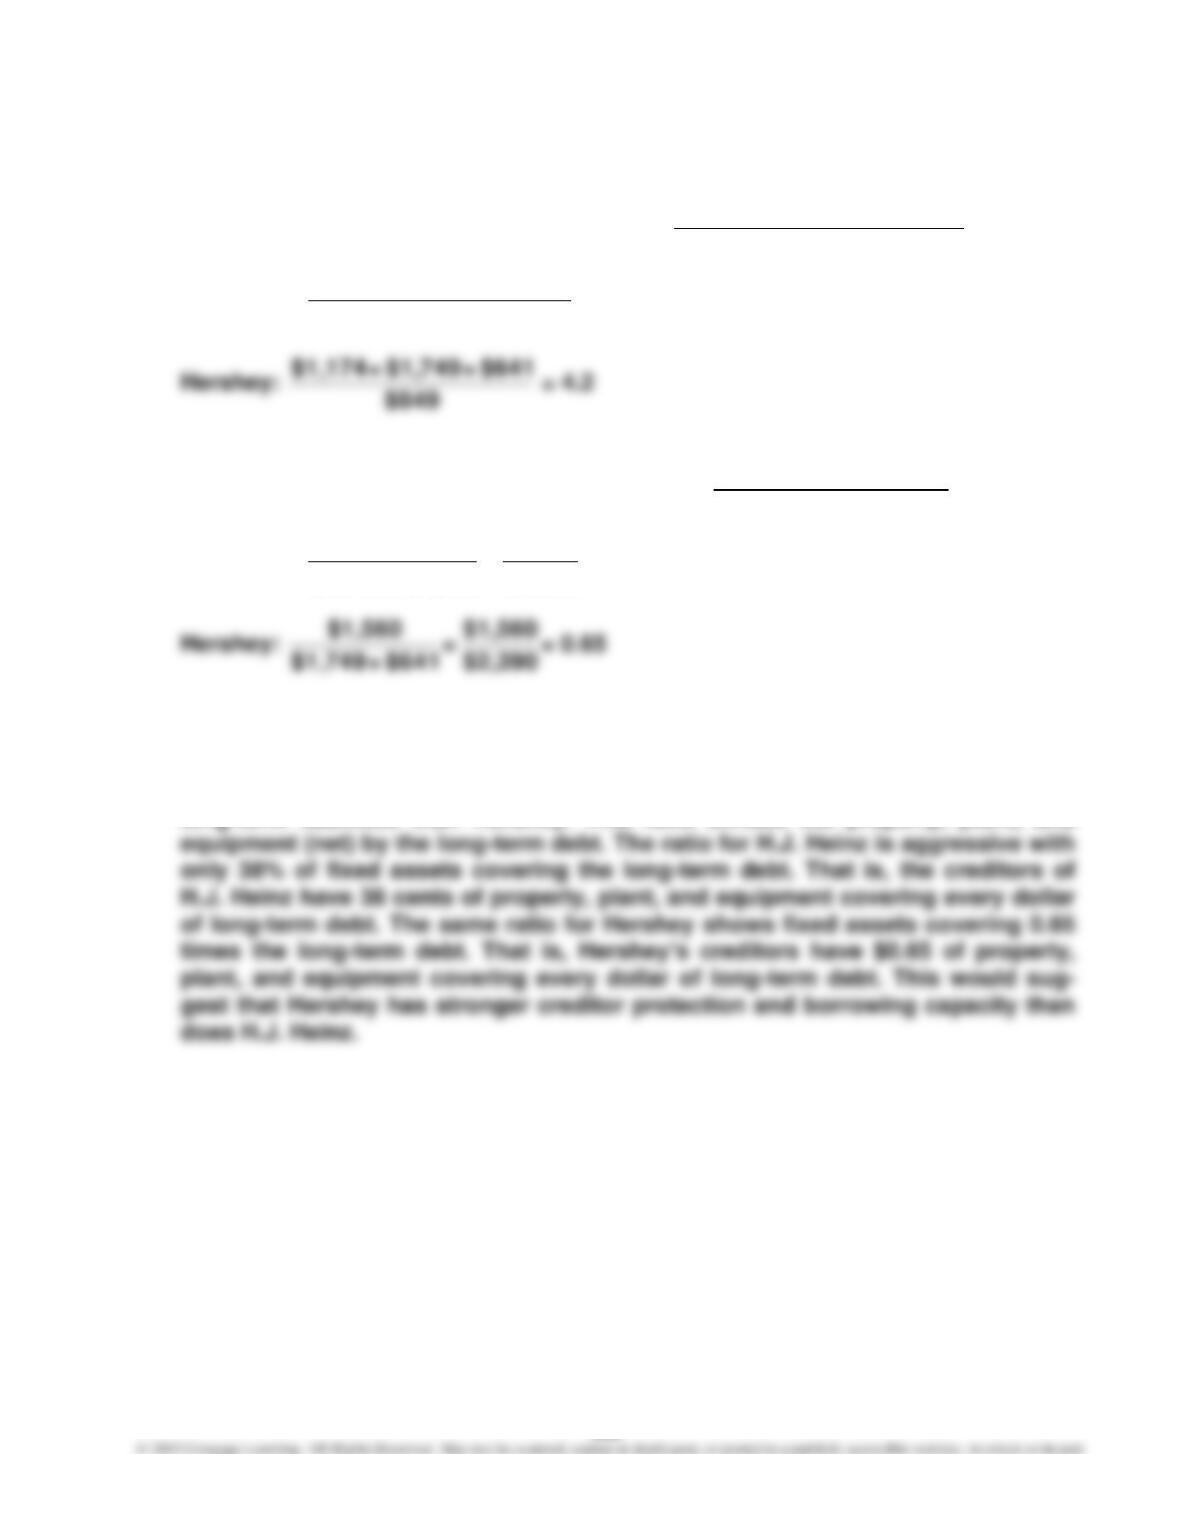
b. Ratio of Fixed Assets to Long-Term Liabilities =
Fixed Assets (net)
Long–Term Liabilities
H.J. Heinz:
$6,463
$2,484
=
$1,683 + $4,780
$2,484
= 0.38
c. H.J. Heinz uses more debt than does Hershey, but the ratio of total liabilities to
stockholders’ equity ratio is similar for both companies (3.3 vs. 4.2), the ratio of
fixed assets is very different. H.J. Heinz has a much lower ratio of fixed assets to
long-term liabilities than Hershey. This ratio divides the property, plant, and
E9–16
a. Ratio of Net Sales to Total Assets:
AssetsTotal Average
Sales Net
YRC Worldwide:
$2,529
$4,869
= 1.9
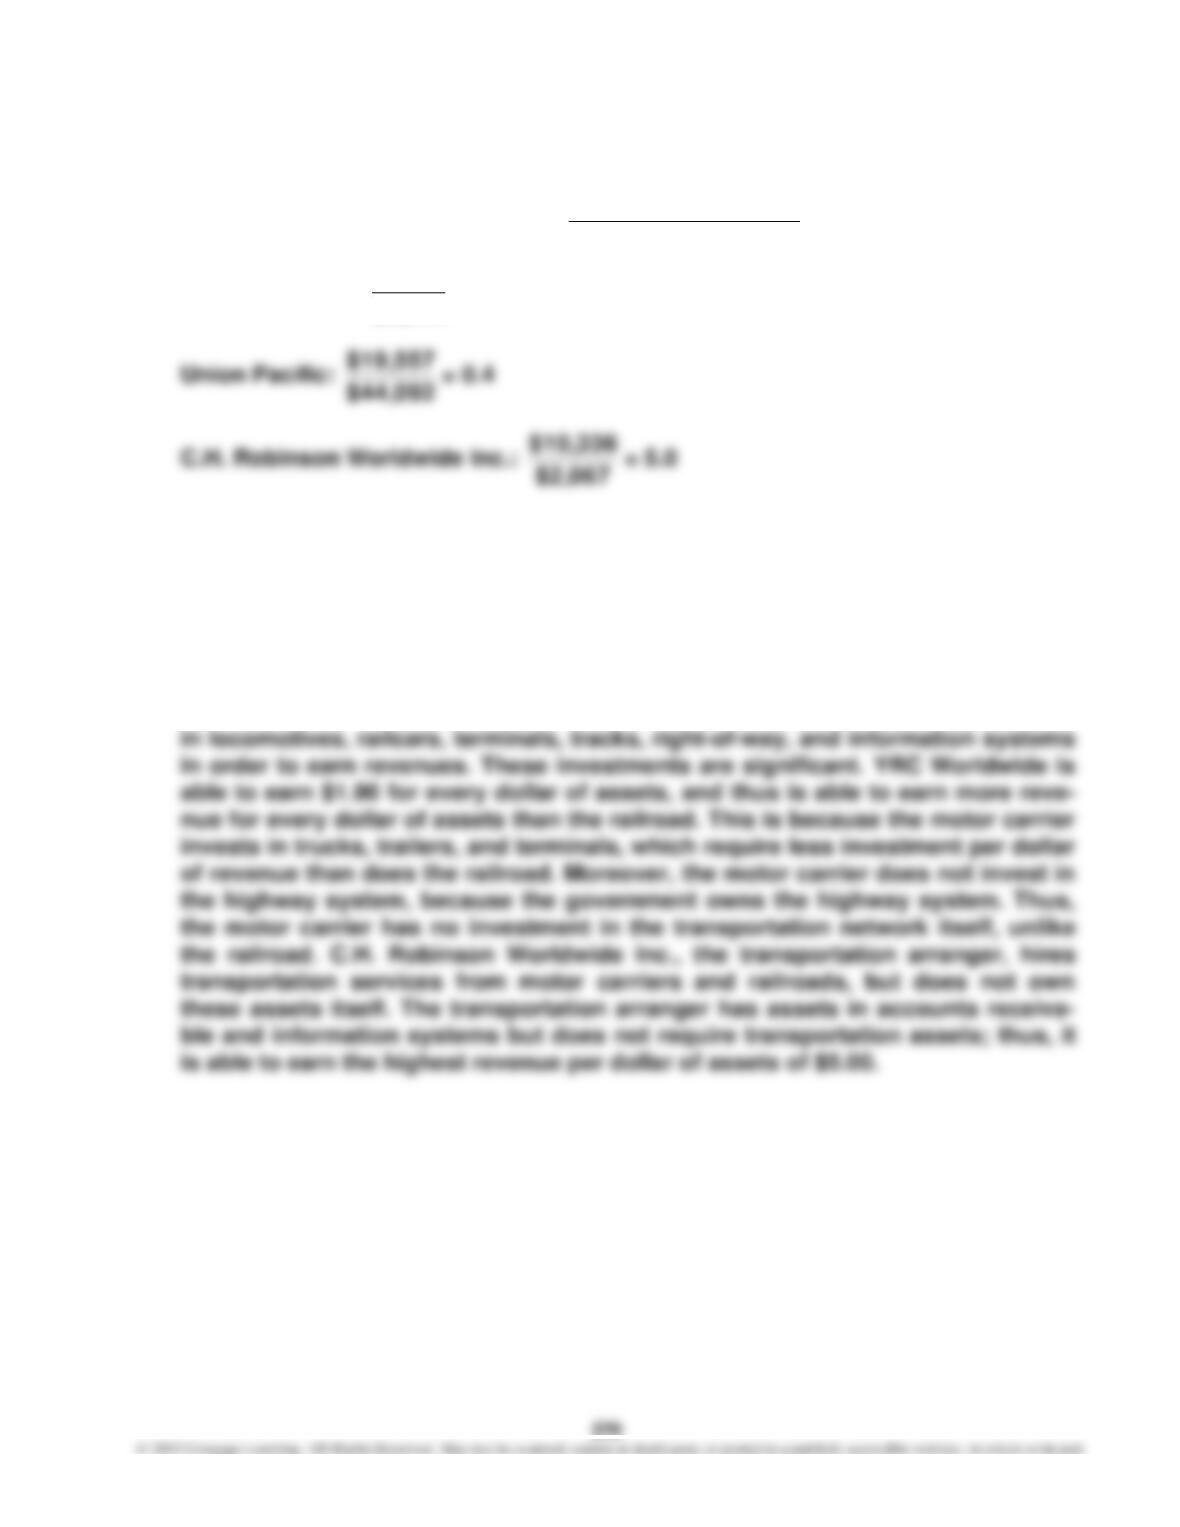
b. The ratio of net sales to assets measures the number of sales dollars earned for
each dollar of assets. The greater the number of sales dollars earned for every
dollar of assets, the more efficient a firm is in using assets. Thus, the ratio is a
measure of the efficiency in using assets. The three companies are different in
their efficiency in using assets, because they are different in the nature of their
operations. Union Pacific earns only 40 cents for every dollar of assets. This is
because Union Pacific is very asset intensive. That is, Union Pacific must invest
271
E9–16, Concluded
Note to Instructors: Students may wonder how asset-intensive companies over-
come their asset efficiency disadvantages relative to competitors with better
asset efficiencies, as in the case between railroads and motor carriers. Asset
efficiency is part of the financial equation; the other part is the profit margin
E9–17
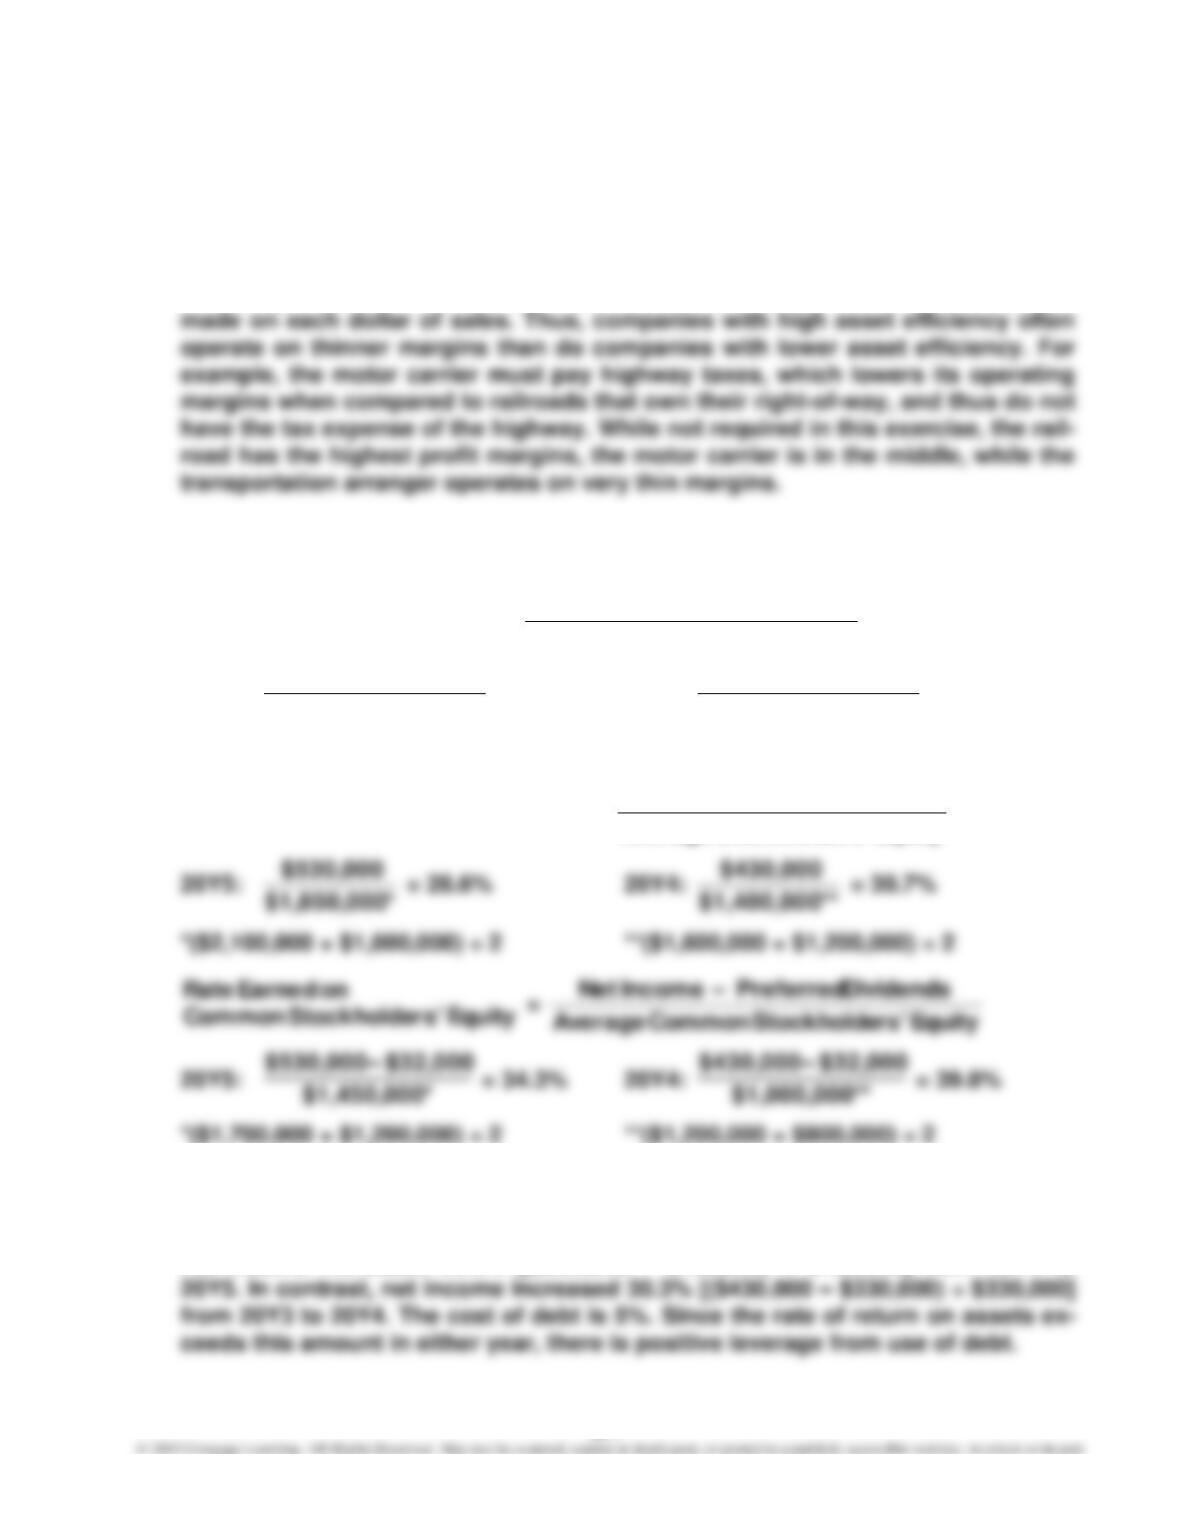
a. Rate Earned on Total Assets =
AssetsTotal Average
ExpenseInterest + IncomeNet
20Y5:
*$2,650,000
$40,000 + $530,000
= 21.5% 20Y4:
**$2,200,000
$40,000 + $430,000
= 21.4%
*($2,900,000 + $2,400,000) ÷ 2 **($2,400,000 + $2,000,000) ÷ 2
Rate Earned on Stockholders’ Equity =
Equity rs‘Stockholde Average
IncomeNet
b. The profitability ratios indicate that The O’Malley Group’s profitability has
declined slightly. Most of this change is due to net income not increasing as rap-
idly from 20Y4 to 20Y5 as net income increased from 20Y3 to 20Y4. Specifically,
net income increased 23.3% [($530,000 – $430,000) ÷ $430,000] from 20Y4 to
272
E9–18
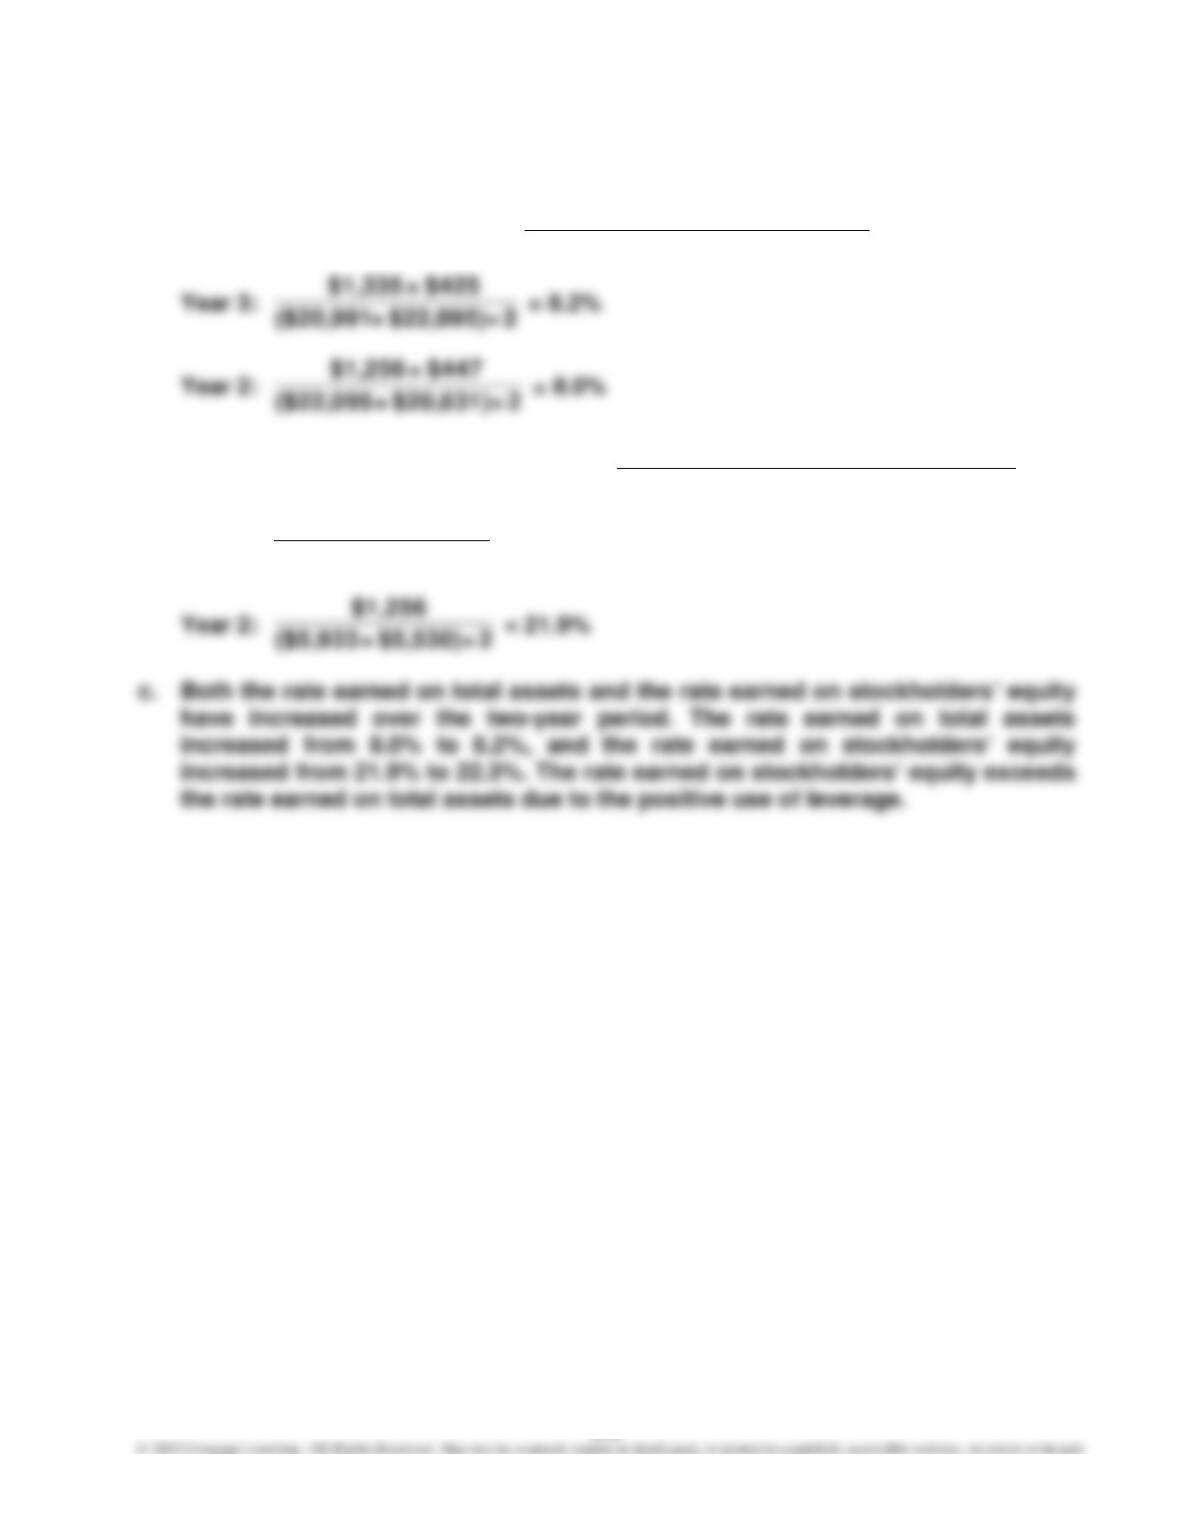
a. Rate Earned on Total Assets =
AssetsTotal Average
ExpenseInterest + IncomeNet
b. Rate Earned on Stockholders’ Equity =
Equity rs‘Stockholde Total Average
IncomeNet
Year 3:
2 ÷ $5,933) + ($6,051
$1,335
= 22.3%
273
E9–19
a. Ratio of Fixed Assets to Long-Term Liabilities =
sLiabilitie ermT–Long
AssetsFixed
b. Ratio of Liabilities to Stockholders’ Equity =
Equity rs‘Stockholde Total
sLiabilitie Total
0$10,400,00
$5,200,000
= 0.5
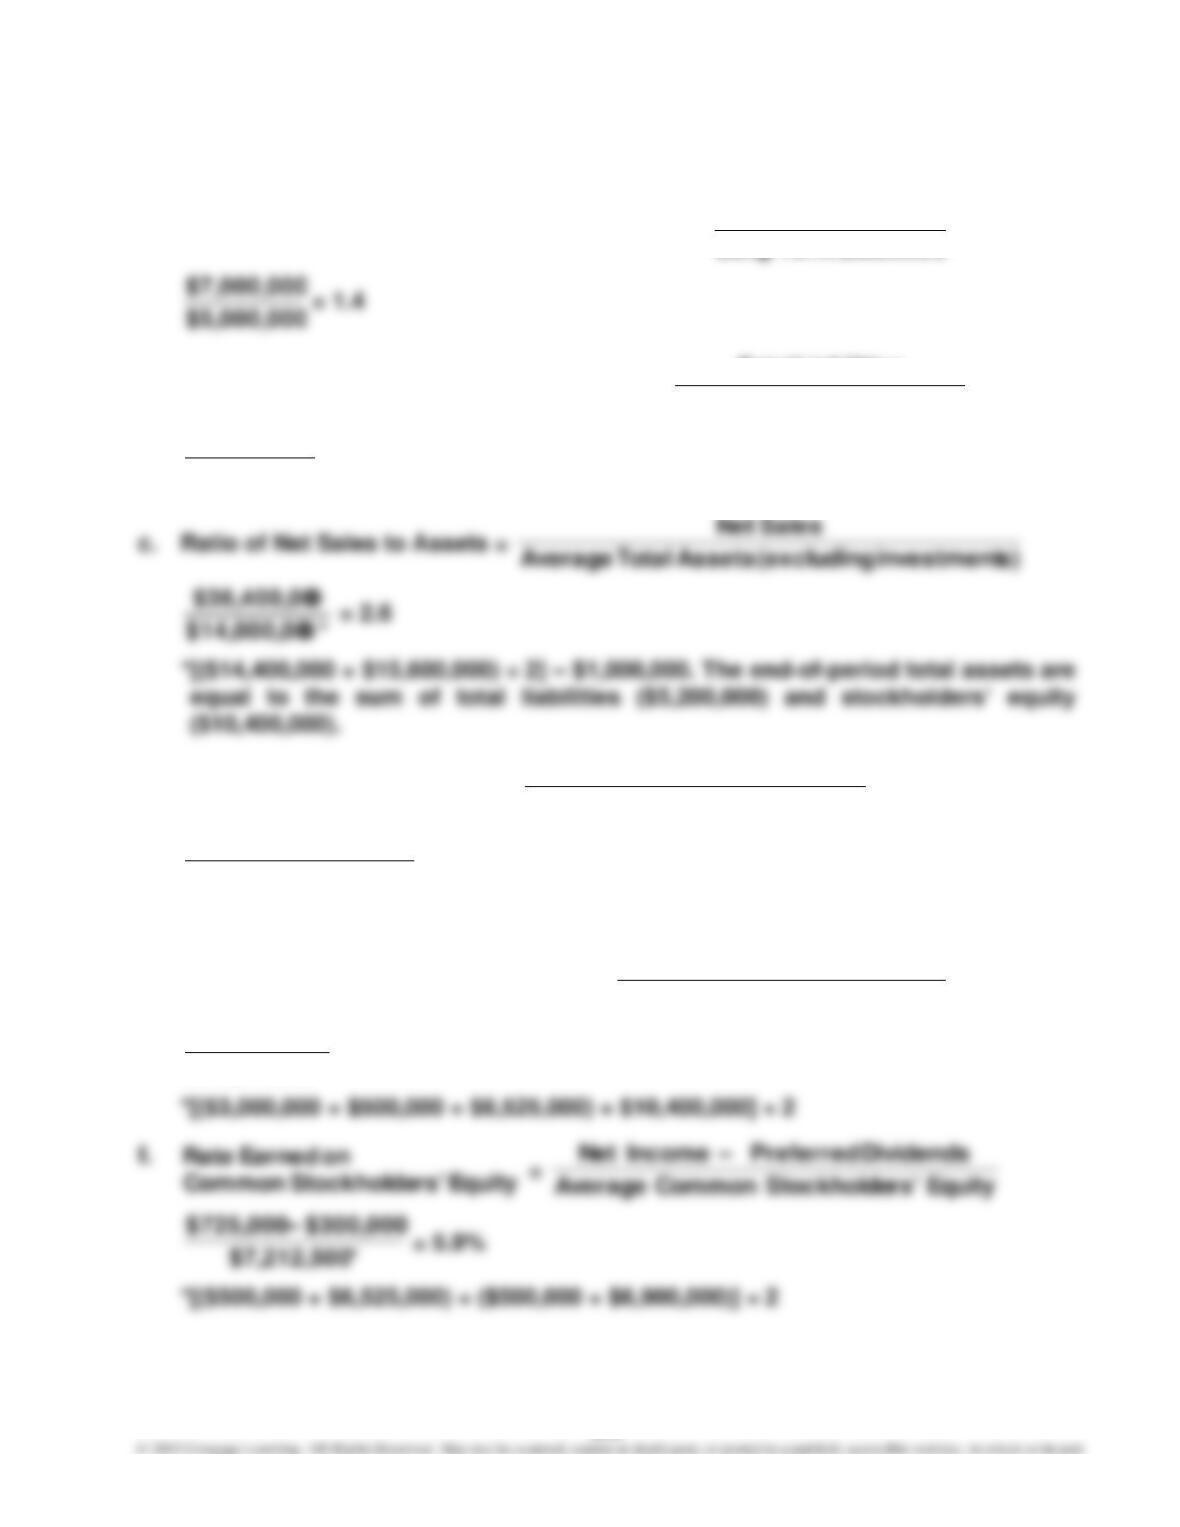
d. Rate Earned on Total Assets =
AssetsTotal Average
Expense Interest + Income Net
*0$15,000,00
$400,000 + $725,000
= 7.5%
*($14,400,000 + $15,600,000) ÷ 2
e. Rate Earned on Stockholders’ Equity =
Equity rs‘Stockholde Average
IncomeNet
*0$10,212,50
$725,000
= 7.1%
274
E9–20
a.
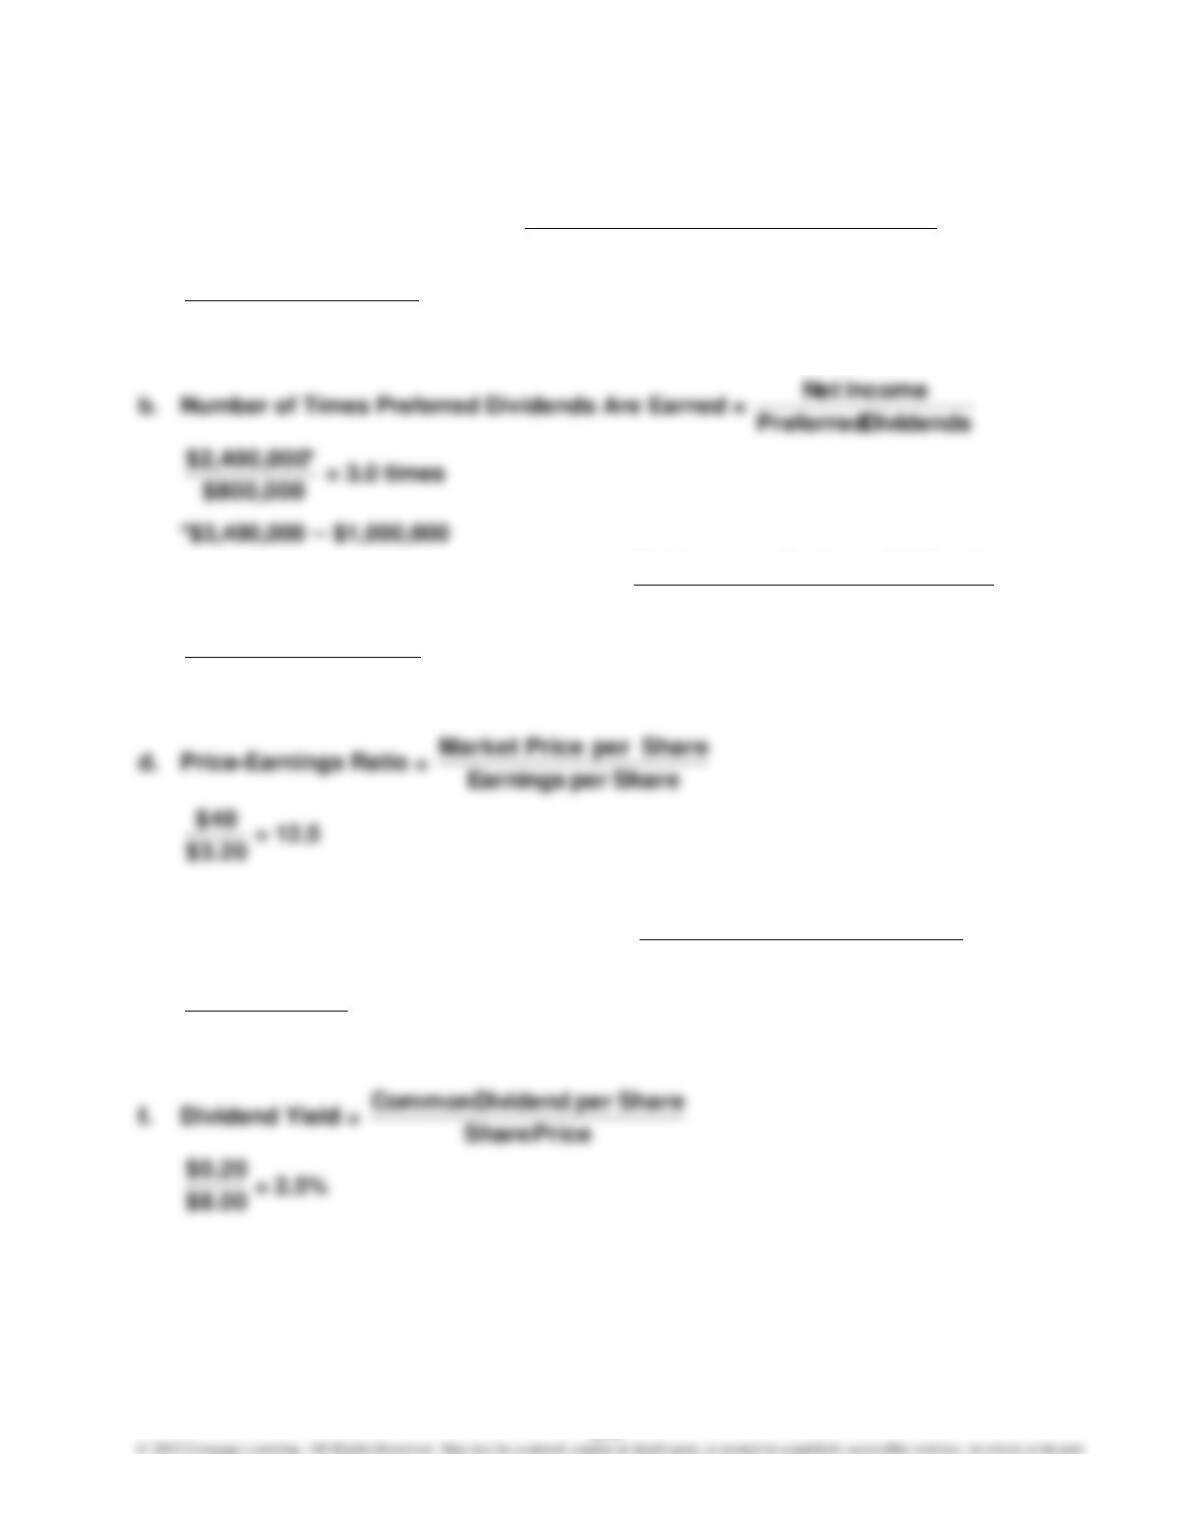
Earned AreChargesInterest
Bond Times of Number
=
ExpenseInterest
ExpenseInterest + Tax Before Income
$400,000
$400,000 + $3,400,000
= 9.5
c. Earnings per Share on Common Stock =
gOutstandin Shares Common
Dividends Preferred –– Income Net
shares 500,000
$800,000 –– $2,400,000
= $3.20
e. Dividends per Share of Common Stock =
gOutstandin Shares Common
Dividends Common
shares 500,000
$100,000
= $0.20