▪ The costs of the resources supplied to this department, cost of the department
manager, and the costs of the technology and facilities are totaled.
o The Time Required for Each Activity
▪ The manager is asked to estimate how much time each activity takes for a single
transaction.
o Calculating the Costs of the Activities
• The difference between the actual departmental cost and the total cost of activity
for the department is due to idle time and represents the excess capacity in the
department.
▪ How can these calculations help the cost accountant and other managers?
• The reported costs can be used when considering the demands placed on
Receiving by the characteristics of different products.
For example, if some products are produced in small quantities, they might
still require the same number of shipments as those products with larger
volumes.
• These costs can help managers make better decisions about whether they should
keep or drop these products by giving better information about support costs.
• Extensions of TDABC
• For example, when Receiving stores the material, it stores it in the warehouse,
which is a part of the resources included in Receiving. We can think of an
additional activity (storage, for example). The cost of storage might be more
related to the space required instead of time. It is a simple extension of the model
to compute the cost per square foot and apply it to materials that are stored in the
warehouse.
• We would also recompute the time-based cost driver rate to account for the lower
remaining costs in Receiving after splitting out the warehouse cost.
o Time Equations
▪ The TDABC system that we have developed so far assumes all orders that go through
any one of the activities take the same amount of time. We can extend the TDABC
system to allow for differences among orders by using what are called time equations.
Matching
A.
Activity-based costing (ABC)
E.
Department allocation method
Cost driver
Plantwide allocation method
Cost hierarchy
G.
Time equations
D.
Death spiral
_____ 1. Classification of cost drivers into general levels of activity, volume, batch, product,
and so on.
_____ 2. Process that begins by attempting to increase price to meet reported product costs,
losing market, reporting still higher costs, and so on, until the firm is out of business.
_____ 3. Allocation method using one cost pool for the entire plant. It uses one overhead
allocation rate, or one set of rates, for all of a plant’s departments.
Matching Answers
1. C
3. F
5. A
7. G
Multiple Choice Questions
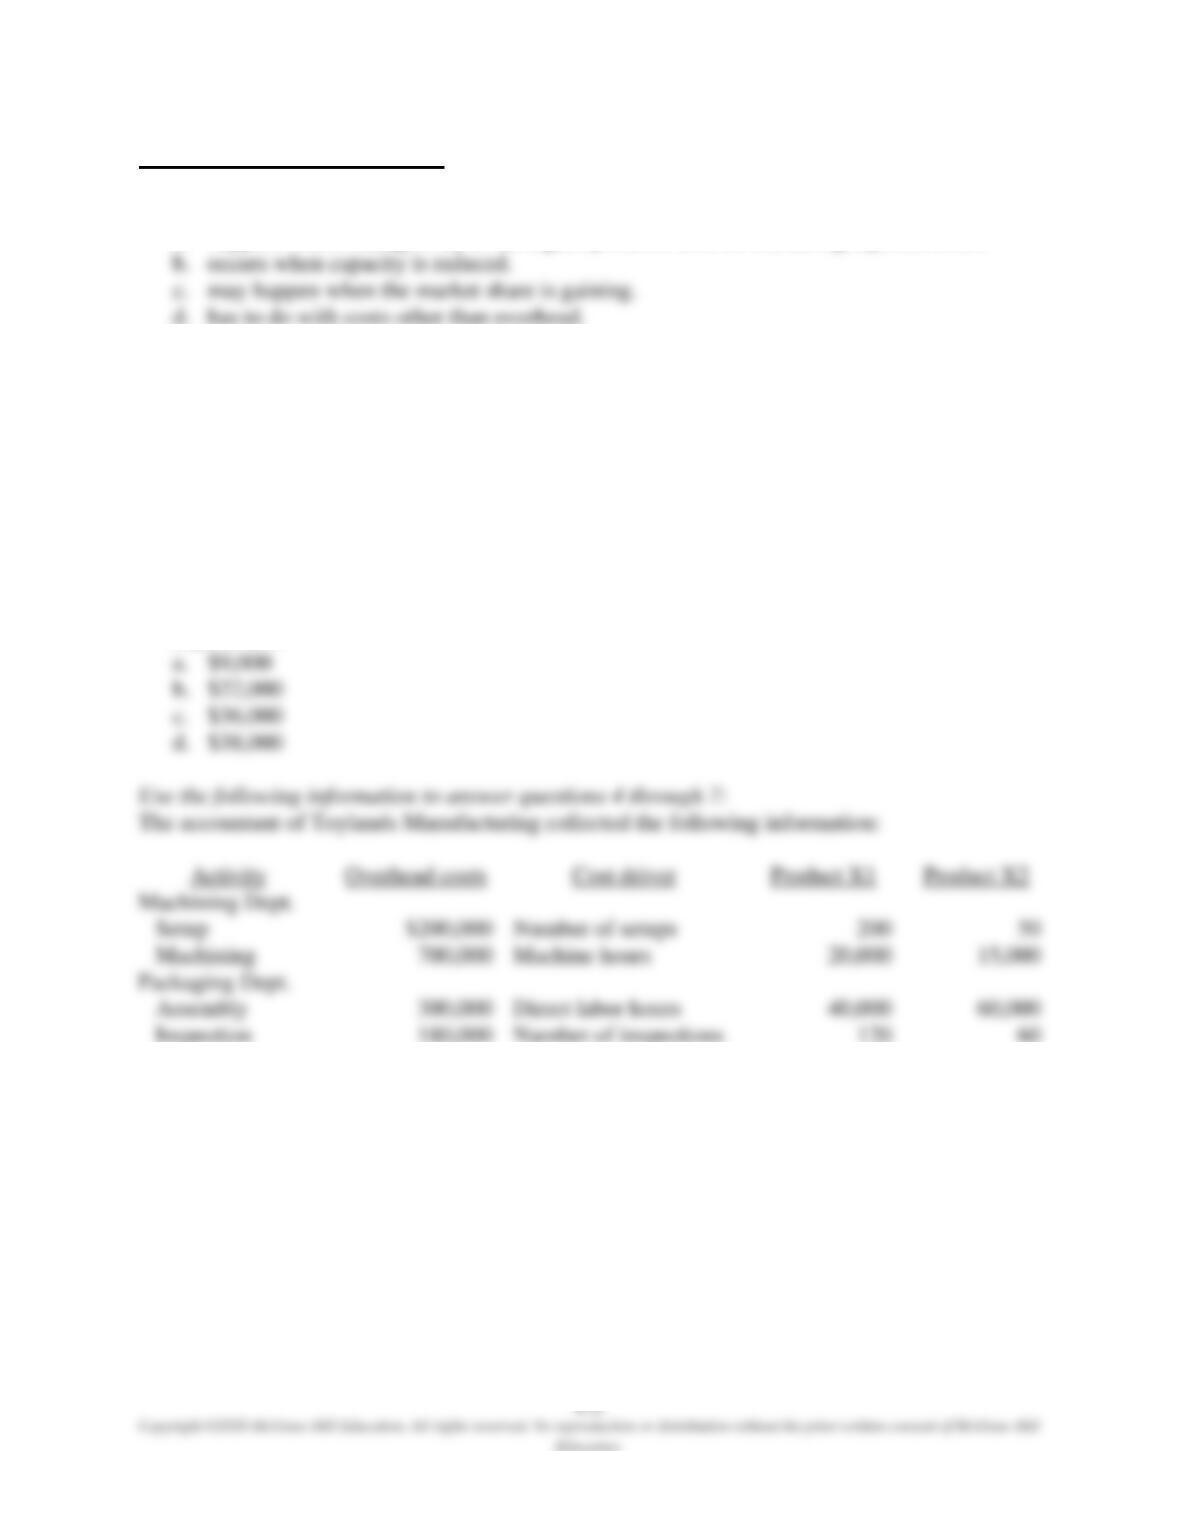
1. A death spiral:
a. happens when managers try to set higher prices to recover increasing reported costs.
2. In a two-stage cost allocation system:
a. the first stage involves assigning overhead costs to cost pools.
b. the cost pools may be departments.
c. each cost pool requires an allocation rate.
d. All of the above.
3. One of the cost pools at Toylands Store is the Personnel department that provides recruiting
and training for Sales and Administrative departments and has an estimated overhead of
$45,000. Sales department has 12 employees and Administrative department has 3. How
much of the overhead cost of the Personnel department should be allocated to the Sales
department?
4. If Toylands Manufacturing uses a plantwide rate based on direct labor hours to allocate
overhead costs, how much is product X1’s share of overhead?
a. $324,000
b. $416,000
c. $638,000
d. $552,000
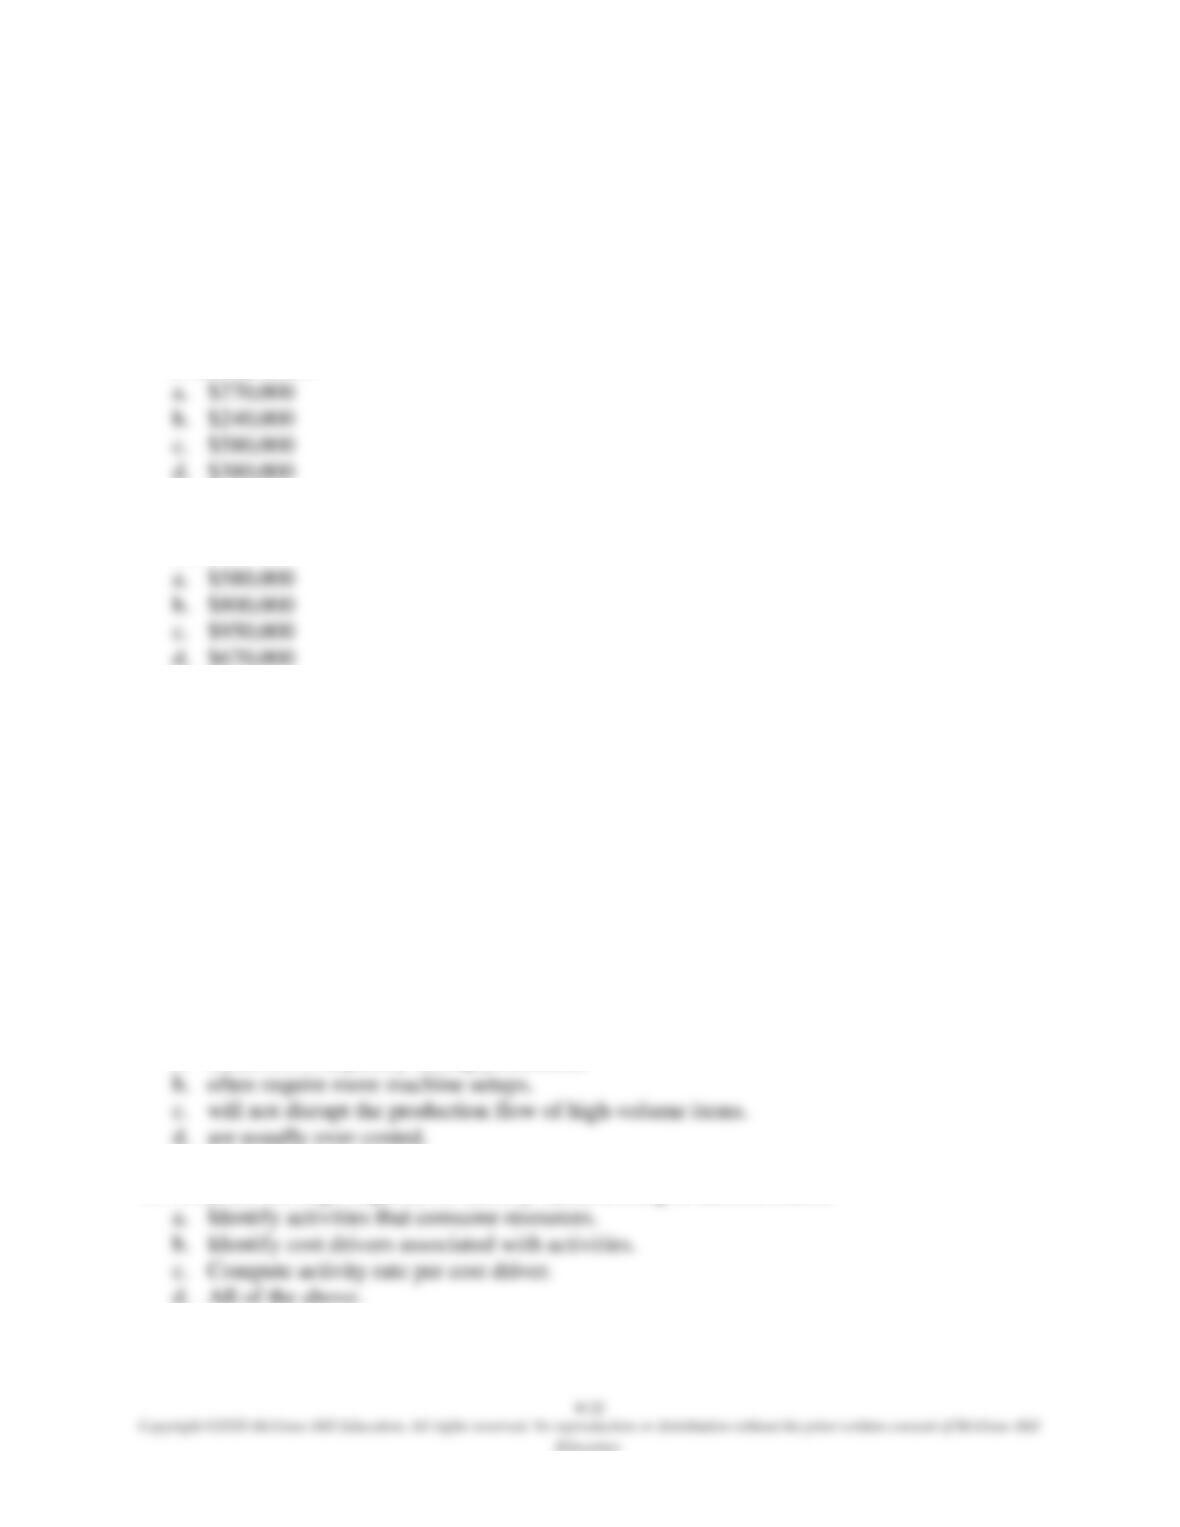
5. If the department allocation method is used, what is the overhead rate for the Machining
department with machine hours as the allocation base?
a. $39.43 per machine hour
b. $13.71 per machine hour
c. $20 per machine hour
d. $25.71 per machine hour
6. When activity-based costing is used, what is product X2’s share of the Packaging department
overhead costs?
7. When activity-based costing is used, how much of the overhead cost is allocated to product
X1?
8. Which of the following is true of activity-based costing relative to traditional costing?
a. It requires less detailed cost measures.
b. Accounting department alone can handle all the work.
c. It needs more cost pools.
d. It is less costly to implement.
9. Activity-based costing can be beneficial to:
a. banks.
b. nonprofit organizations.
c. law firms.
d. All of the above.
10. Low-volume products, relative to high-volume ones:
a. entail less complexity during production.
11. What are the steps required for activity-based costing in administration?
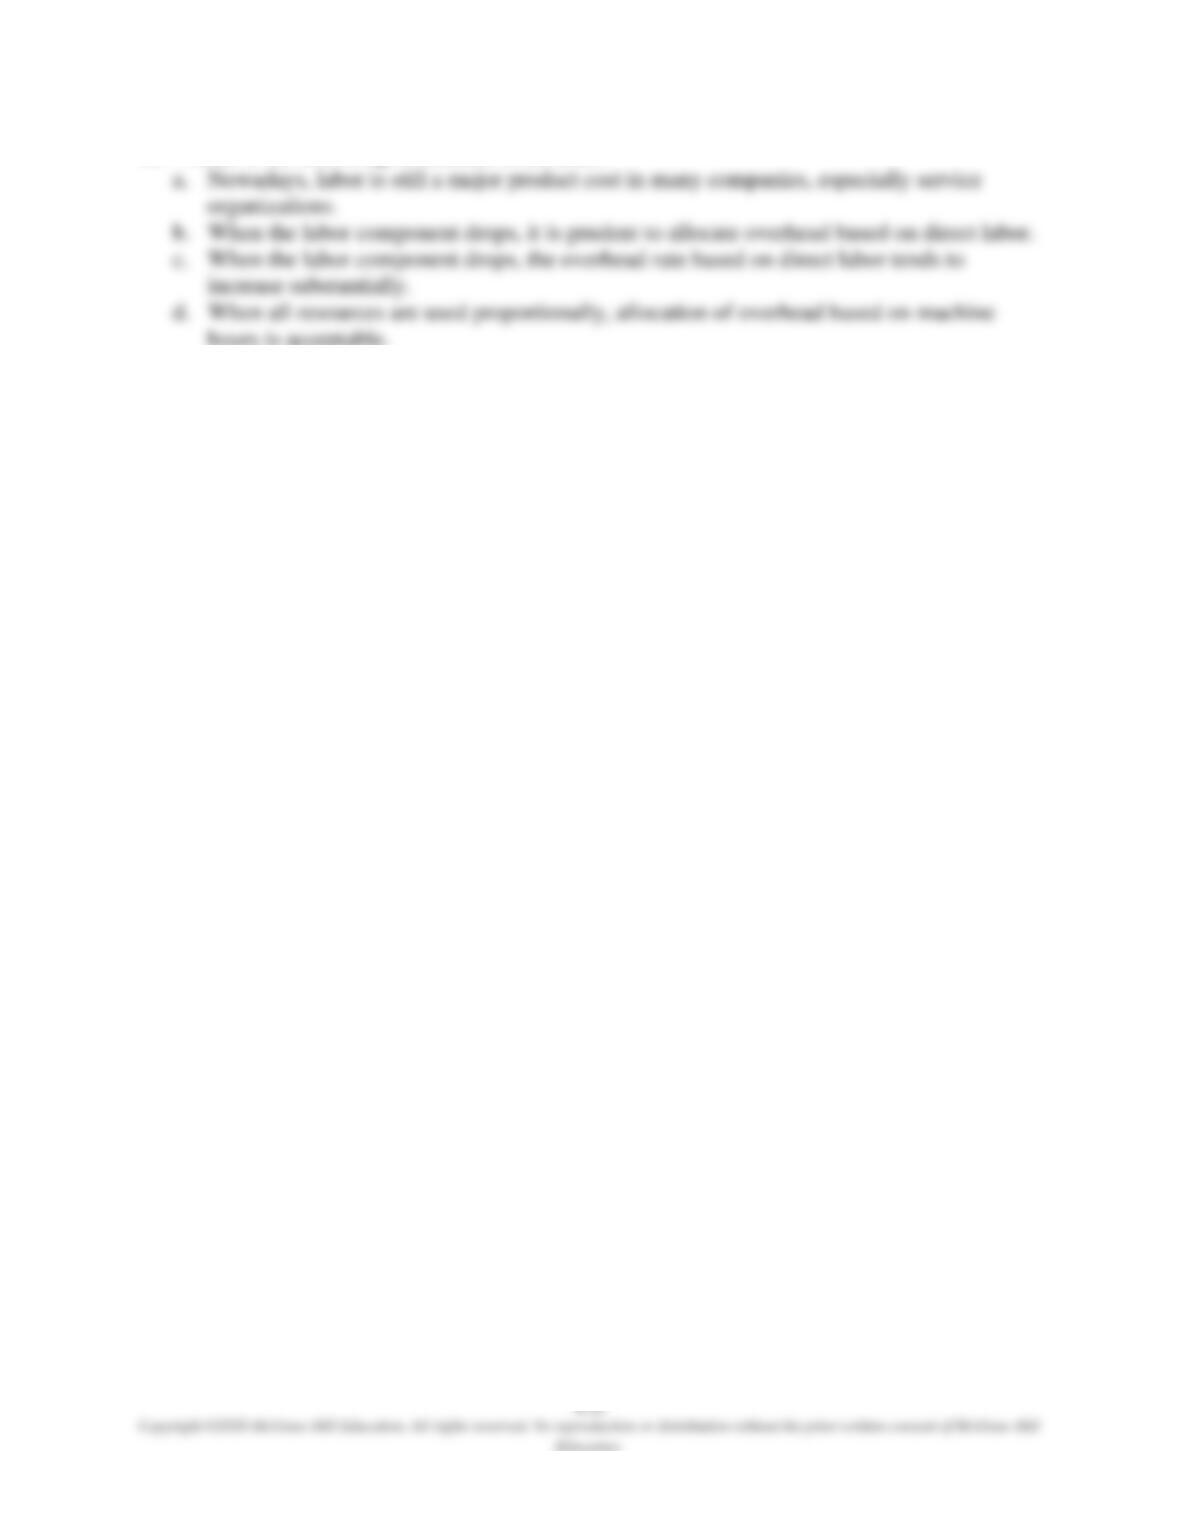
12. Which of the following statements is incorrect?
Multiple Choice Answers
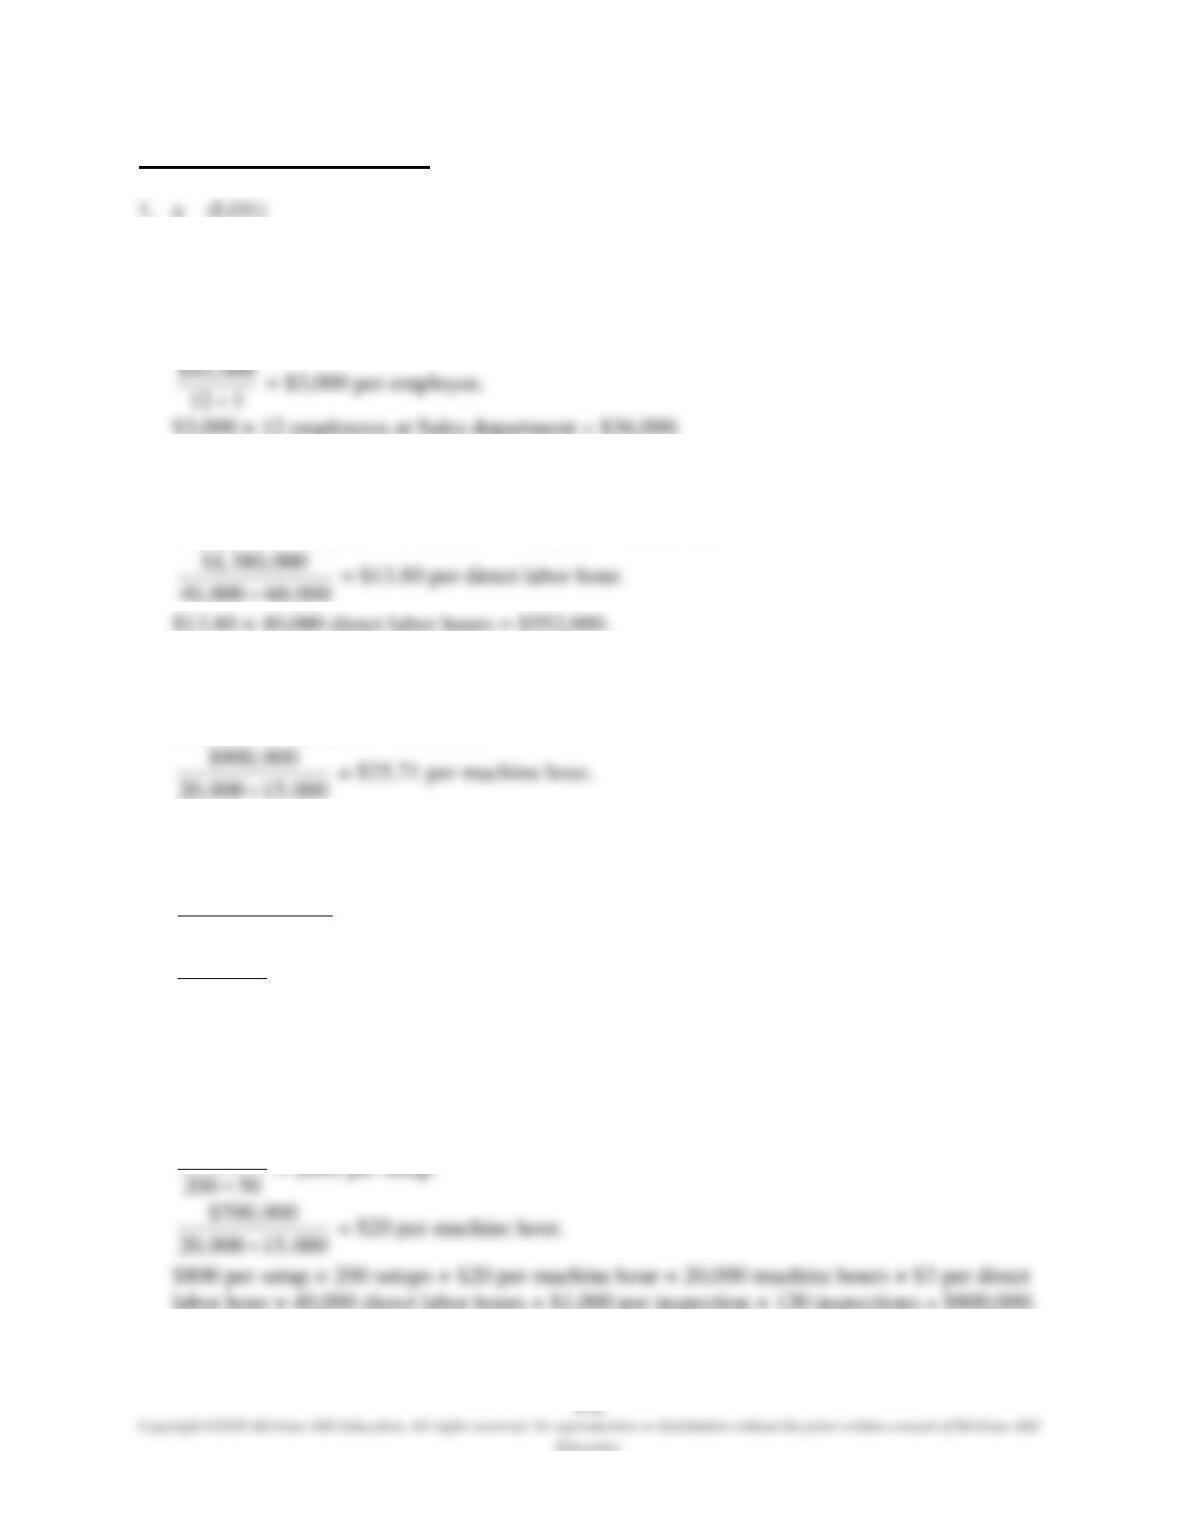
2. d (LO2)
3. c (LO2)
4. d (LO2)
$200,000 + $700,000 + $300,000 + $180,000 = $1,380,000.
5. d (LO2)
$700,000 + $200,000 = $900,000.
6. b (LO4, LO5)
$300,000
40,000 60,000+
= $3 per direct labor hour.
$180,000
120 60+
= $1,000 per inspection.
$3 per direct labor × 60,000 direct labor hours + $1,000 per inspection × 60 inspections =
$240,000.
7. b (LO4, LO5)
$200,000
9. d (LO8)
11. d (LO8)
Demonstration Problem 1
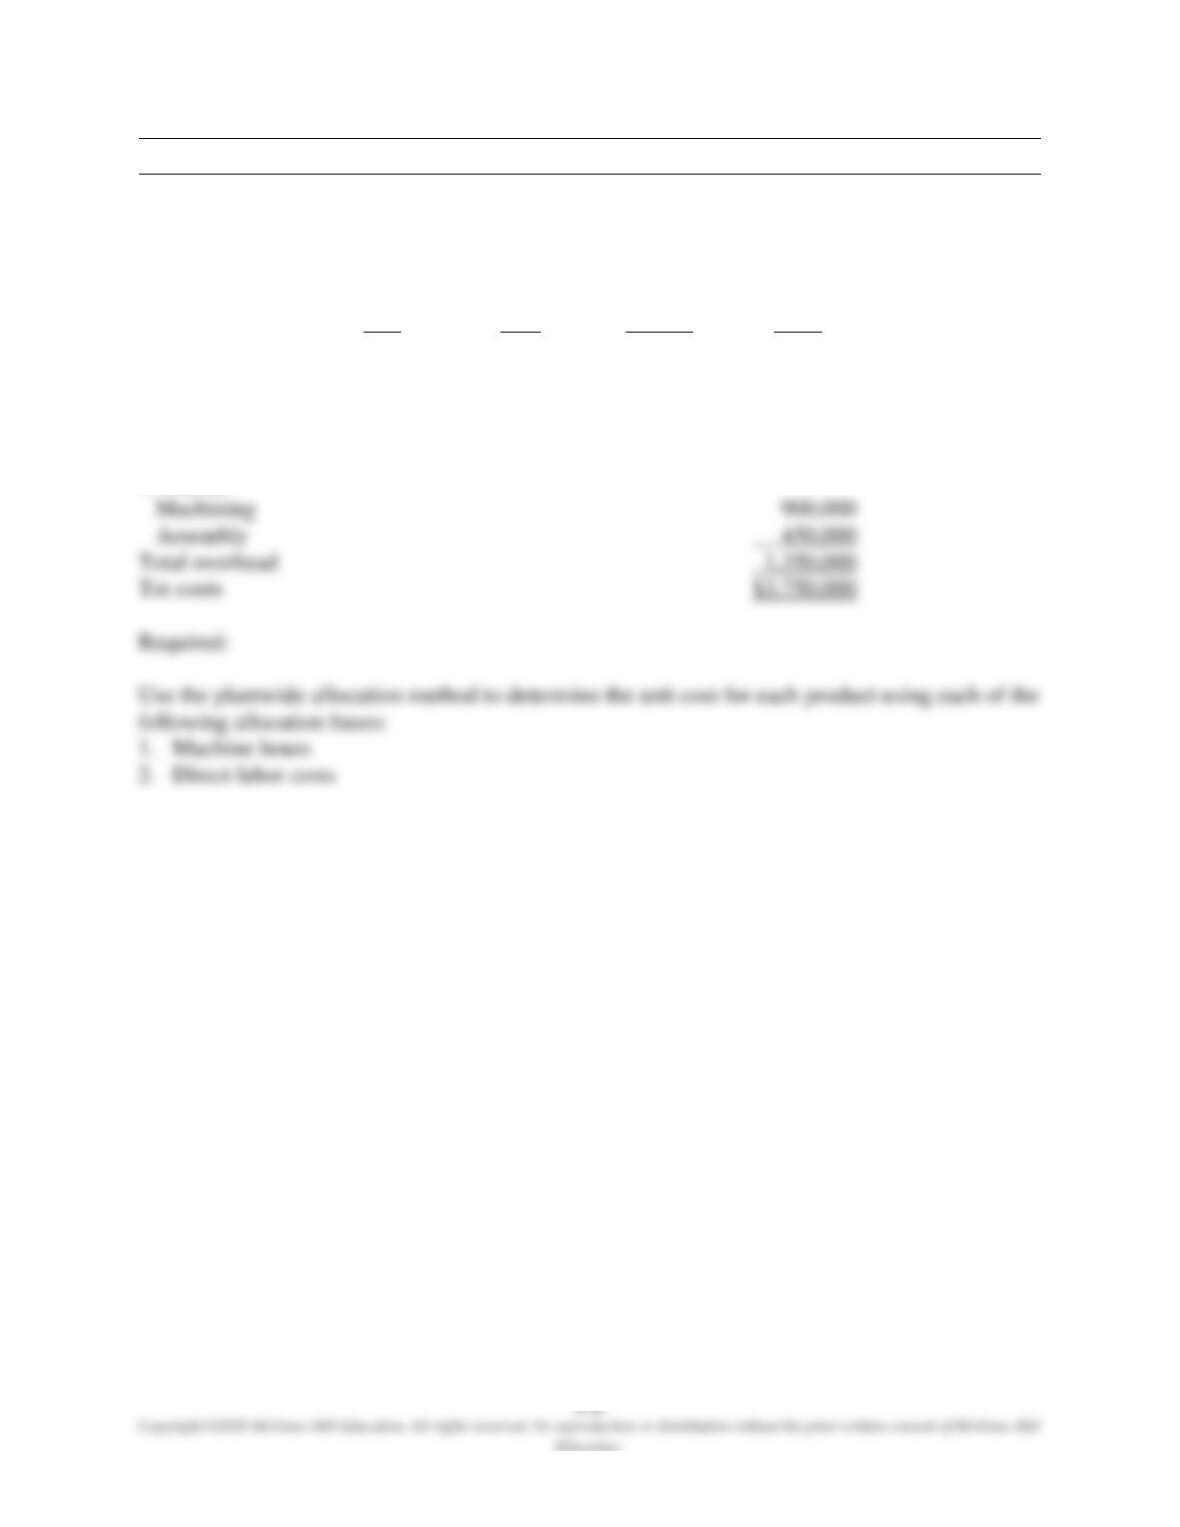
ABC Manufacturing, Inc. produces three gadgets (Ace, Best, and Champ) in two departments,
Machining and Assembly. Each product requires one hour of direct labor for completion. The
following table provides production and cost data for the year.
Ace
Best
Champ
Total
Number of units
25,000
15,000
5,000
45,000
Machine hours
2,500
1,500
2,000
6,000
Direct materials
$1,000,000
$450,000
$275,000
$1,725,000
Direct labor
375,000
225,000
75,000
675,000
Overhead
Machining
900,000
Assembly
450,000
Total overhead
1,350,000
Tot costs
$3,750,000
Demonstration Problem 1 – Solution
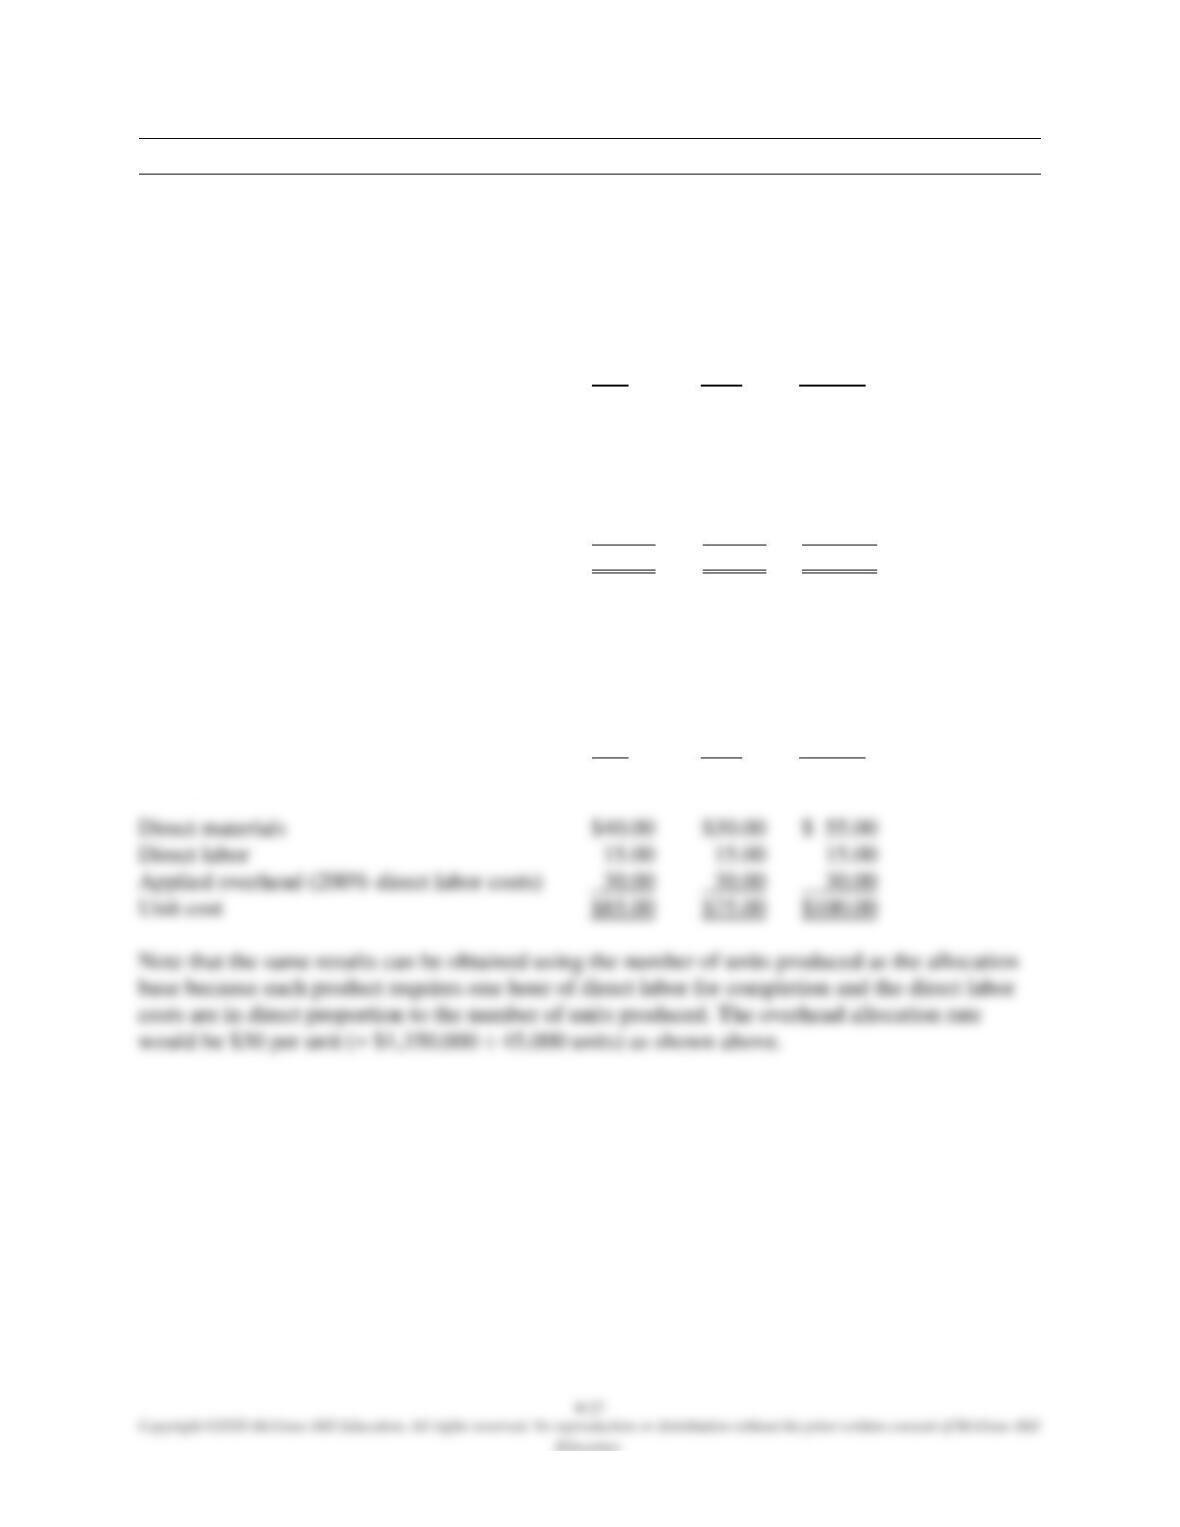
Part 1
The overhead allocation rate when machine hours were used as the allocation base was $225 per
machine hour (= $1,350,000 ÷ 6,000 machine hours). The unit cost report would show the
following:
Ace
Best
Champ
Units produced
25,000
15,000
5,000
Machine hours per unit
0.1
0.1
0.4
Direct materials
$40.00
$30.00
$ 55.00
Direct labor
15.00
15.00
15.00
Applied overhead ($225 per machine hour)
22.50
22.50
90.00
Unit cost
$77.50
$67.50
$160.00
Part 2
The overhead allocation rate when direct hour costs were used as the allocation base was 200%
(= $1,350,000 ÷ $675,000). The unit cost report would show the following:
Ace
Best
Champ
Units produced
25,000
15,000
5,000
Direct materials
$40.00
$30.00
$ 55.00
Direct labor
15.00
15.00
15.00
Applied overhead (200% direct labor costs)
30.00
30.00
30.00
Unit cost
$85.00
$75.00
$100.00
Demonstration Problem 2
(Continued from Demonstration Problem 1)
Considering the nature of the production processes, the cost accountant of ABC Manufacturing
decided to experiment with the department-specific allocation approach and determined that the
Demonstration Problem 2 – Solution
For the Machining Department, the overhead allocation rate would be $150 per machine hour (=
$900,000 ÷ 6,000 machine hours).
For the Assembly Department, the overhead allocation rate would be 66.67% (= $450,000 ÷
$675,000).
Ace
Best
Champ
Units produced
25,000
15,000
5,000
Machine hours per unit
0.1
0.1
0.4
Direct materials
$40.00
$30.00
Direct labor
15.00
15.00
15.00
Applied overhead
Machining ($150 per machine hour)
15.00
15.00
60.00
Assembly (66.67% of direct labor costs)
10.00
10.00
Unit cost
$80.00
$70.00
Demonstration Problem 3
(Continued from Demonstration Problems 1 and 2)
The cost accountant of ABC Manufacturing attended a workshop on activity-based costing and
was impressed by the results. After consulting with the production personnel, he prepared the
following information on cost drivers and the estimated volume for each driver.
Cost Driver Volume
Activity
Cost Driver
Ace
Best
Champ
Total
Machining:
Setup
Number of setups
125
75
50
250
Machining
Machine hours
2,500
1,500
2,000
6,000
Assembly:
Assembly
Direct labor hours
25,000
15,000
5,000
45,000
Inspection
Number of inspections
50
25
25
100
The cost accountant also determined how much overhead costs were incurred in each of the four
activities as follows:
Activity
Overhead Costs
Machining:
Setup
$ 150,000
Machining
750,000
Total Machining department overhead
900,000
Assembly:
Assembly
Inspection
90,000
Total Assembly department overhead
450,000
Total overhead costs
$1,350,000
Required:
2. Use the activity-based costing method to determine the unit cost for each product.
Demonstration Problem 3 – Solution
Part 1
Activity
Cost drive rate
Machining:
Setup
$600 per setup (= $150,000 ÷ 250 setups)
Machining
$125 per machine hour (= $750,000 ÷ 6,000 machine hours)
Assembly:
Assembly
$8 per direct labor hour (= $360,000 ÷ 45,000 direct labor hours)
Inspection
$900 per inspection (= $90,000 ÷ 100 inspections)
Part 2
In the following table, the total costs are divided by the number of units to arrive at the unit cost
for each product.
Ace
Best
Champ
Direct materials
$1,000,000
$ 450,000
$275,000
Direct labor
375,000
225,000
75,000
Applied overhead
Setup ($600 per setup)
Machining ($125 per machine hour)
Assembly ($8 per direct labor hour)
Inspection ($900 per inspection)
45,000
22,500
22,500
Total overhead costs
632,500
375,000
342,500
Total costs
$2,007,500
$1,050,000
$692,500
Number of units
25,000
15,000
5,000
Unit cost
$ 80.30
$ 70.00
$ 138.50
Demonstration Problem 3 – Solution, continued
Alternatively, the following table shows direct calculation of unit cost for each product based on
consumption of the activities for each unit of the products.
Ace
Best
Champ
Units produced
25,000
15,000
5,000
Number of setups per unit
0.005
0.005
0.01
Machine hours per unit
0.1
0.1
0.4
Direct labor hours per unit
1
1
1
Number of inspections per unit
0.002
0.00167
0.005
Direct materials
$40.00
$30.00
$55.00
Direct labor
15.00
15.00
15.00
Applied overhead
Setup ($600 per setup)
3.00
3.00
6.00
Machining ($125 per machine hour)
12.50
12.50
50.00
Assembly ($8 per direct labor hour)
8.00
8.00
8.00
Inspection ($900 per inspection)
1.80
1.50
4.50
Unit cost
$80.30
$70.00
$138.50
Part 3
In summary, a comparison of the methods used to calculate unit cost for each product is
presented below.
Ace
Best
Champ
Plantwide rate based on machine hours
$77.50
$67.50
$160.00
Plantwide rate based on direct labor costs
85.00
75.00
100.00
Department rates
80.00
70.00
140.00
Activity-based costing
80.30
70.00
138.50