275
E9–19, Concluded
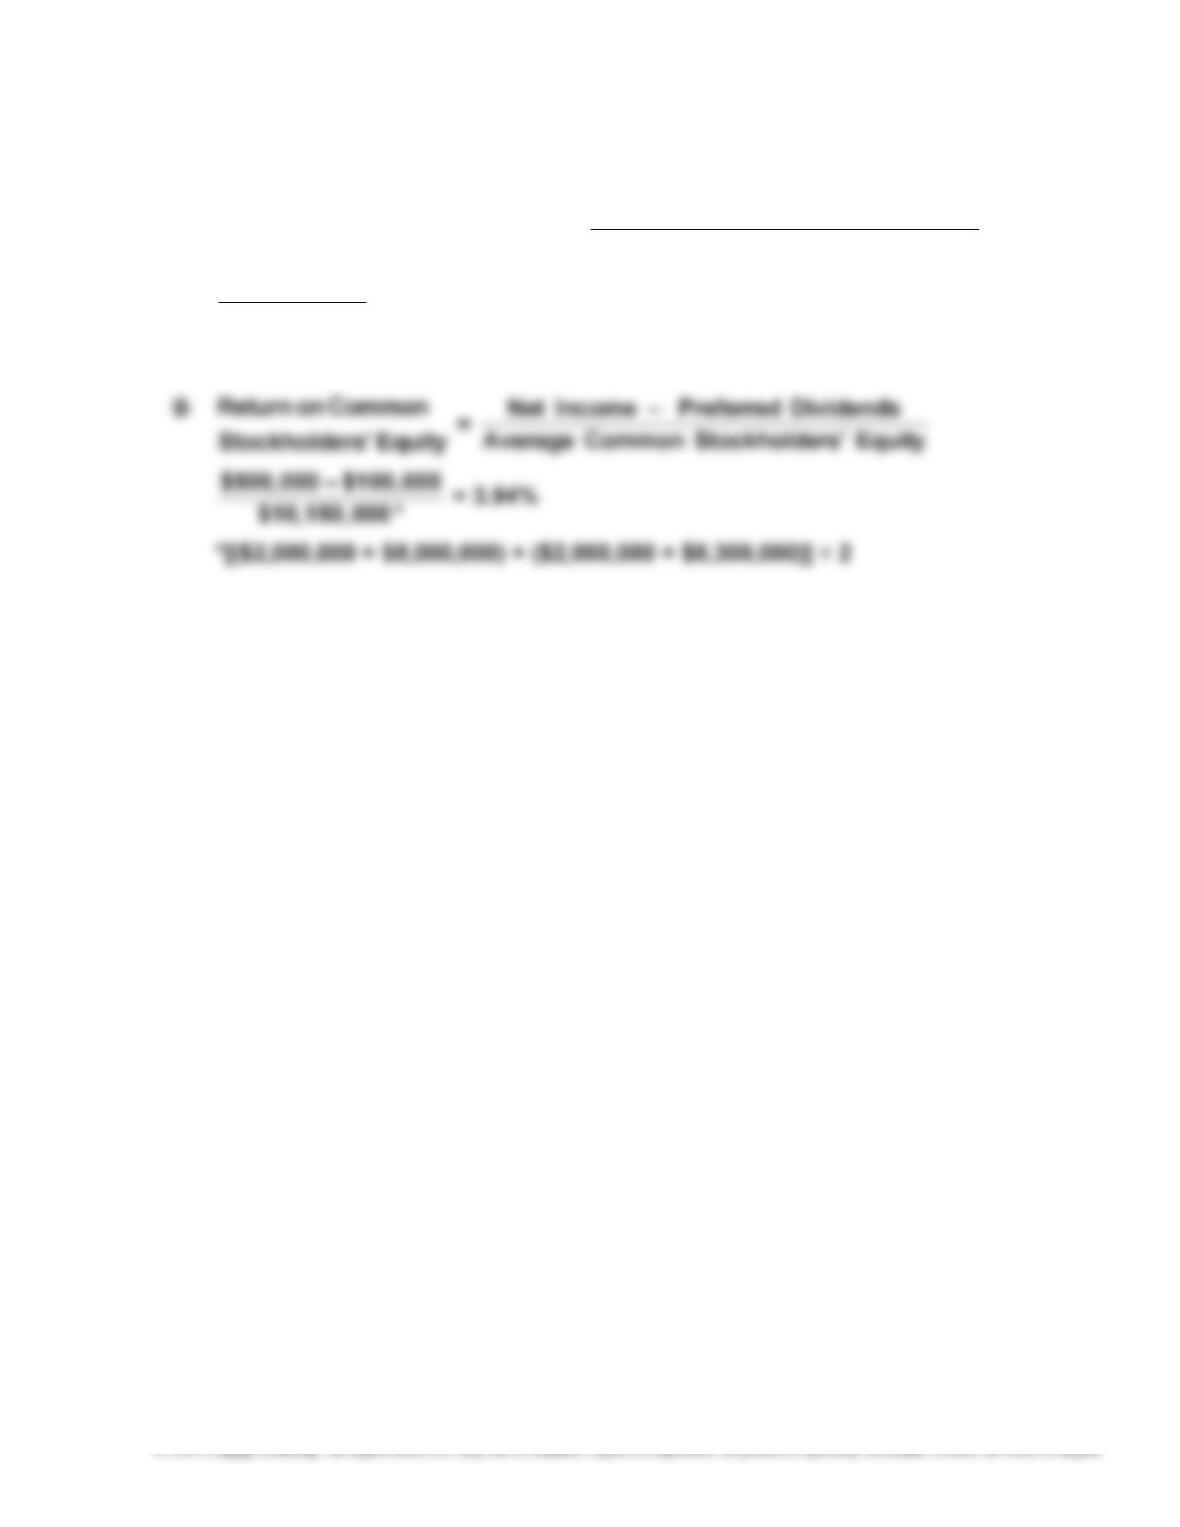
f. Return on Stockholders’ Equity = Net Income
Average Total Stockholders’ Equity
$500,000
$11,150,000 * = 4.48%
*[($8,000,000 + $1,000,000 + $2,000,000) + $11,300,000] ÷ 2
276
E9–20
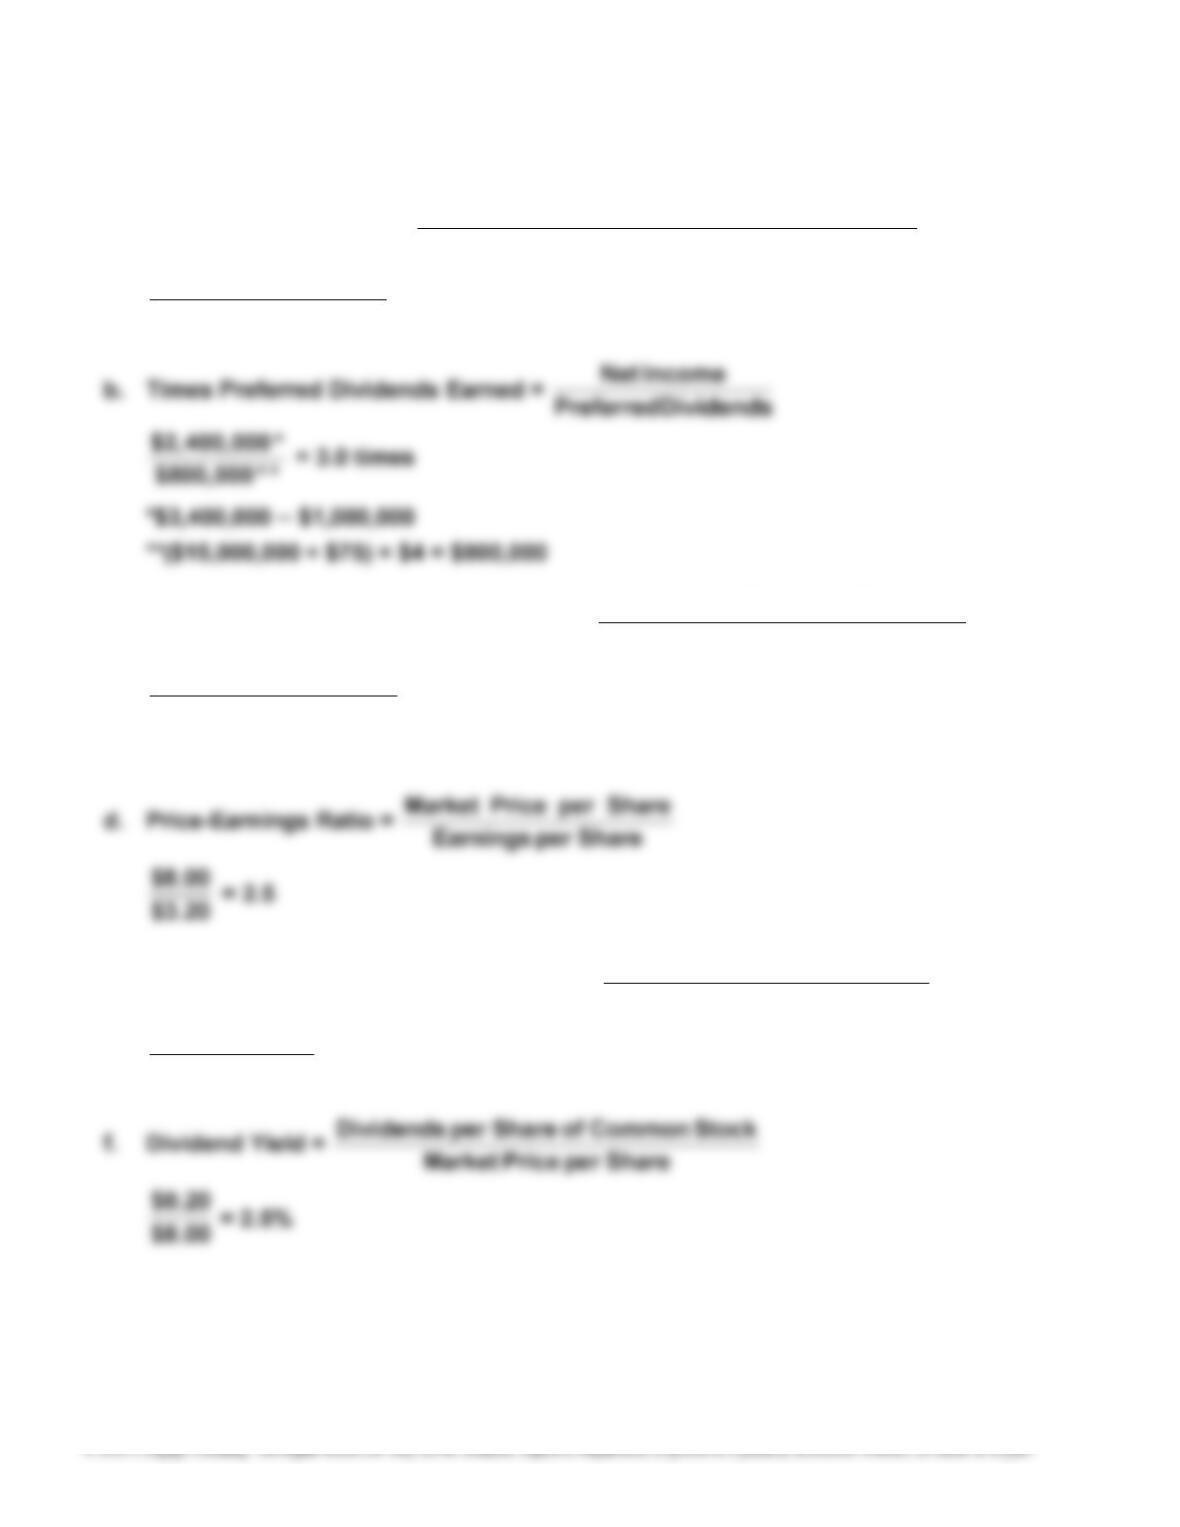
a. Times Interest Earned =
Income Before Income Tax + Interest Expense
Interest Expense
$400,000
$400,000 + $3,400,000 = 9.5
c. Earnings per Share on Common Stock = Net Income –– Preferred Dividends
Common Shares Outstandin
g
$2,400,000 –– $800,000
500,000 * shares = $3.20
*$3,500,000 ÷ $7 = 500,000
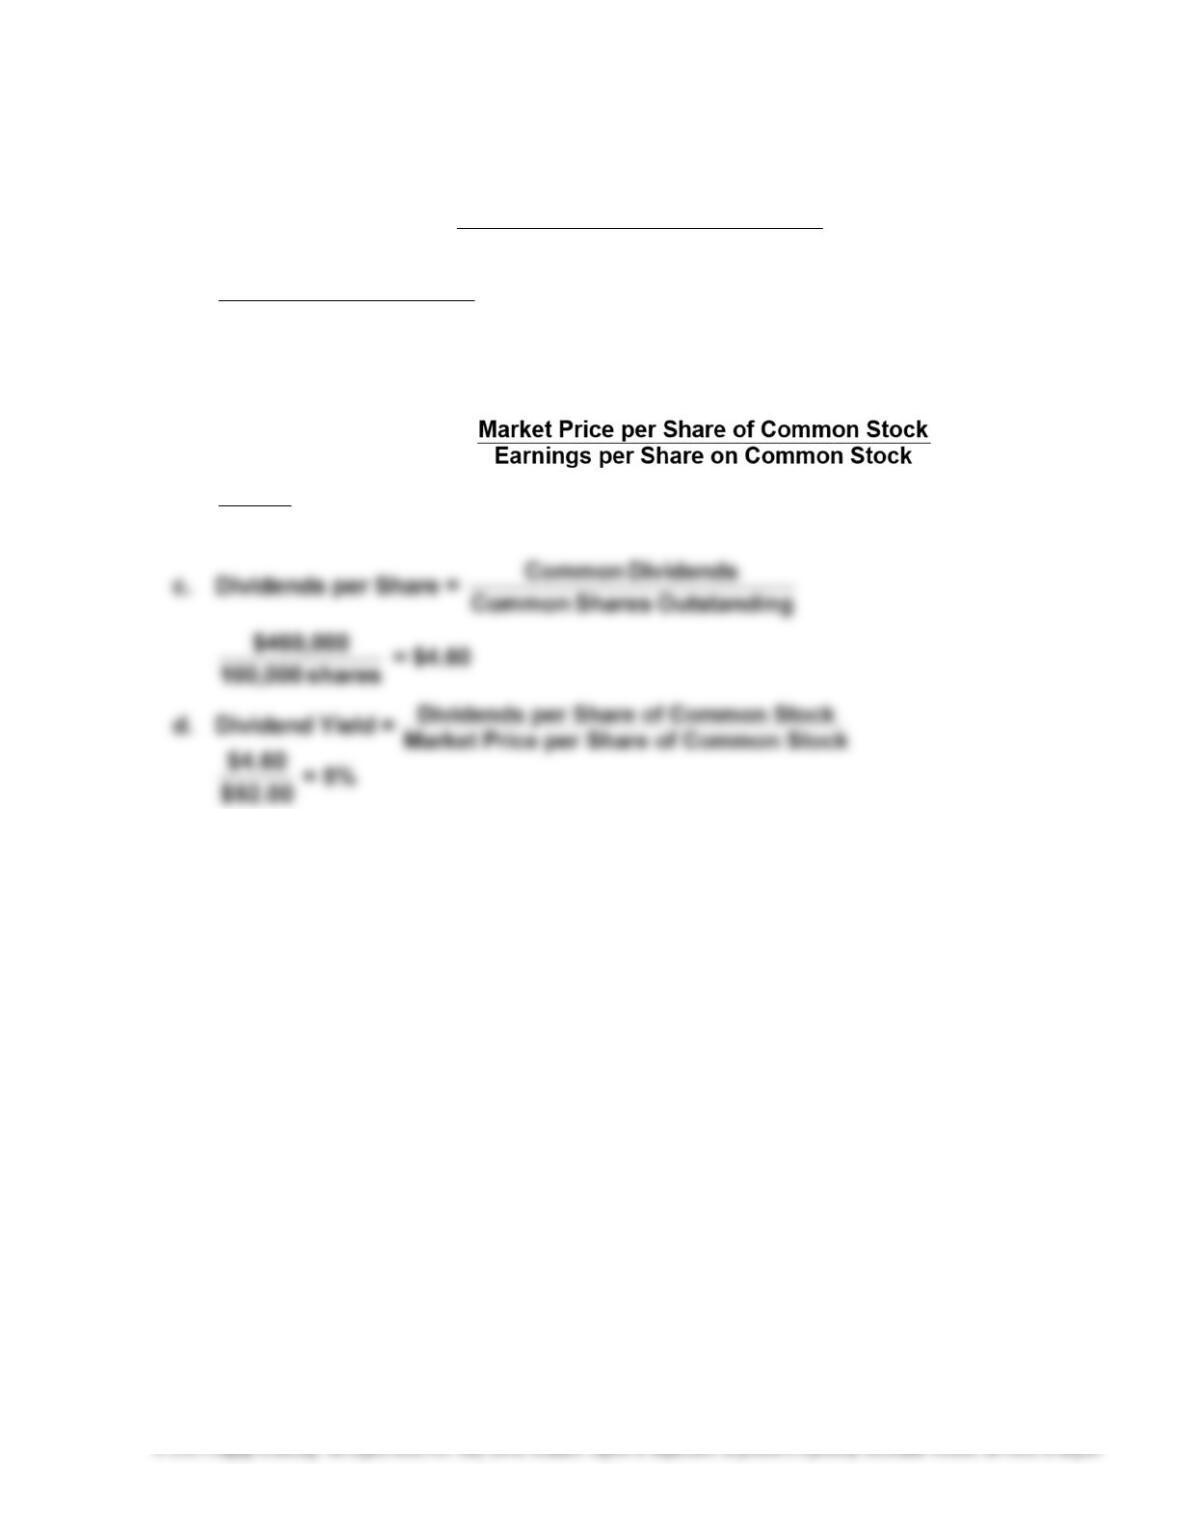
e. Dividends per Share of Common Stock = gOutstandin Shares Common
Dividends Common
shares 500,000
$100,000 = $0.20
277
E9–21
a. Earnings per Share =
Net Income –– Preferred Dividends
Common Shares Outstanding
$1,300,000 –– $150,000*
100,000** shares
= $11.50
*($2,250,000 ÷ $90) × $6 = $150,000
**$12,500,000 ÷ $125 = 100,000 shares
b. Price-Earnings Ratio =
$11.50
$92.00
= 8.0
278
E9–22
a. Price-Earnings Ratio = Share per Earnings
Share per PriceMarket
Dividend Yield = Share per PriceMarket
Share per Dividends
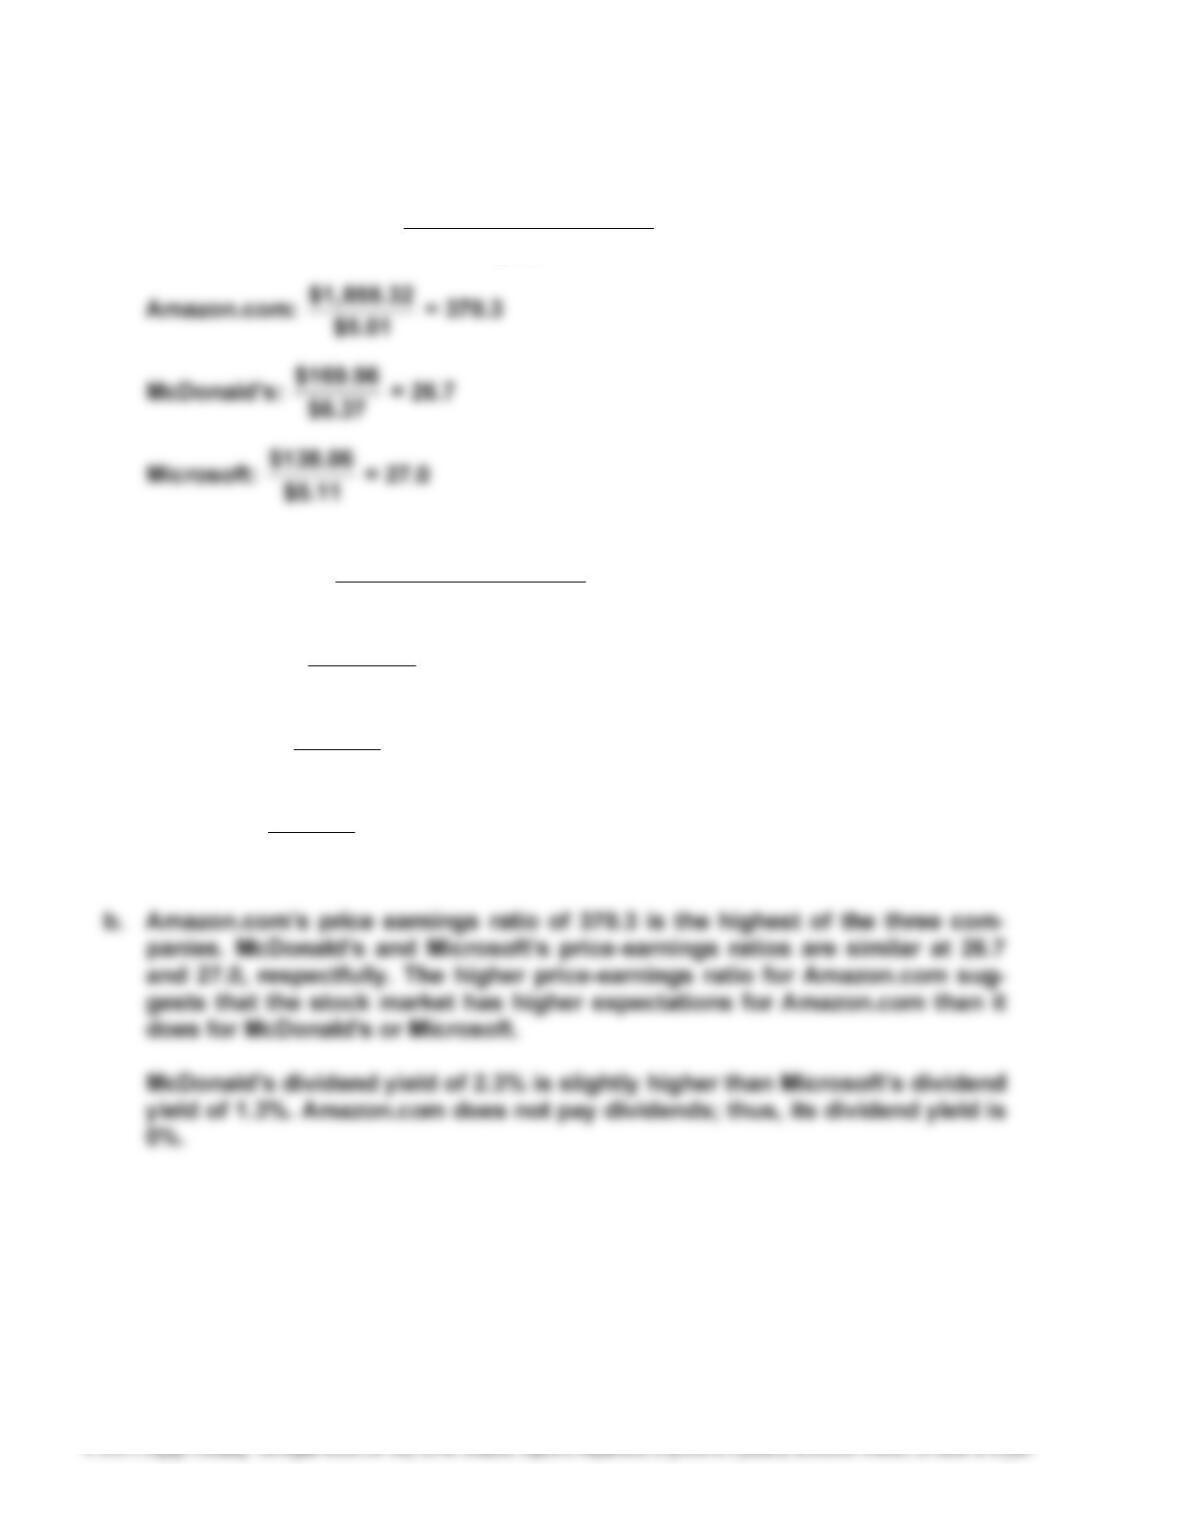
Amazon.com:
$0.00
$1,855.32 = 0%
McDonald’s:
$3.83
$169.96 = 2.3%
Microsoft:
$1.84
$138.06 = 1.3%
Appendix E9–23
a. NR d. NR
a.
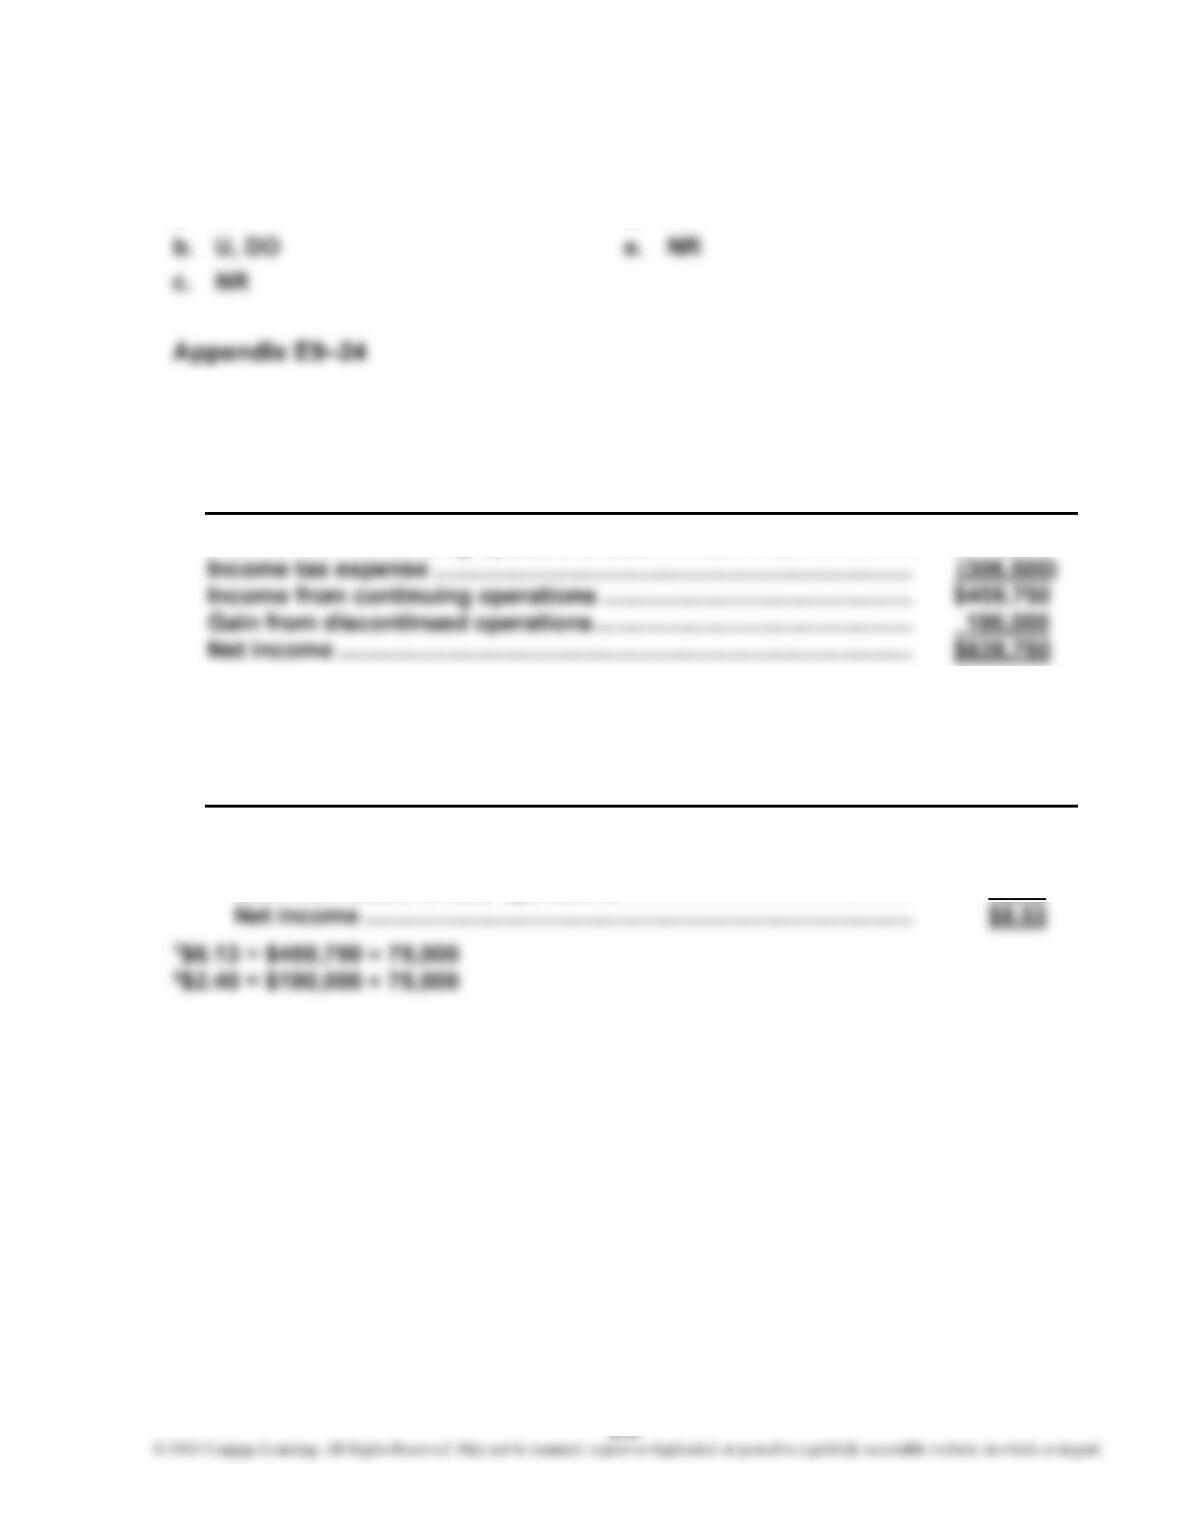
LEADBETTER INC.
Partial Income Statement
For the Year Ended December 31, 20Y3
Income from continuing operations before income tax …………….. $766,250
b.
LEADBETTER INC.
Partial Income Statement
For the Year Ended December 31, 20Y3
Earnings per common share:
Income from continuing operations …………………………………….. $6.131
Gain from discontinued operations ……………………………………… 2.402
280
PROBLEMS
P9–1
1.
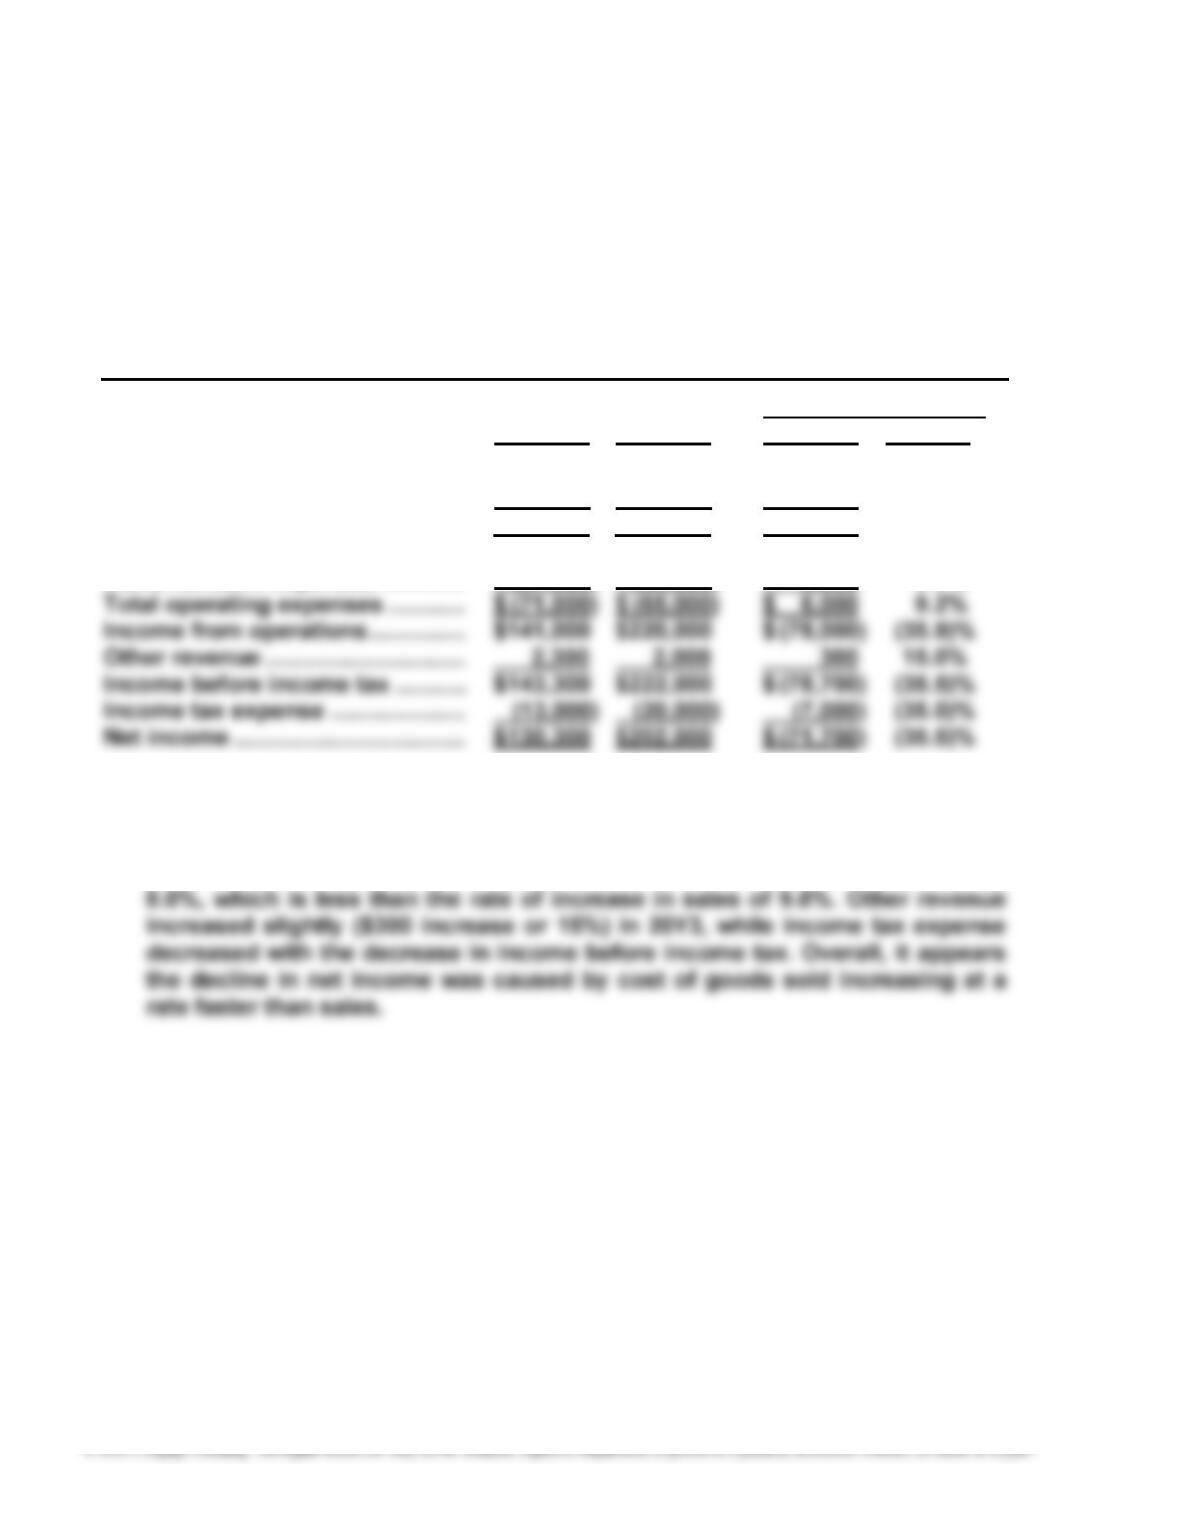
GREYHOUND TECHNOLOGY COMPANY
Comparative Income Statement
For the Years Ended December 31, 20Y3 and 20Y2
Increase (Decrease)
20Y3 20Y2 Amount Percent
Sales ………………………………………. $862,000 $785,000 $ 77,000 9.8%
Cost of goods sold ………………….. (650,000) (500,000) 150,000 30.0%
Gross profit …………………………….. $212,000 $285,000 $ (73,000) (25.6)%
Selling expenses …………………….. $ (44,000) $ (40,000) $ 4,000 10.0%
Administrative expenses …………. (27,000) (25,000) 2,000 8.0%
2. Net income declined from $202,000 in 20Y2 to $130,300 in 20Y3. Sales
increased by 9.8%; cost of goods sold increased by 30.0%, causing the gross
profit to decline by 25.6%. Selling expenses increased slightly more than
sales (10.0% compared to 9.8%), and administrative expenses increased by
281
P9–2
1.
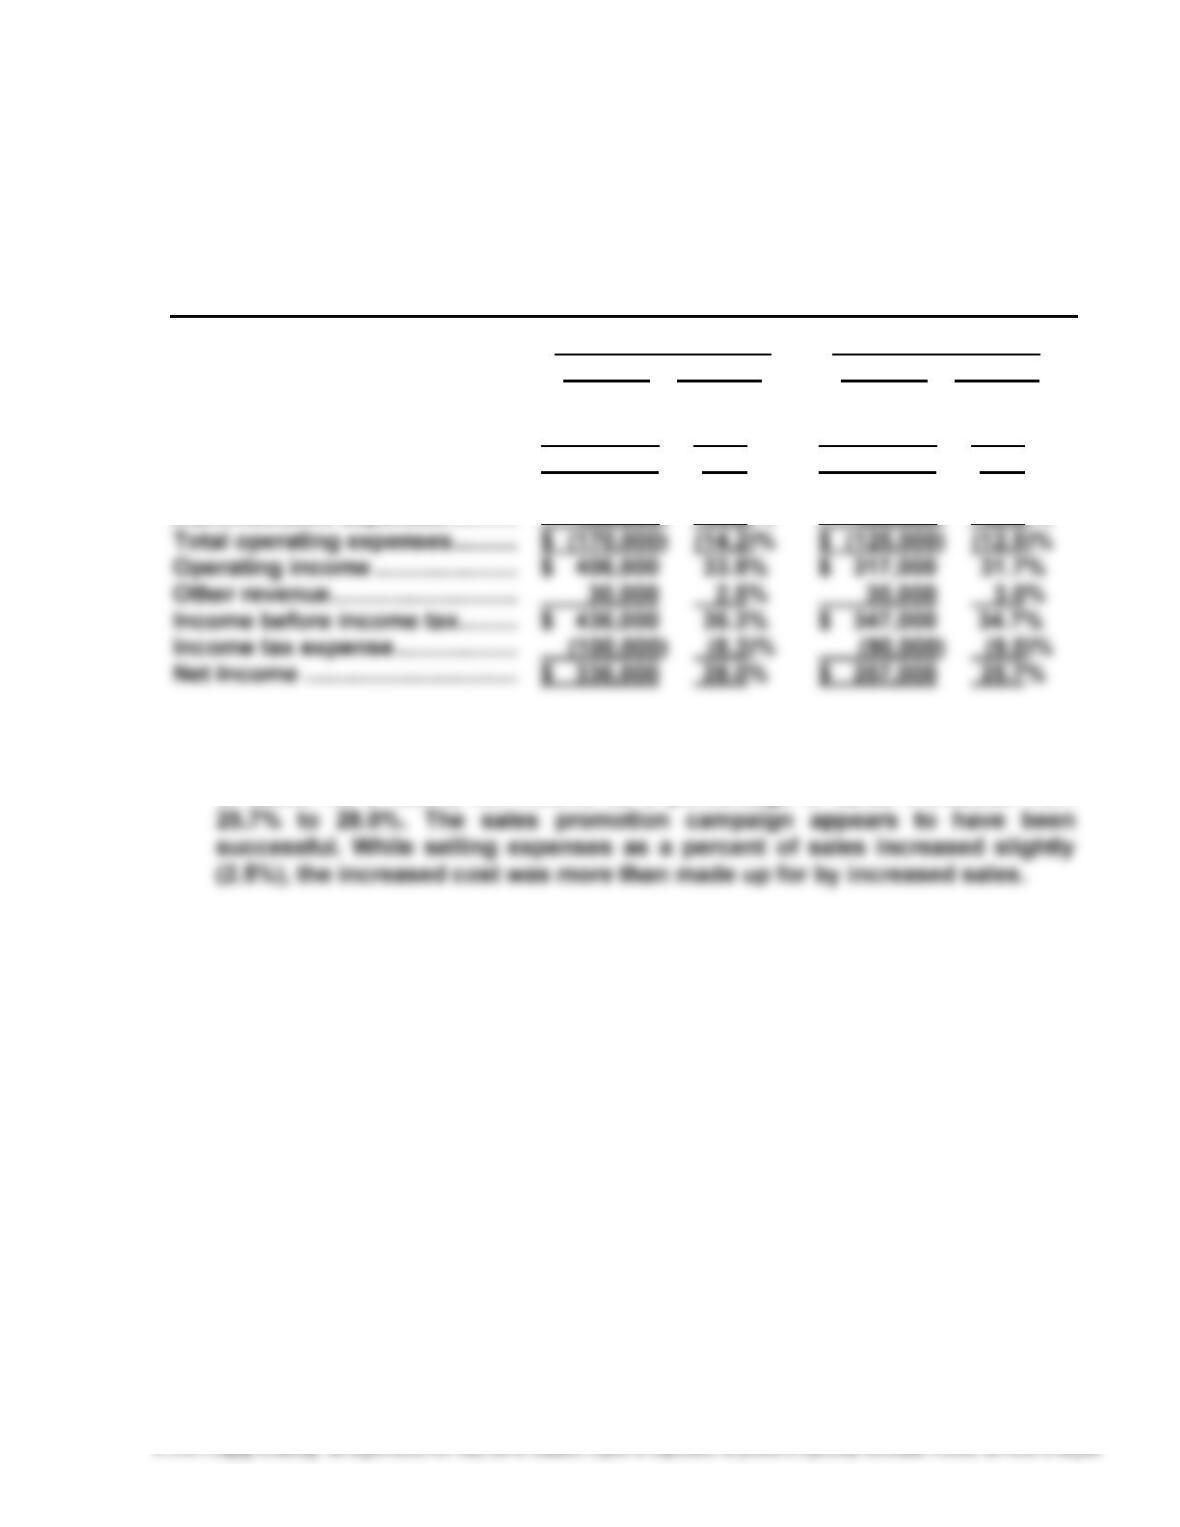
FISHING EXPERIENCES INC.
Comparative Income Statement
For the Years Ended December 31, 20Y6 and 20Y5
20Y6 20Y5
Amount Percent Amount Percent
Sales ……………………………………. $ 1,200,000 100.0% $ 1,000,000 100.0%
Cost of goods sold ……………….. (624,000) (52.0)% (558,000) (55.8)%
Gross profit ………………………….. $ 576,000 48.0% $ 442,000 44.2%
Selling expenses …………………... $ (120,000) (10.0)% $ (75,000) (7.5)%
2. The vertical analysis indicates that the costs other than selling expenses
(cost of goods sold and administrative expenses) improved as a percentage
of sales. As a result, net income as a percentage of sales increased from
282
P9–3
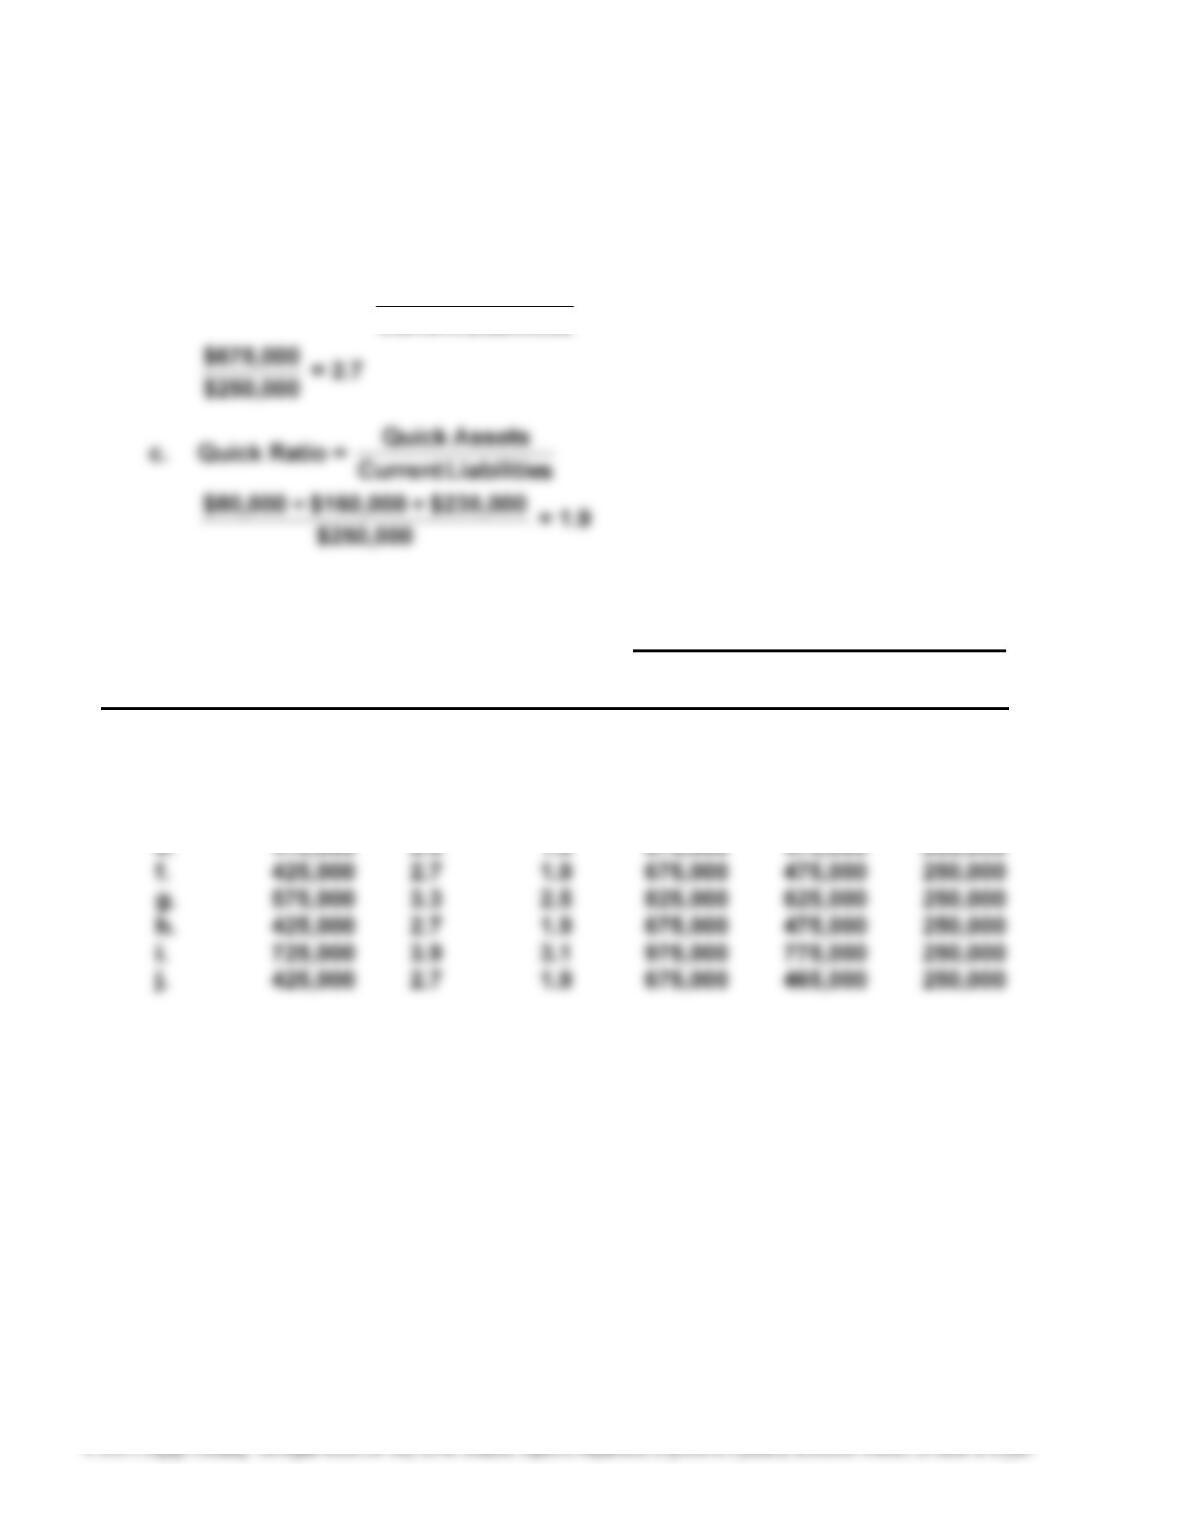
1. a. Working Capital = Current Assets – Current Liabilities
$675,000 – $250,000 = $425,000
b. Current Ratio = sLiabilitieCurrent
setsCurrent As
2.
Supporting Calculations
Working Current Quick Current Quick Current
Transaction Capital Ratio Ratio Assets Assets Liabilities
a. $ 425,000 2.7 1.9 $675,000 $ 475,000 $250,000
b. 425,000 3.0 2.1 635,000 435,000 210,000
c. 425,000 2.3 1.5 750,000 475,000 325,000
d. 425,000 2.9 2.0 645,000 445,000 220,000
283
P9–4
1. Working capital: $2,790,000
$3,690,000 – $900,000
4. Accounts receivable turnover: 16.0
$10,000,000 ÷ [($740,000 + $510,000) ÷ 2]
5. Day’s sales in receivables: 22.8
$10,000,000 ÷ 365 = $27,397
[($740,000 + $510,000) ÷2] ÷ $27,397
8. Debt ratio: 26.6%
$2,600,000 ÷ $9,780,000
9. Ratio of liabilities to stockholders’ equity: 0.4
$2,600,000 ÷ $7,180,000
10. Ratio of fixed assets to long-term liabilities: 2.2
$3,740,000 ÷ $1,700,000
11. Times interest earned: 7.6
($1,130,000 + $170,000) ÷ $170,000
284
P9–4, Concluded
17. Earnings per share: $8.55
($900,000 – $45,000) ÷ 100,000 shares
18. Price-earnings ratio: 14.0
$119.70 ÷ $8.55
285
P9–5
1. a.
15%
20%
25%
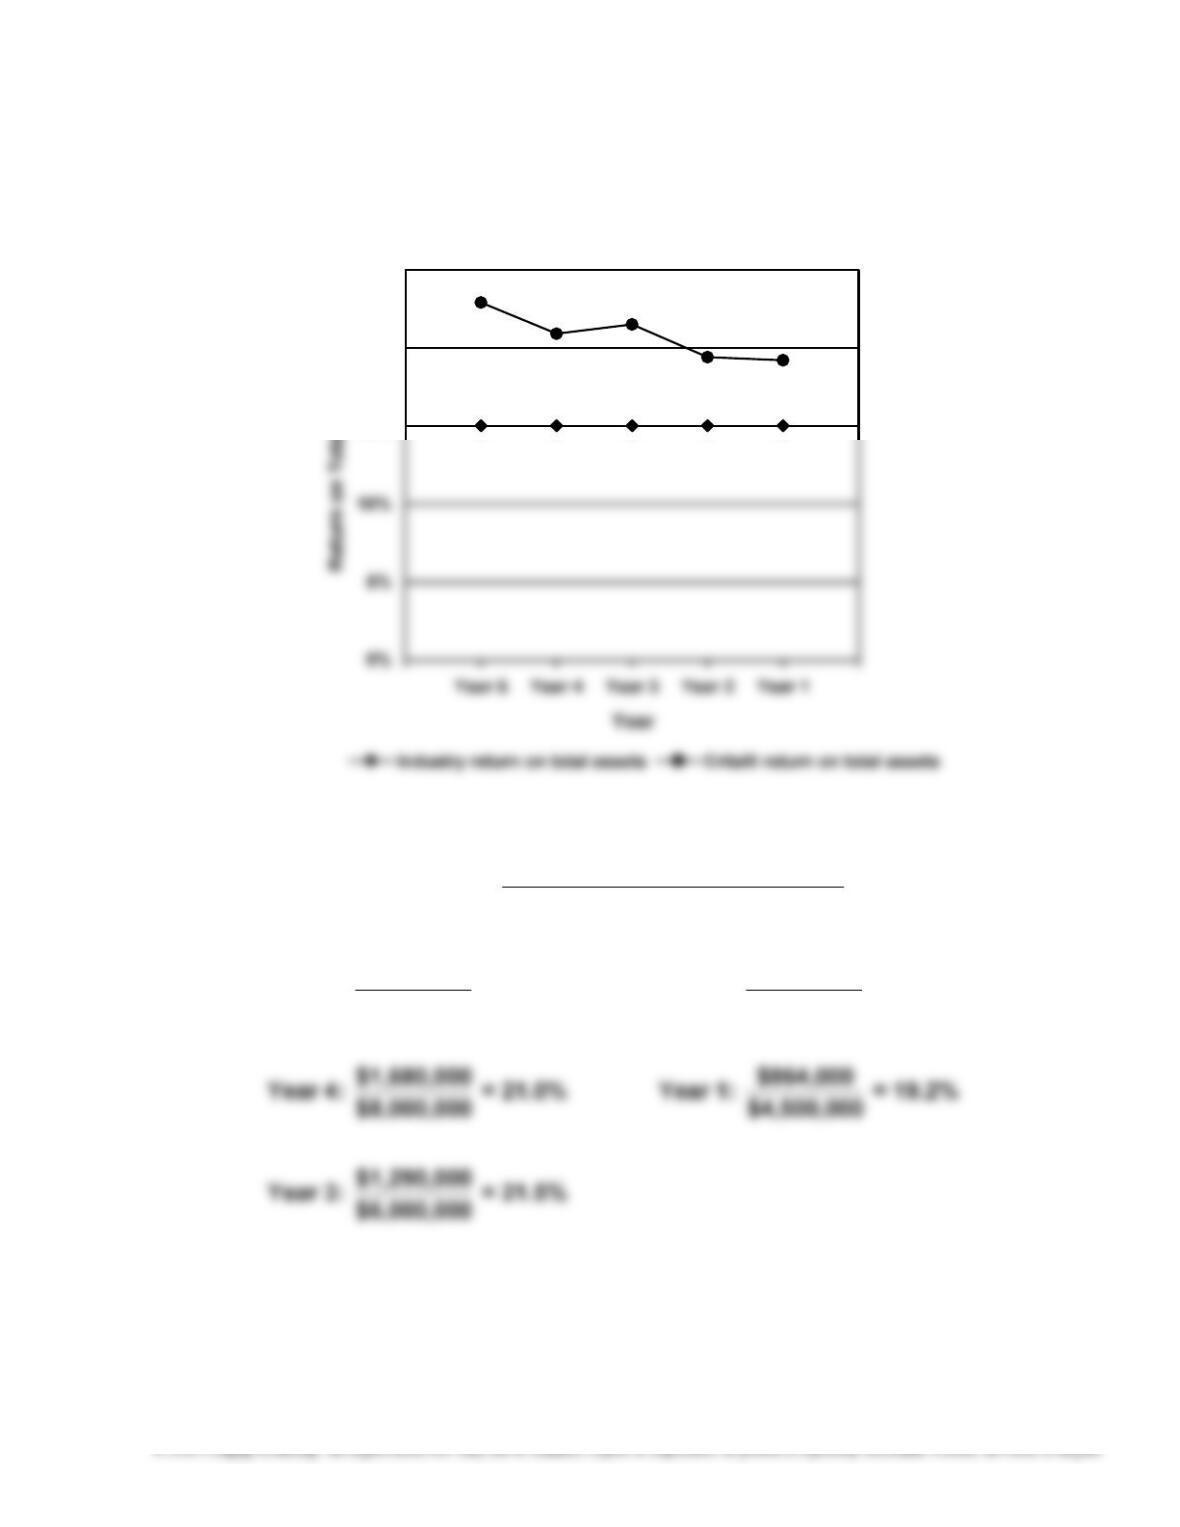
Return on Total Assets = AssetsTotal Average
ExpenseInterest +IncomeNet
Year 5:
$9,500,000
$2,185,000 = 23.0% Year 2: $5,200,000
$1,008,800 = 19.4%