286
P9–5, Continued
1. b.
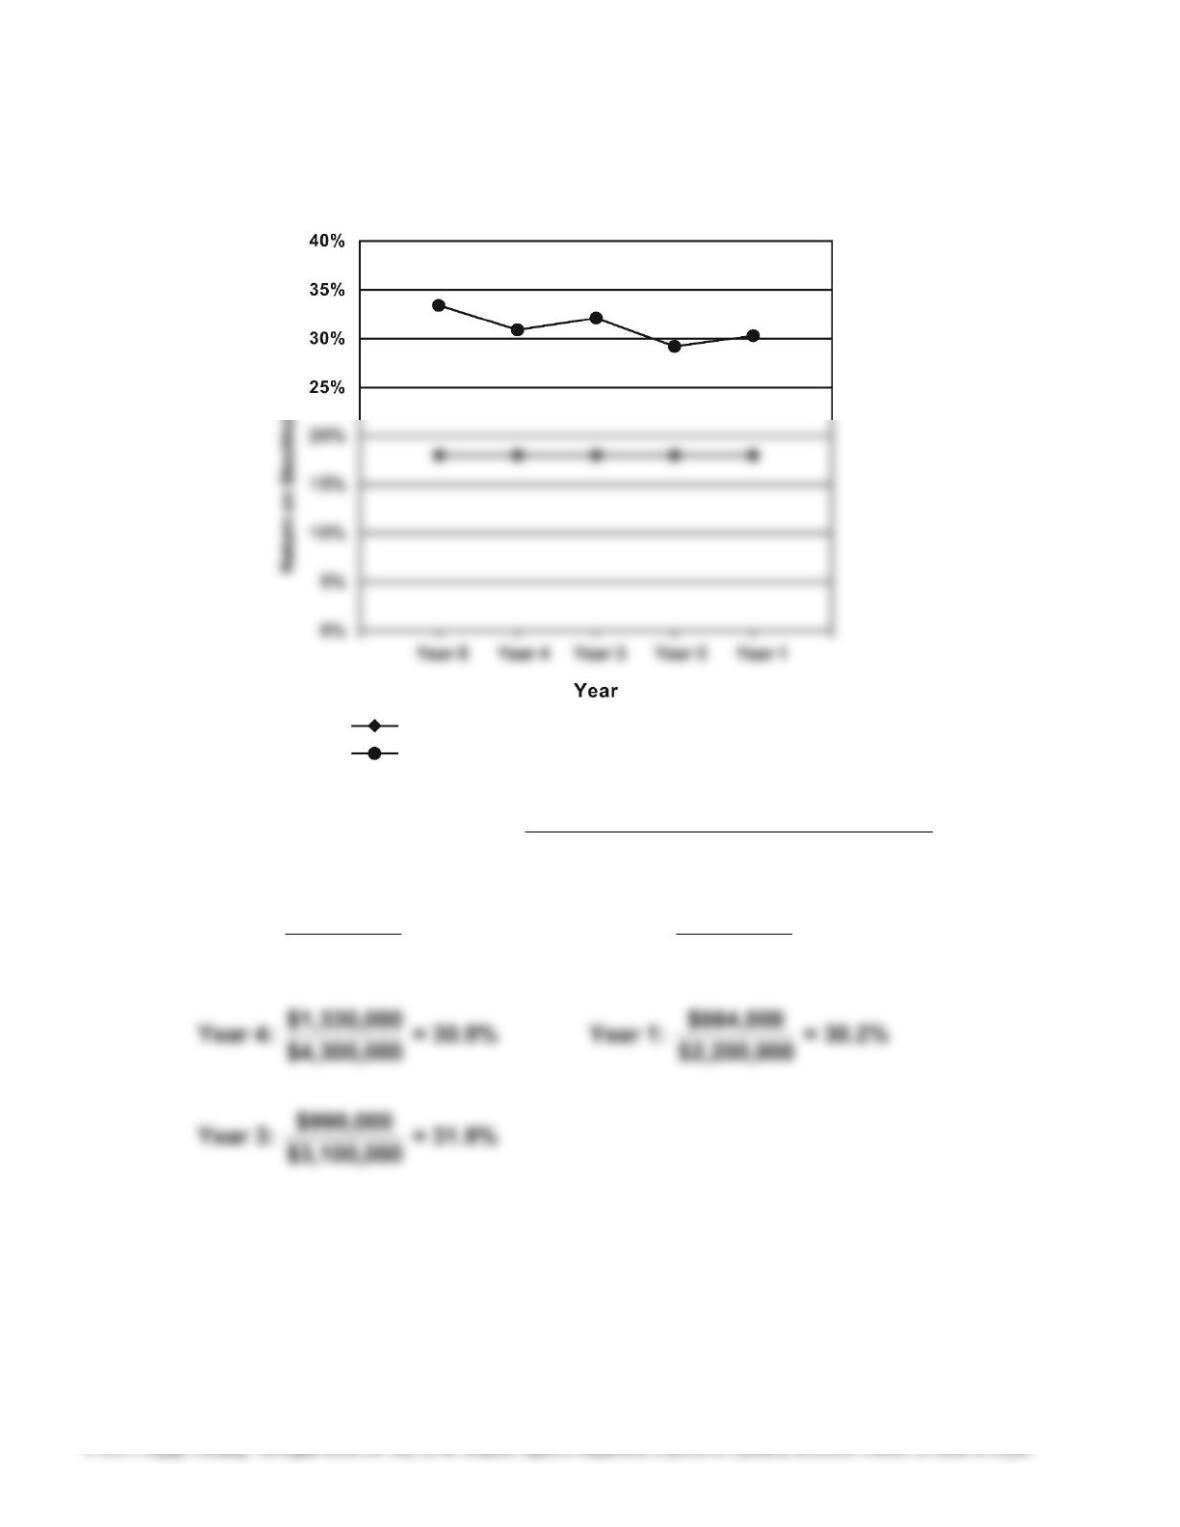
Return on Stockholders’ Equity = Equity rs’Stockholde Total Average
IncomeNet
Year 5:
$5,400,000
$1,785,000 = 33.1% Year 2: $2,650,000
$768,800 = 29.0%
Critelli return on stockholders’ equity
Industry return on stockholders’ equity
287
P9–5, Continued
1. c.
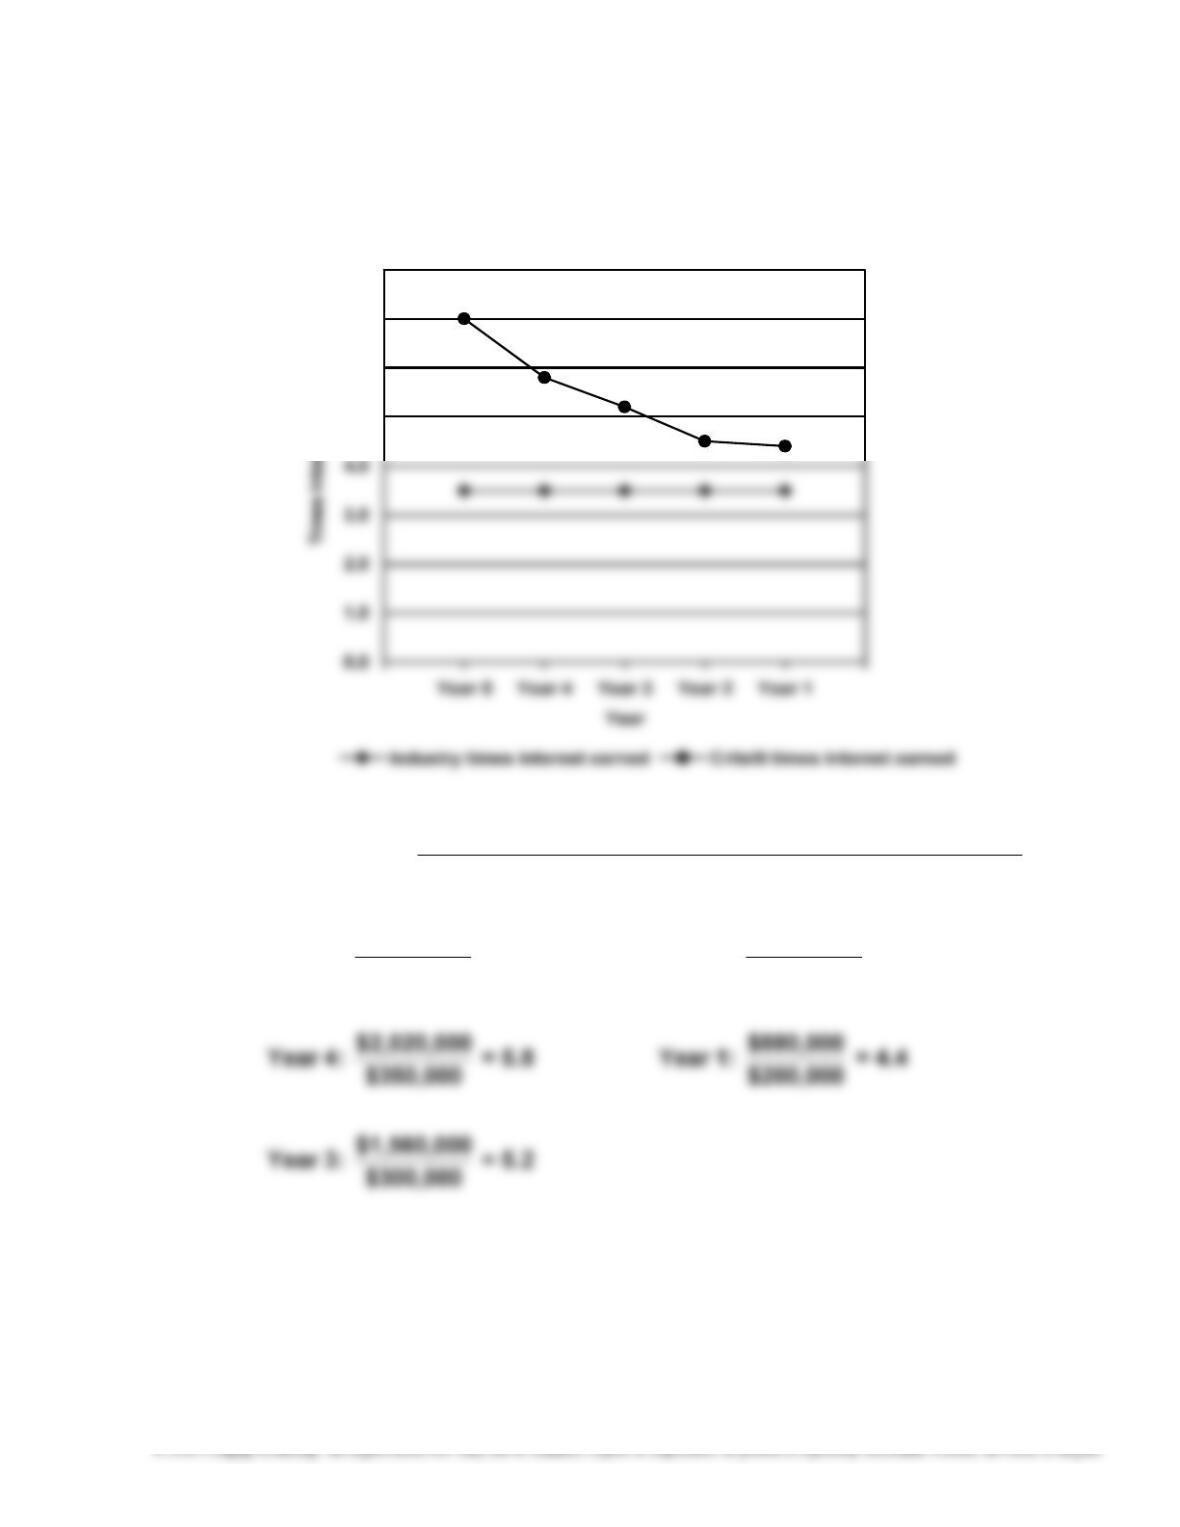
5.0
6.0
7.0
8.0
Times Interest
Earned = Expense Interest
Expense Interest+ExpenseTax Income+Income Net
Year 5:
$400,000
$2,800,000 = 7.0 Year 2: $240,000
$1,080,000 = 4.5
288
P9–5, Concluded
2. The return on total assets and the return on stockholders’ equity are above
the industry average for all five years. The return on total assets is improving
gradually. The return on stockholders’ equity exceeds the return on total
assets, providing evidence of the positive use of leverage.
289
CASES
Case 9–1
This position does not allow the shareholders to take advantage of leverage. As a
result, the return on shareholders’ equity cannot be improved by using debt. In
contrast, a low or no debt load does provide the company great flexibility in the
case of a national calamity. However, the “no debt” position only makes sense
within the “national calamity” scenario. Within normal business operations, most
Case 9–2
Kim is concerned about the inventory and accounts receivable levels because
she must determine their value. Inventory that cannot be sold (or must be sold at
a large discount) or accounts receivable that cannot be collected must be written
down to reflect their reduced value. Kim has conducted the ratio analysis and
interviewed Brad to help make this determination. The inventory and accounts
receivable levels have grown alarmingly. Brad’s response to Kim is not
290
Case 9–3
APPLE AND BEST BUY
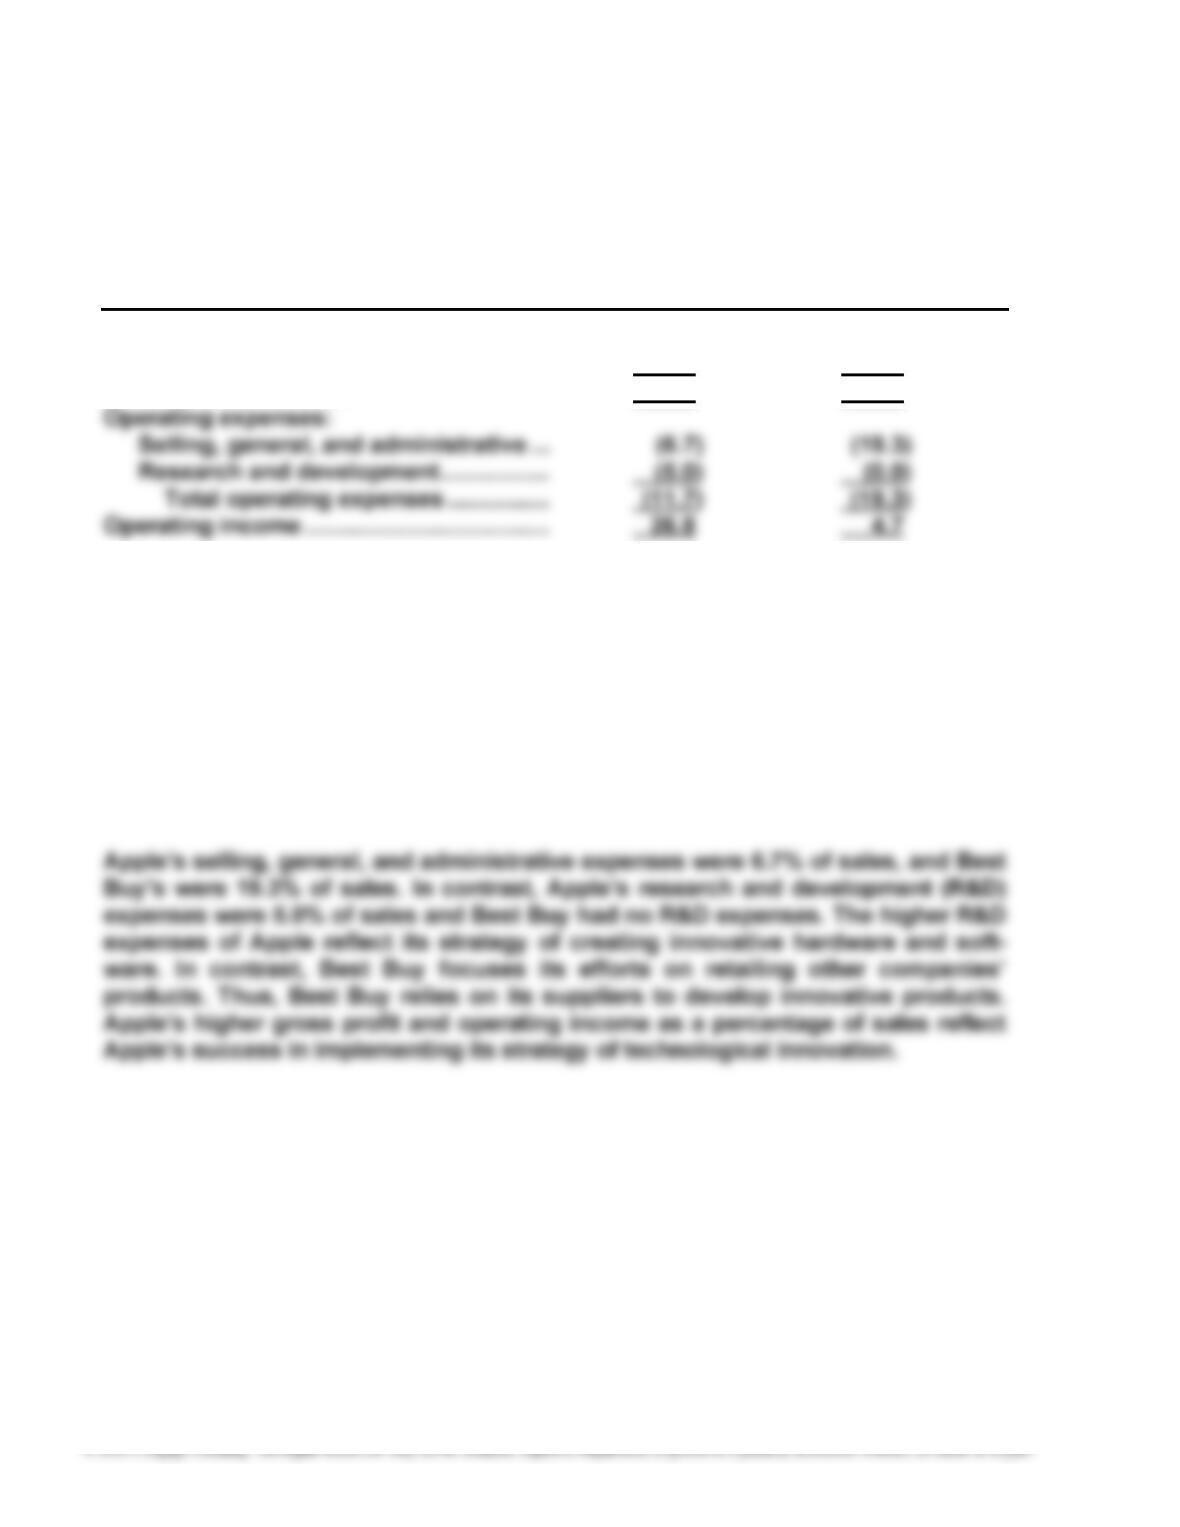
Common-Sized Statements
Apple Best Buy
Sales ………………………………………………….. 100.0% 100.0%
Cost of sales ………………………………………. (61.5) (76.0)
Gross profit ………………………………………… 38.5 24.0
The common-sized analysis indicates Apple and Best Buy are very different
companies. Apple’s income from operations was 26.8% of sales, and Best Buy’s
was 4.7% of sales. There is a 22.1 percentage point difference between the two
companies.
The gross profit for Apple was 38.5% of sales. In contrast, Best Buy had a gross
profit of 24.0% of sales, which is 14.5 percentage points fewer than Apple. This
suggests Apple is able to charge higher prices than Best Buy for its products.
291
Case 9–4
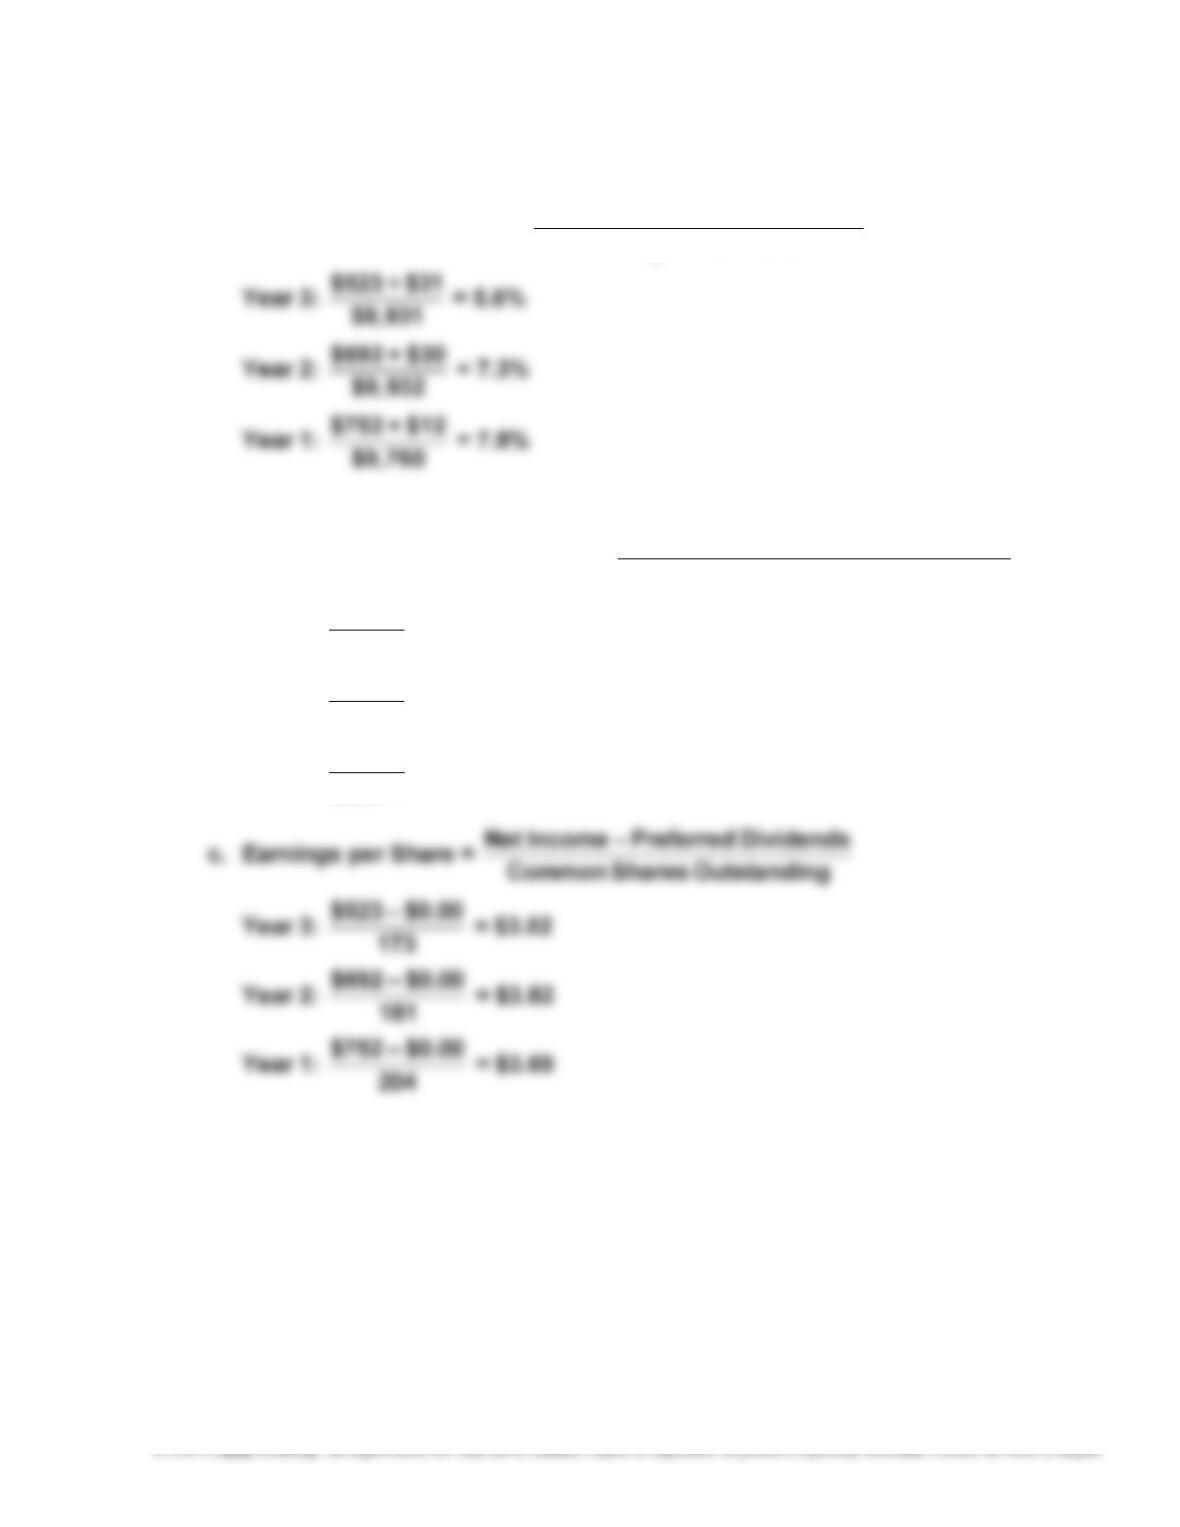
1. a. Return on Total Assets = AssetsTotal Average
Expense Interest + Income Net
b. Return on Stockholders’ Equity = Equity rs’Stockholde Total Average
IncomeNet
Year 3:
$523
$1,882 = 27.8%
Year 2:
$692
$1,880 = 36.8%
Year 1:
$752
$2,374 = 31.7%
292
Case 9–4, Continued
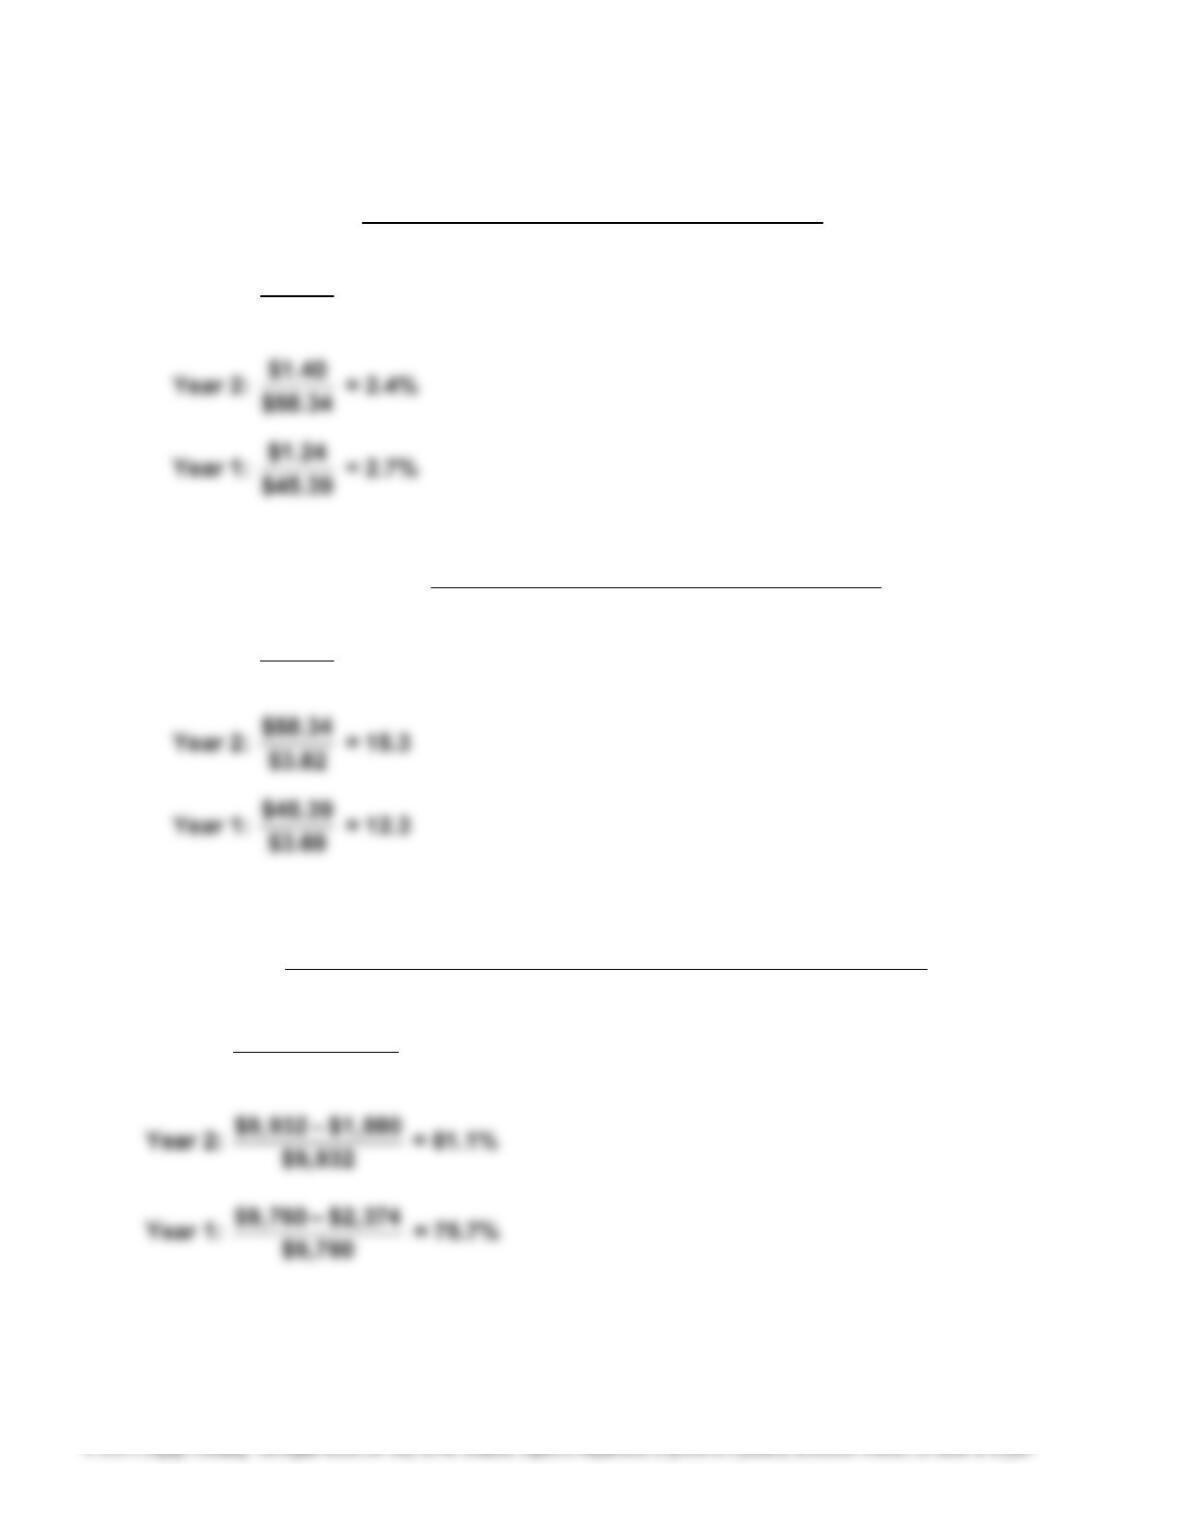
d. Dividend Yield = Dividend per Share of Common Stock
Market Price per Share of Common Stock
Year 3:
$1.46
$50.88 = 2.9%
e. Price-Earnings Ratio = Stock Common of Share per Earnings
Stock Common of Share per PriceMarket
Year 3:
$50.88
$3.02 = 16.8
2.
Average Total Assets –– Average Total Stockholders’ Equit
y
Debt Ratio = Average Total Assets
Year 3: $9,931-– $1,882
$9,931 = 81.0%
293
Case 9–4, Concluded
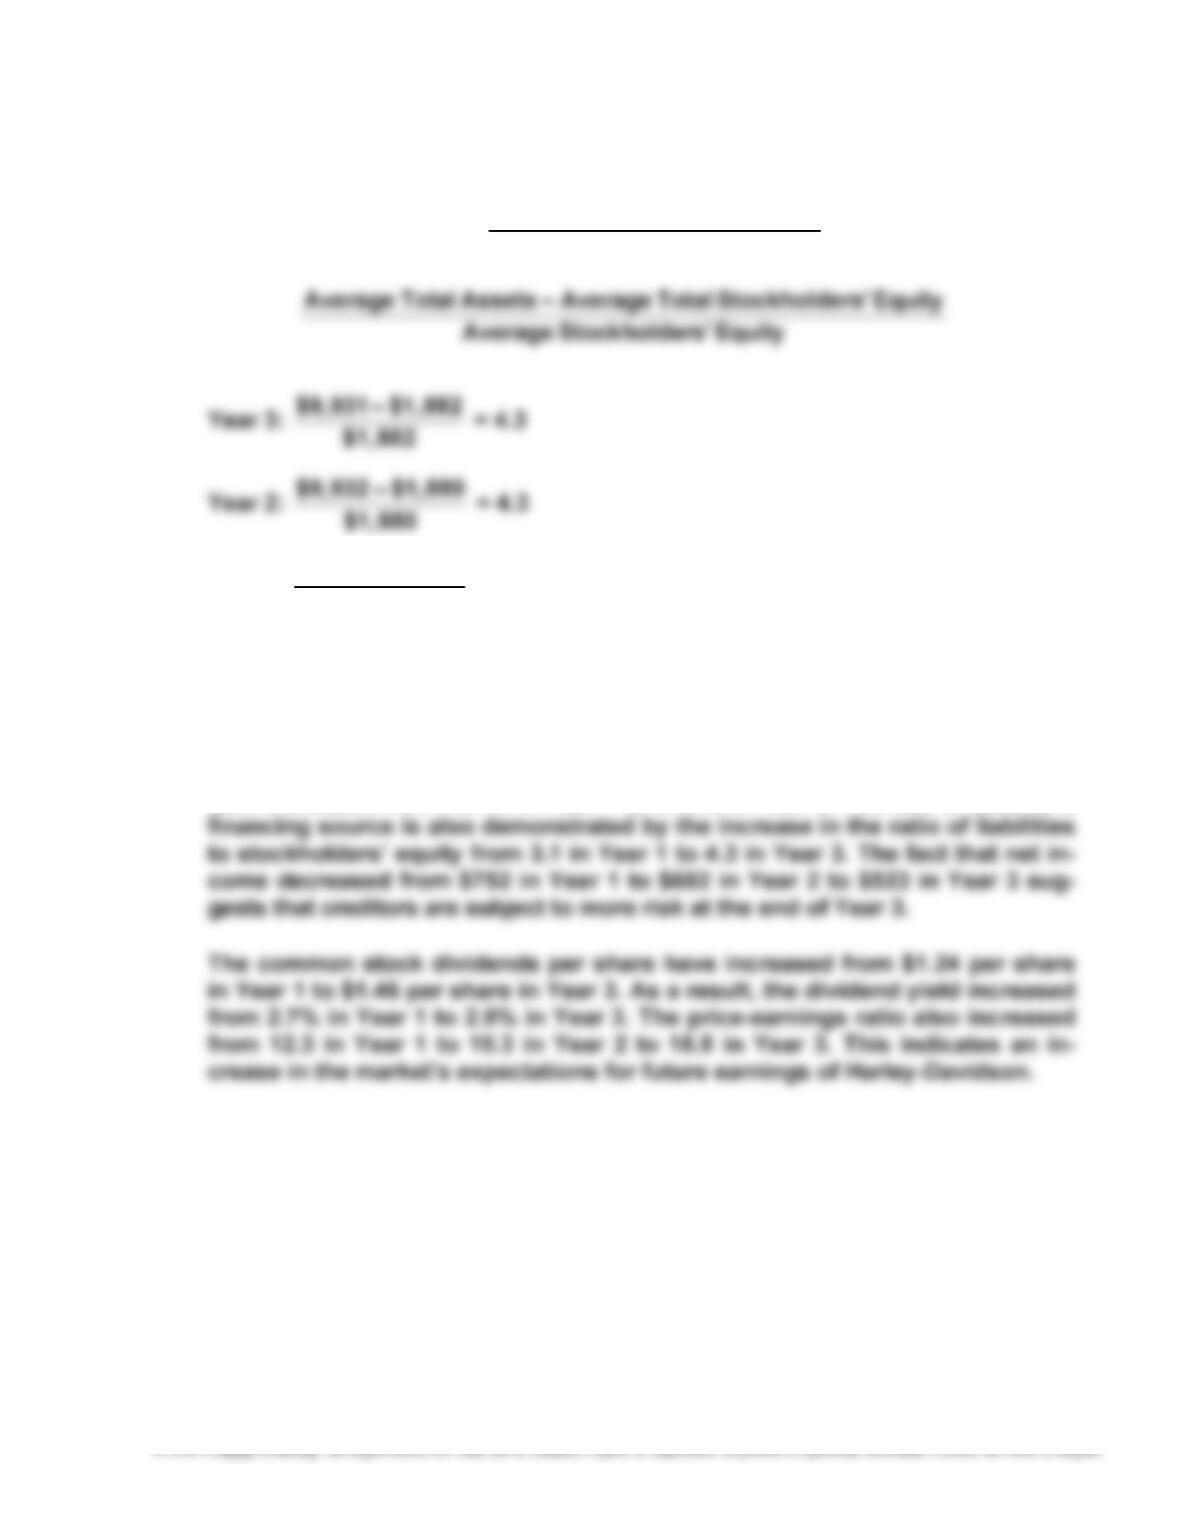
Ratio of Liabilities to
Stockholders’ Equity = Average Liabilities
Average Stockholders’ Equity =
Year 1:
$9,760 ––$2,374
$2,374 = 3.1
3. Harley-Davidson’s profitability, as measured by earnings per share, has fluc-
tuated from $3.69 in Year 1 to $3.82 in Year 2 and to $3.02 in Year 3. Its return
on total assets decreased between years, from 7.8% in Year 1 to 7.3% in Year 2
and 5.6% in Year 3. However, its return on stockholders’ equity fluctuated from
31.7% in Year 1 to 36.8% in Year 2 to 27.8% in Year 3. Harley-Davidson’s debt
ratio increased from 75.7% in Year 1 to 81.0% in Year 3. The use of debt as a
294
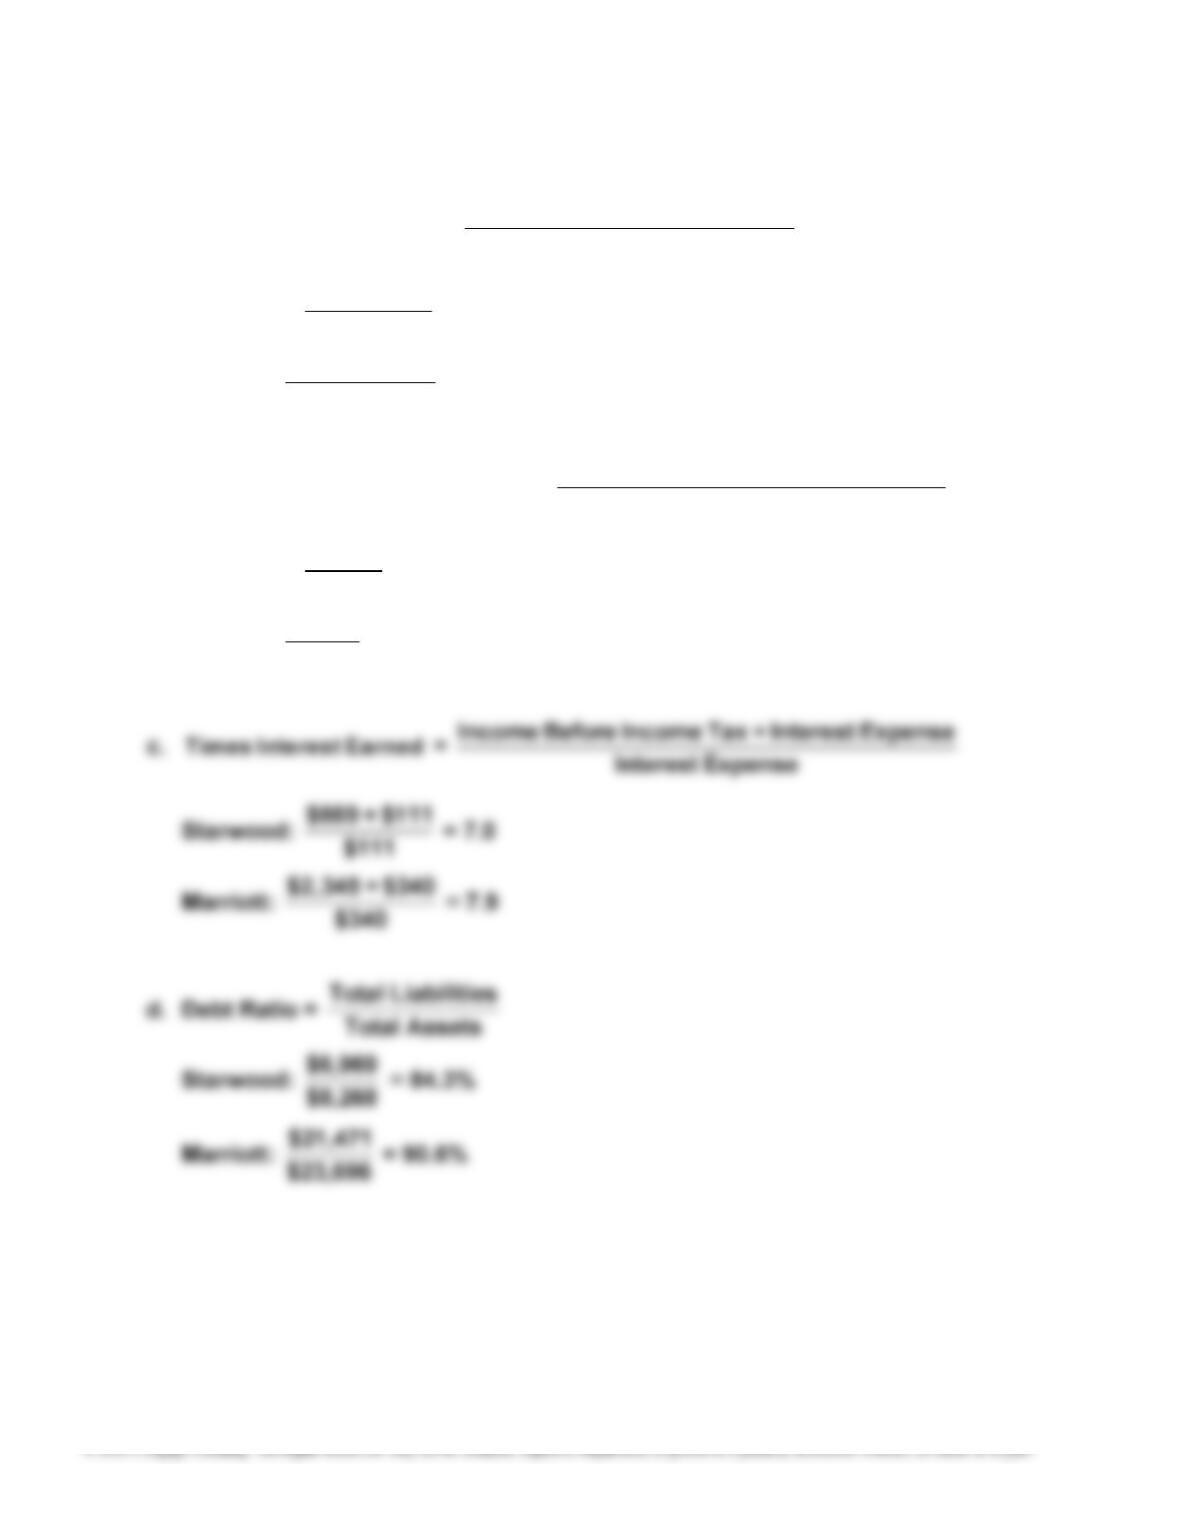
Case 9–5
1. a. Return on Total Assets = AssetsTotal Average
Expense Interest + Income Net
Starwood:
$489 + $111
$8,464 = 7.1%
Marriott:
$1,907 + $340
$23,771 = 9.5%
b. Return on Stockholders’ Equity = Equity rs’Stockholde Total Average
IncomeNet
Starwood:
$489
$1,414 = 34.6%
Marriott:
$1,907
$2,904 = 65.7%
295
Case 9–5, Concluded
e. Ratio of Liabilities to Stockholders’ Equity = Total Liabilities
Total Stockholders’ Equity
Starwood:
$6,969
$1,299 = 5.4
Marriott:
$21,471
$2,225 = 9.6
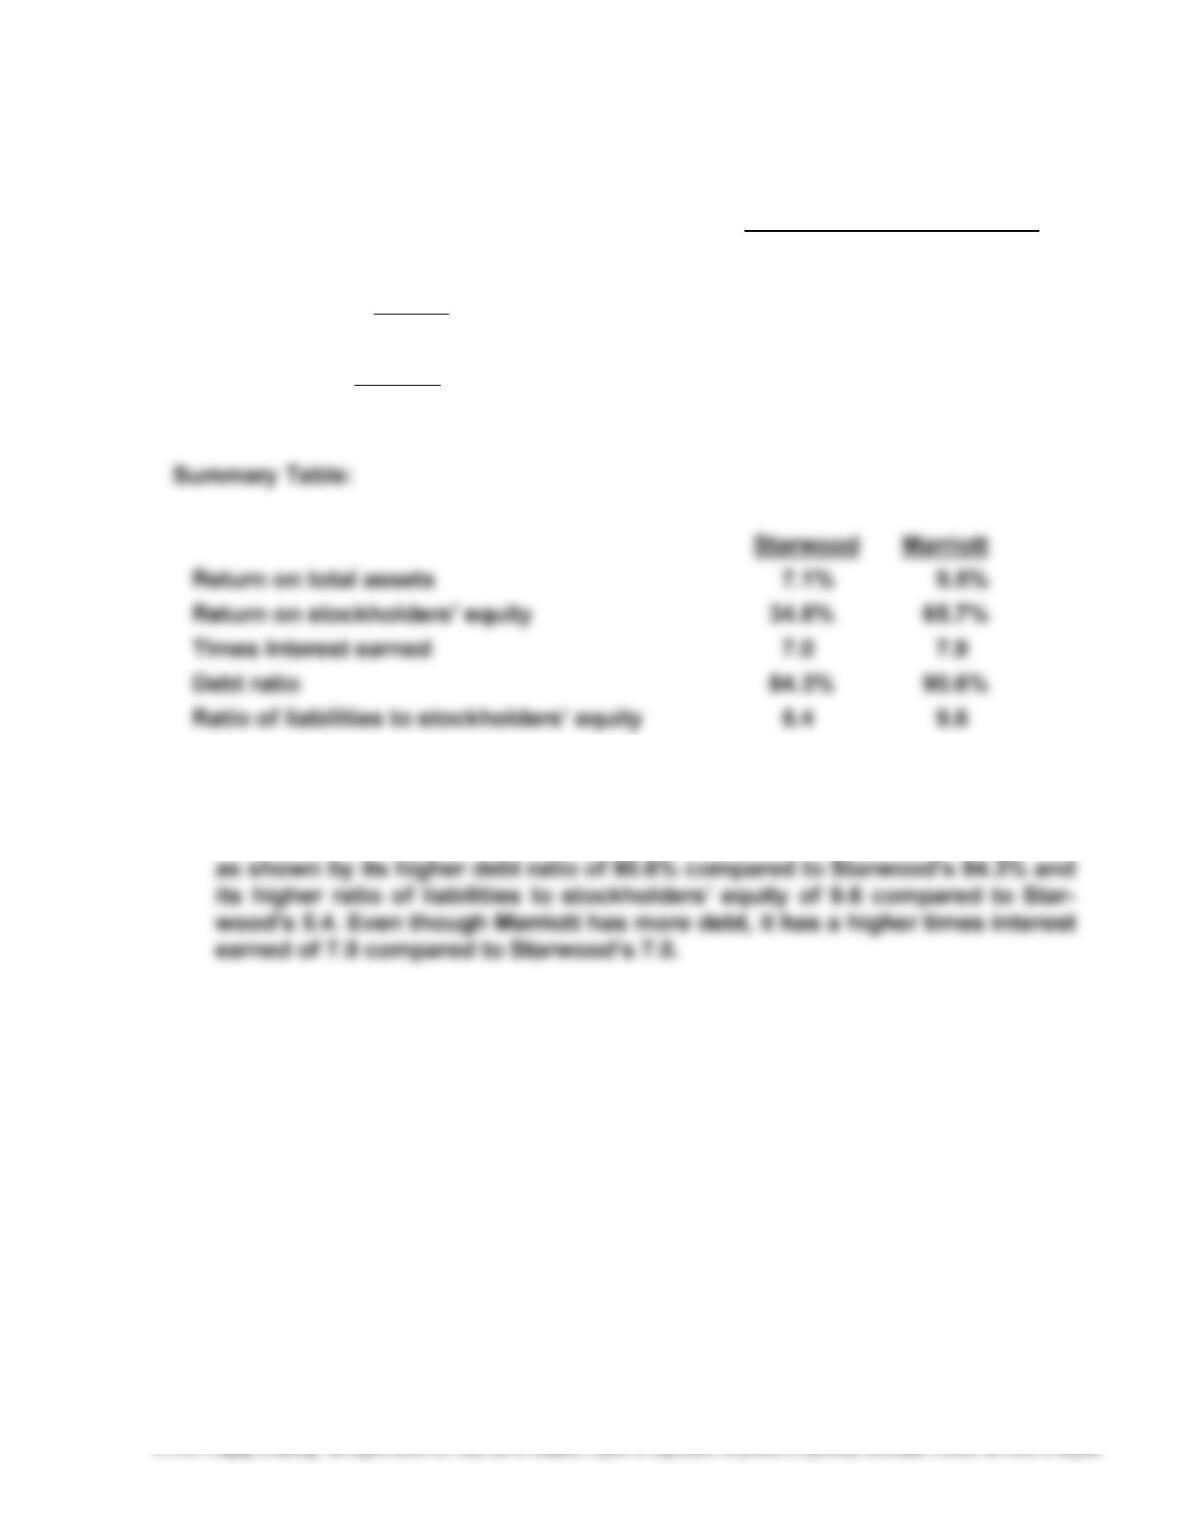
2. Marriott has a higher return on total assets (9.5% vs. 7.1%), and Marriott has
almost double the return on stockholders’ equity than Starwood (65.7% vs.
34.6%). This is because Marriott finances more of its operations using debt,