Problem 9-19 (30 minutes)
1.
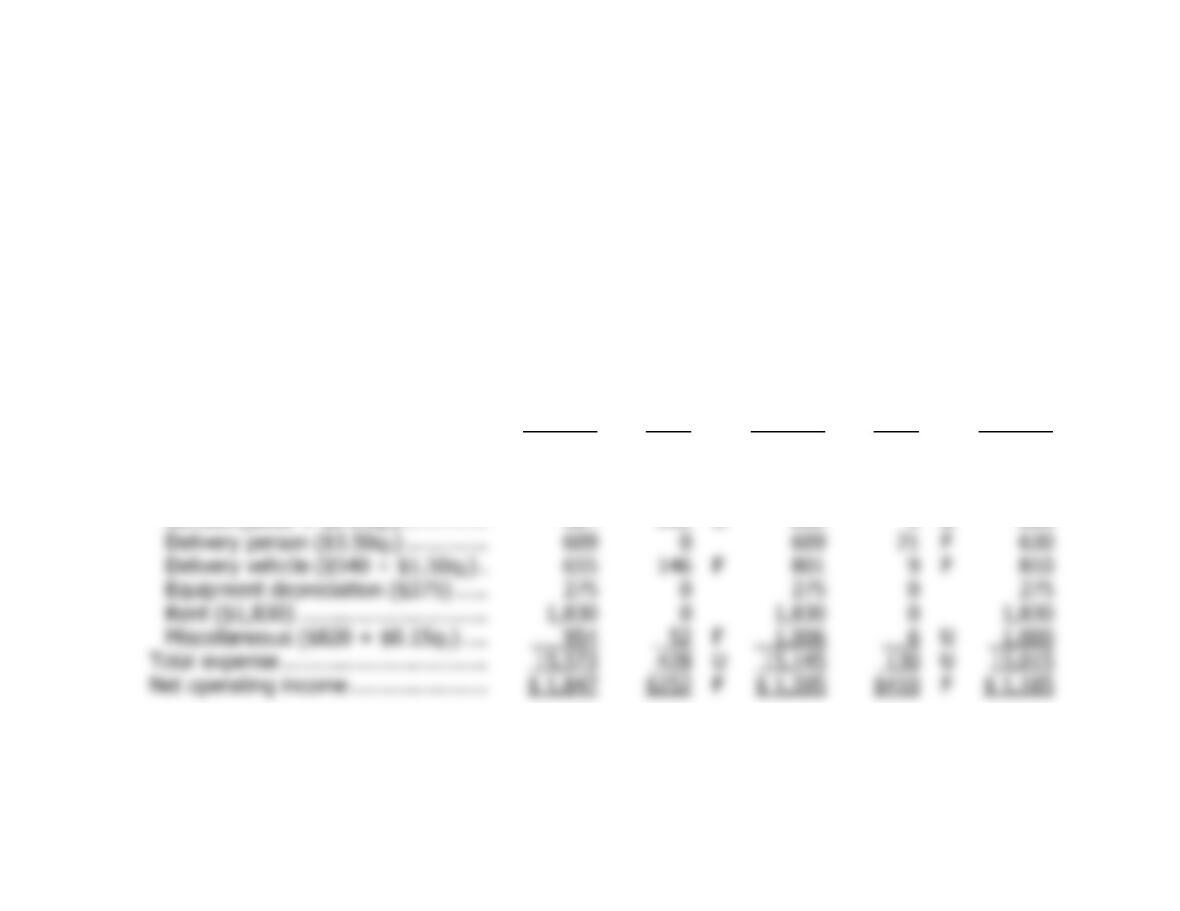
Milano Pizza
Flexible Budget Performance Report
For the Month Ended November 30
Actual
Results
Revenue
and
Spending
Variances
Flexible
Budget
Activity
Variances
Planning
Budget
Pizzas (q1) ………………………………..
1,240
1,240
1,200
Deliveries (q2) …………………………...
174
174
180
Revenue ($13.50q1) ……………………
$17,420
$680
F
$16,740
$540
F
$16,200
Expenses:
Pizza ingredients ($3.80q1) ………..
4,985
273
U
4,712
152
U
4,560
Kitchen staff ($5,220) ……………….
5,281
61
U
5,220
0
5,220
U
U
Delivery person ($3.50q2) ………….
609
0
609
21
F
630
Delivery vehicle ($540 + $1.50q2) .
655
F
801
9
F
810
Rent ($1,830) …………………………
1,830
0
1,830
0
1,830
Miscellaneous ($820 + $0.15q1) ….
F
6
U
Total expense …………………………...
U
U
Net operating income ………………….
$ 1,847
$252
F
$ 1,595
$410
F
$ 1,185
Problem 9-19 (continued)
2. Some of the activity variances are favorable and some are unfavorable.
This occurs because there are two cost drivers (i.e., measures of
activity) and one is up while the other is down. The actual number of
Problem 9-20 (45 minutes)
1. The variance report should
not
be used to evaluate how well costs were
controlled. In July, the planning budget was based on 150 lessons, but
2. See the following page.
3. The overall activity variance for net operating income was $435 F
(favorable). That means that as a consequence of the increase in
activity from 150 lessons to 155 lessons, the net operating income
should have been up $435 over budget. However, it wasn’t. The
budgeted net operating income was $8,030 and the actual net operating
Problem 9-20 (continued)
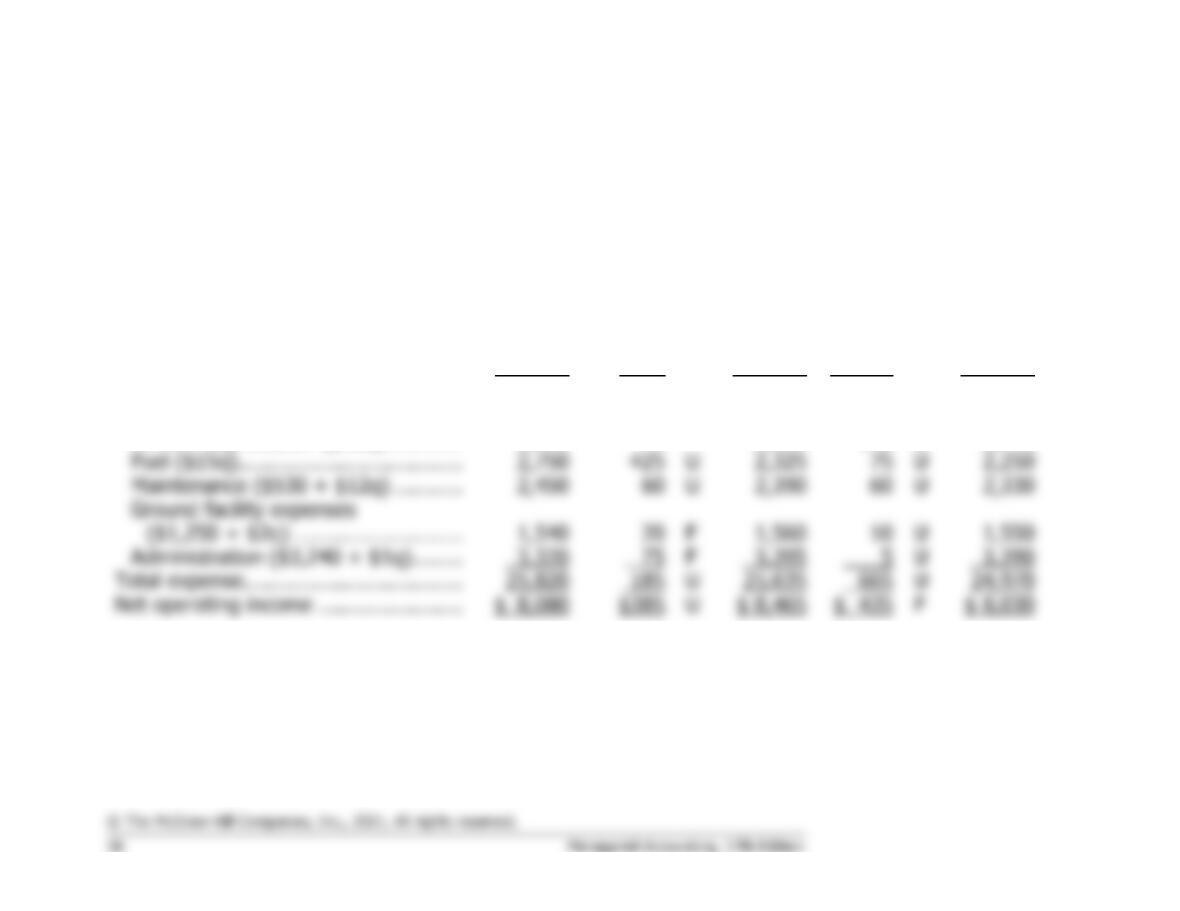
TipTop Flight School
Flexible Budget Performance Report
For the Month Ended July 31
Actual
Results
Revenue
and
Spending
Variances
Flexible
Budget
Activity
Variances
Planning
Budget
Lessons (q) ………………………………..
155
155
150
Revenue ($220q) …………………………
$33,900
$200
U
$34,100
$1,100
F
$33,000
Expenses:
Instructor wages ($65q) ……………..
9,870
205
F
10,075
325
U
9,750
Aircraft depreciation ($38q) …………
5,890
0
5,890
190
U
5,700
Fuel ($15q)………………………………
2,750
U
2,325
U
Maintenance ($530 + $12q) ………..
2,450
60
U
2,390
U
F
1,560
U
1,550
Administration ($3,240 + $1q) ……..
F
U
Total expense ……………………………..
U
U
Net operating income …………………..
U
$ 8,465
F
$ 8,030
Problem 9-21 (30 minutes)
1. Performance should be evaluated using a flexible budget performance report. In this case, the report
will not include revenues.
St. Lucia Blood Bank
Flexible Budget Performance Report
For the Month Ended September 30
Actual
Results
Spending
Variances
Flexible
Budget
Activity
Variances
Planning
Budget
Liters of blood collected (q) …………….
620
620
500
Medical supplies ($15.00q) ……………..
$ 9,250
$ 50
F
$ 9,300
$1,800
U
$ 7,500
Lab tests ($12.00q) ……………………….
6,180
1,260
F
7,440
1,440
U
6,000
Equipment depreciation ($2,500) ……..
U
Rent ($1,000) ………………………………
1,000
Utilities ($500) ……………………………..
U
Administration ($10,000 + $2.50q) …..
U
U
Total expense ………………………………
$31,540
F
$3,540
U
2. The overall unfavorable activity variance of $3,540 was caused by the 24% increase [= (620 – 500)
÷ 500] in activity. There is no reason to investigate this particular variance. The overall spending
variance is $750 F, which would seem to indicate that costs were well-controlled. However, the
Problem 9-22 (45 minutes)
1. The cost reports are of little use for assessing how well costs were
controlled. The problem is that the company is comparing budgeted
costs at one level of activity to actual costs at another level of activity.
Costs that are variable will naturally be different at these two different
levels of activity. Although the cost reports do a good job of showing
whether fixed costs were controlled, they do not do a good job of
showing whether variable costs were controlled. Since sales have
chronically failed to meet budget, the level of activity in the factory is
also likely to have chronically been below budget. Consequently, the
variances for variable costs have likely been favorable simply because
activity has been less than budgeted in the production departments. No
wonder the production supervisors have been pleased with the reports.
3. See the following page.
4. The flexible budget performance report provides a much clearer picture
of the performance of the Assembly Department than the original cost
Problem 9-22 (continued)
3.
Westmont Corporation
Assembly Department
Flexible Budget Performance Report
For the Month Ended March 31
Actual
Results
Spending
Variances
Flexible
Budget
Activity
Variances
Planning
Budget
Machine-hours (q) ………………………
35,000
35,000
40,000
Supplies ($0.80q)* ……………………..
$ 29,700
$ 1,700
U
$ 28,000
$4,000
F
$ 32,000
Scrap ($0.50q)* …………………………
19,500
2,000
U
17,500
2,500
F
20,000
Indirect materials ($1.40q)* …………
U
49,000
F
Wages and salaries ($80,000) ……….
F
Equipment depreciation ($60,000) …
Total ……………………………………….
U
F
Problem 9-23 (45 minutes)
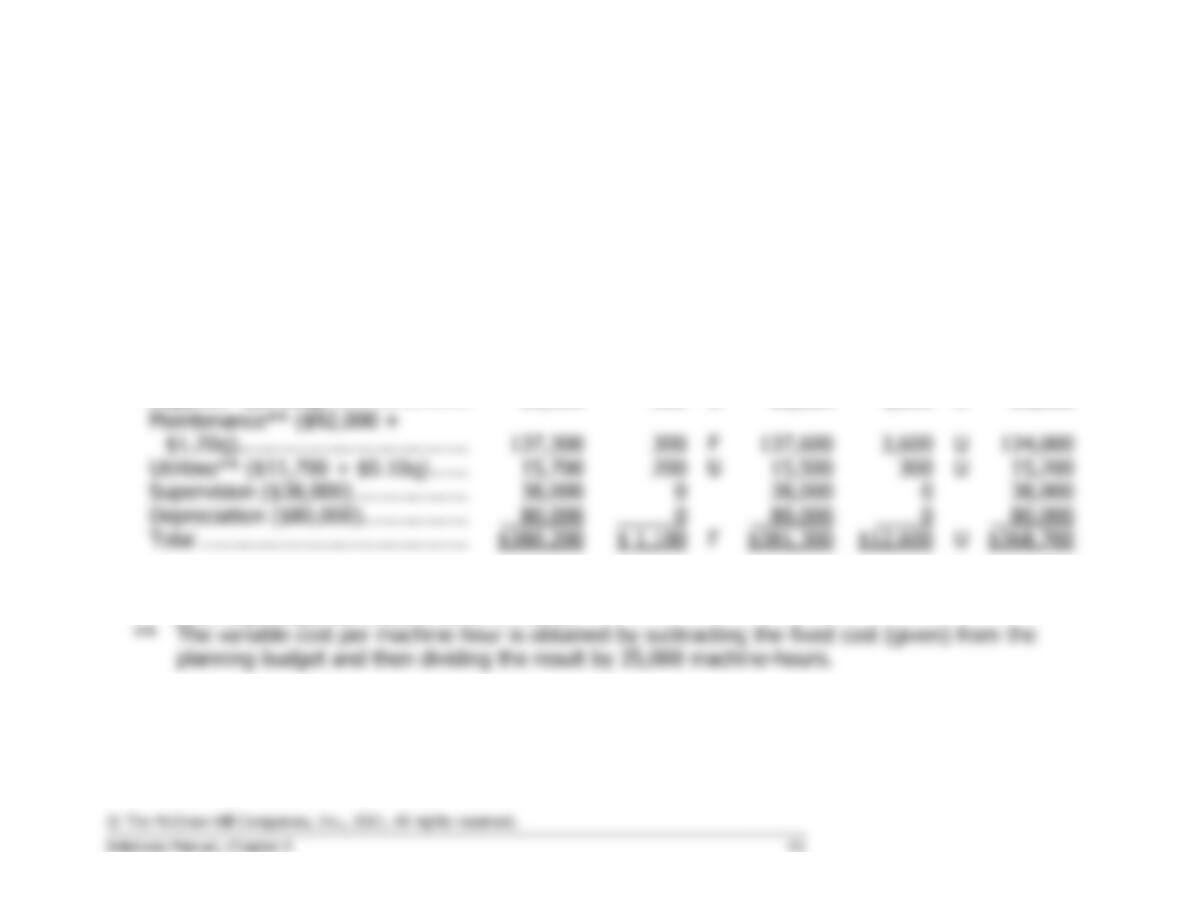
1. The cost control report compares the planning budget, which was
prepared for 35,000 machine-hours, to actual results for 38,000
Problem 9-23 (continued)
2. A report that would be helpful in assessing how well costs were controlled appears below:
Freemont Corporation—Machining Department
Flexible Budget Performance Report
For the Month Ended June 30
Actual
Results
Spending
Variances
Flexible
Budget
Activity
Variances
Planning
Budget
Machine-hours (q) ……………………
38,000
38,000
35,000
Direct labor wages* ($2.30q) ……..
$ 86,100
$ 1,300
F
$ 87,400
$6,900
U
$ 80,500
Supplies* ($0.60q) …………………..
23,100
300
U
22,800
1,800
U
21,000
F
U
200
U
15,500
U
Supervision ($38,000) ………………
38,000
38,000
38,000
Depreciation ($80,000) ……………..
80,000
0
80,000
Total …………………………………….
F
U
* The variable cost per machine-hour is obtained by dividing the total variable cost from the
planning budget by 35,000 machine-hours.
Note that in this new report the overall spending variance is favorable—indicating that costs were
most likely under control.
Case 9-24 (30 minutes)
It is difficult to imagine how Tom Kemper could ethically agree to go along
with reporting the favorable $21,000 variance for industrial engineering on
the final report, even if the bill were not actually received by the end of the
year. It would be misleading to exclude part of the final cost of the
Individuals will differ in how they think Kemper should handle this
situation. In our opinion, he should firmly state that he is willing to call
Laura, but even if the bill does not arrive, he is ethically bound to properly
accrue the expenses on the report—which will mean an unfavorable
variance for industrial engineering and an overall unfavorable variance. This
would require a great deal of personal courage. If the general manager
insists on keeping the misleading $21,000 favorable variance on the report,
Kemper would have little choice except to take the dispute to the next
Case 9-25 (45 minutes)
1. The flexible budget and spending variances would be computed as
follows:
Boyne University Motor Pool
Spending Variances
For the Month Ended March 31
Actual
Results
Flexible
Budget
Spending
Variances
Miles (q1) …………………………..……..
63,000
63,000
Autos (q2) …………………………………
21
21
Gasoline ($0.15q1) ………………………
$ 9,350
$ 9,450
$100
F
Oil, minor repairs, parts ($0.04q1) …..
2,360
2,520
160
F
Outside repairs ($75q2) ………………..
1,420
1,575
155
F
Insurance ($100q2) ……………………..
2,120
2,100
20
U
Salaries and benefits ($7,540) ……….
7,540
7,540
Vehicle depreciation ($250q2) ………..
Total ………………………………………..
$395
F
2. The original report is based on a static budget approach that does not
allow for variations in the number of miles driven from month to month,
or for variations in the number of automobiles used. As a result, the
“monthly budget” figures are unrealistic benchmarks. For example,
Case 9-26 (75 minutes)
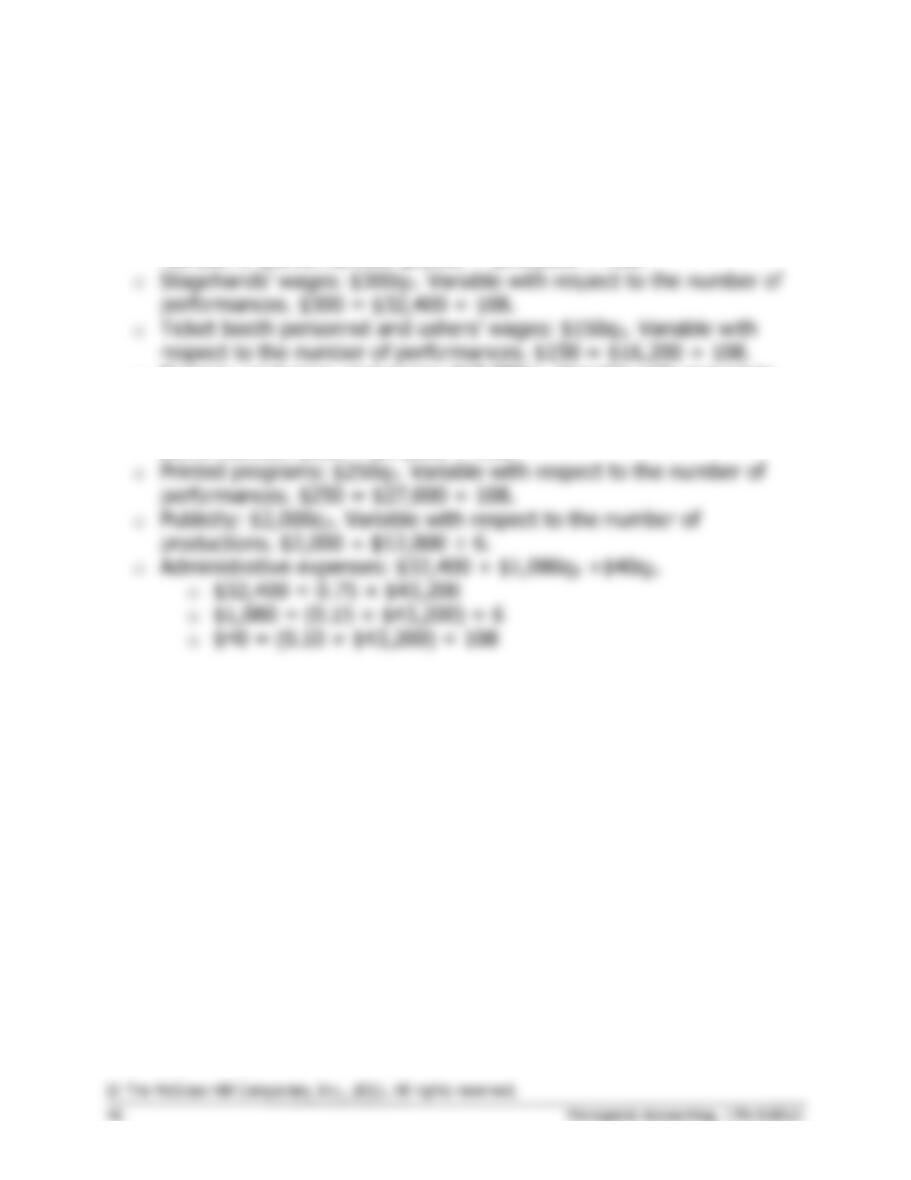
1. The cost formulas for The Little Theatre appear below, where q1 is the
number of productions and q2 is the number of performances:
o Actors’ and directors’ wages: $2,000q2. Variable with respect to the
o Scenery, costumes, and props: $18,000q1. Variable with respect to
the number of productions. $18,000 = $108,000 ÷ 6.
o Theater hall rent: $500q2. Variable with respect to the number of
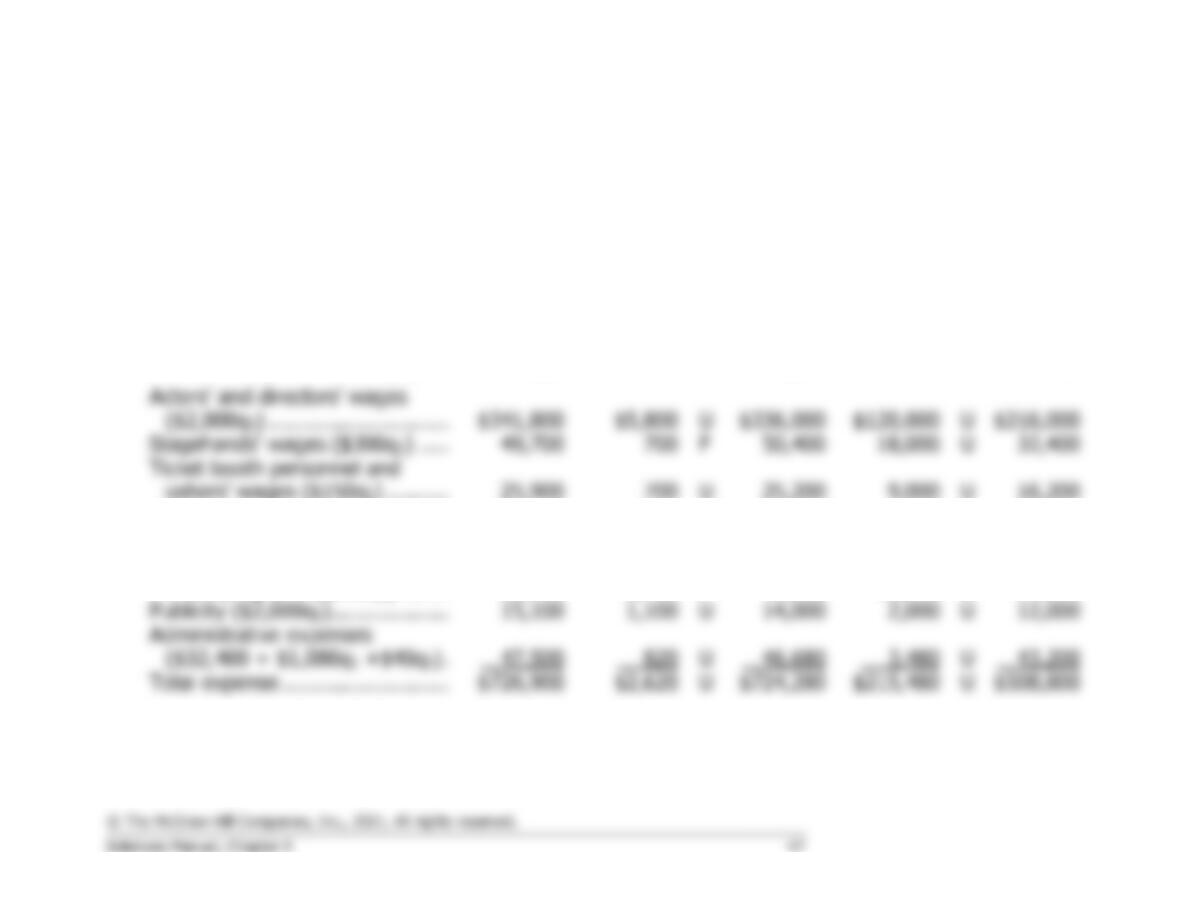
Case 9-26 (continued)
The flexible budget performance report follows:
The Little Theatre
Flexible Budget Performance Report
For the Year Ended December 31
Actual
Results
Spending
Variances
Flexible
Budget
Activity
Variances
Planning
Budget
Number of productions (q1) …….
7
7
6
Number of performances (q2) ….
168
168
108
U
U
Stagehands’ wages ($300q2) …..
49,700
F
50,400
U
32,400
ushers’ wages ($150q2) ……….
25,900
700
U
25,200
9,000
U
16,200
Scenery, costumes, and props
($18,000q1) ………………………
130,600
4,600
U
126,000
18,000
U
108,000
Theater hall rent ($500q2) ………
78,000
6,000
F
84,000
30,000
U
54,000
Printed programs ($250q2) ……..
38,300
3,700
F
42,000
15,000
U
27,000
Publicity ($2,000q1) ……………….
1,100
U
14,000
2,000
U
Administrative expenses
U
U
Total expense ………………………
$2,620
U
U
Case 9-26 (continued)
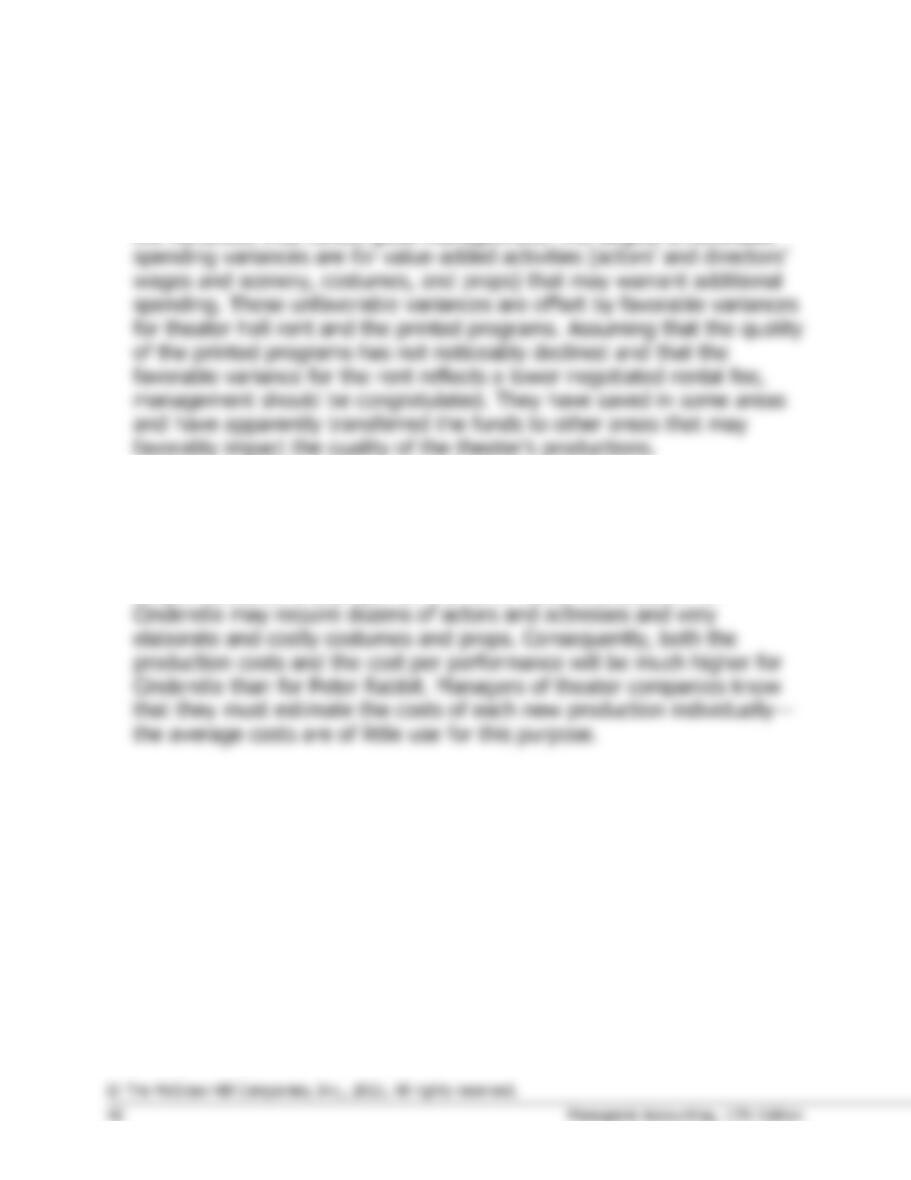
2. The overall unfavorable spending variance of $2,620 is a very small
percentage of the total cost, less than 0.4% (= $2,620 ÷ $724,280).
This suggests that costs are under control. In addition, the pattern of
favorably impact the quality of the theater’s productions.
3. Average costs may not be very good indicators of the additional costs of
any particular production or performance. The averages gloss over
considerable variations in costs. For example, a production of Peter
Rabbit may require only half a dozen actors and actresses and fairly
simple costumes and props. On the other hand, a production of