CHAPTER 9 Receivables
Prob. 9-2B (Concluded)
4. Bad Debt Expense 115,860
Allowance for Doubtful Accounts 115,860
Uncollectible accounts estimate
($123,235 – $7,375).
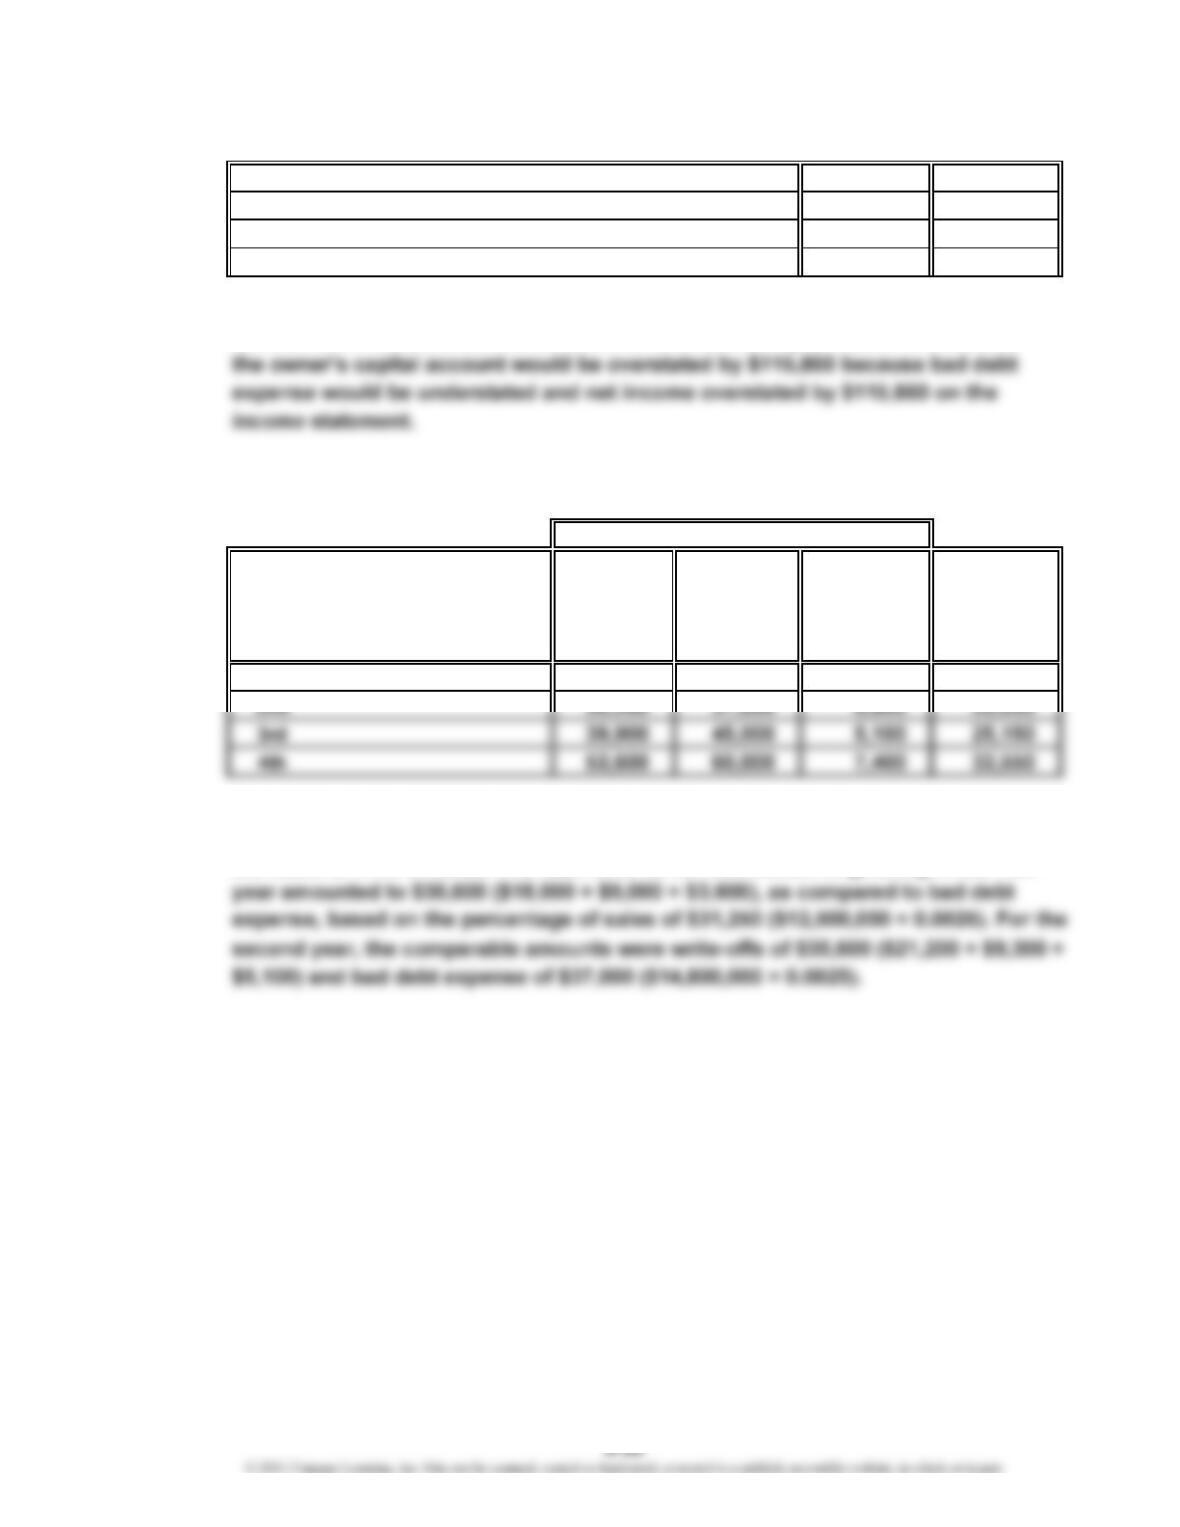
5. On the balance sheet, assets would be overstated by $115,860 because the
allowance for doubtful accounts would be understated by $115,860. In addition,
Prob. 9-3B
1.
Increase Balance of
Expense Expense (Decrease) Allowance
Actually Based on in Amount Account,
Reported Estimate of Expense End of Year
$18,000 $31,250 $13,250 $13,250
2. Yes. The actual write-offs of accounts originating in the first two years are
reasonably close to the expense that would have been charged to those years on
the basis of 1/4% of sales. The total write-off of receivables originating in the first
Bad Debt Expense
Year
1st
CHAPTER 9 Receivables
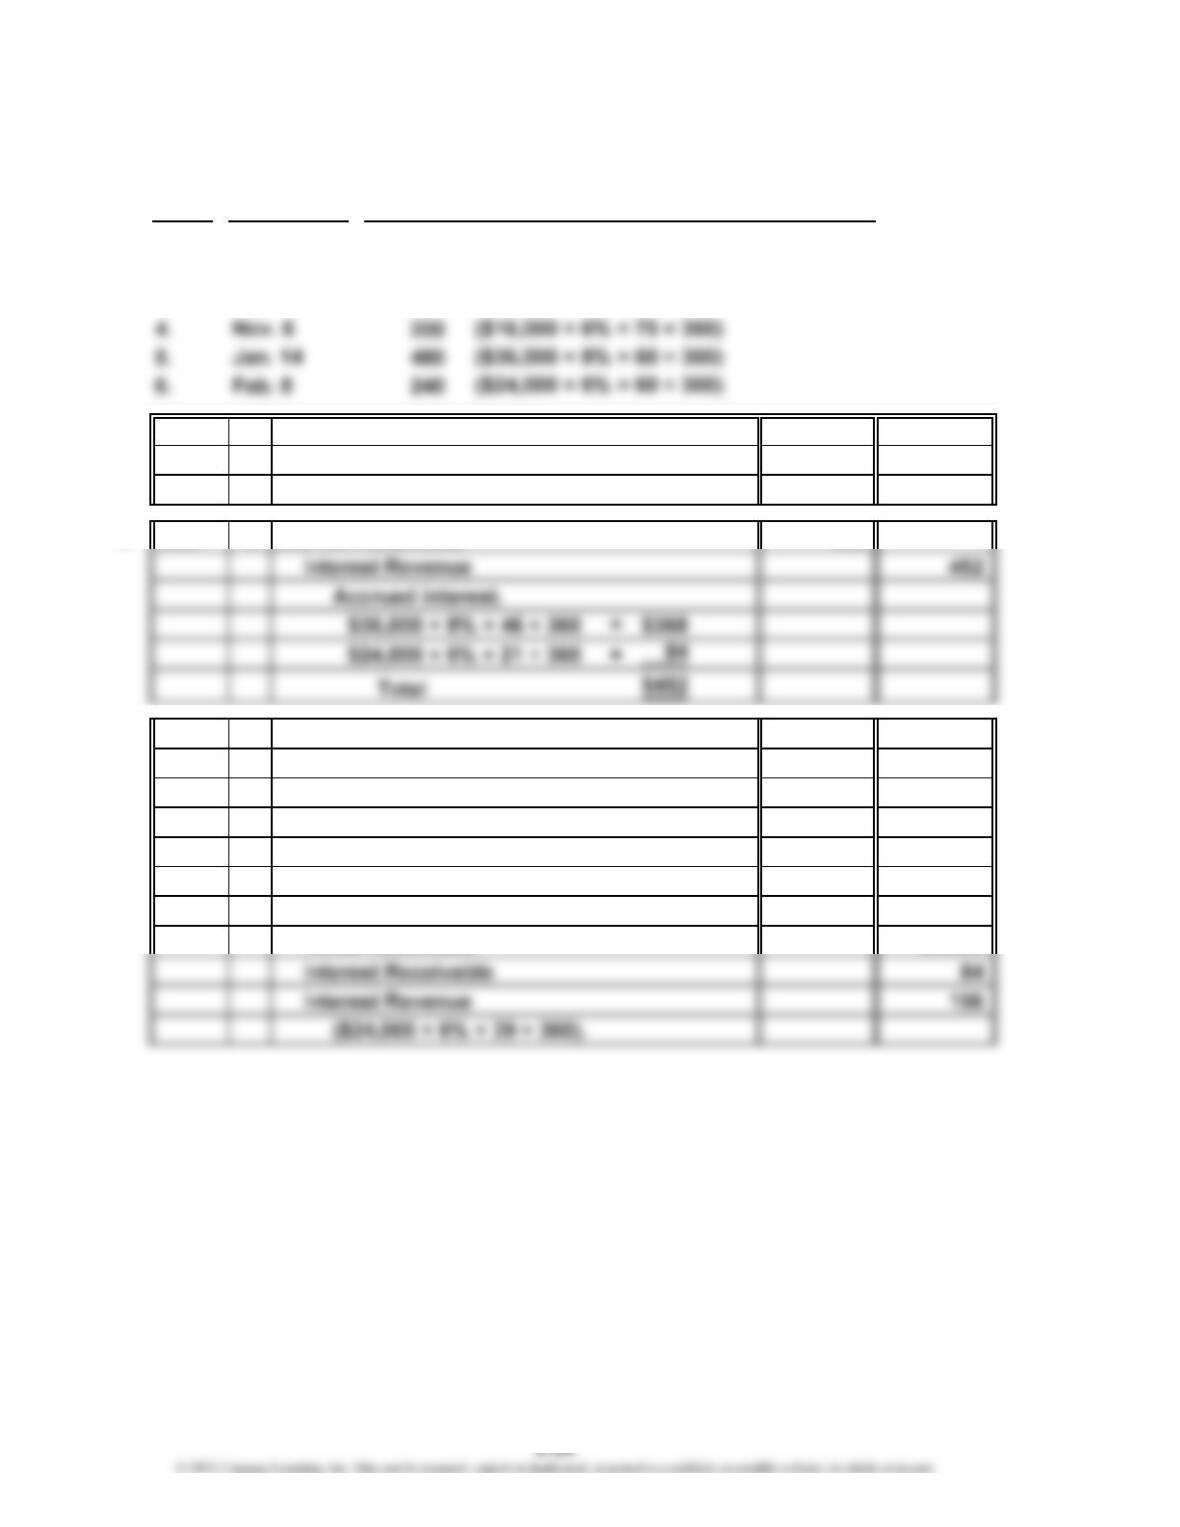
Prob. 9-4B
1.
Note
1. $110
2. 525
3. 600
2. Oct. 10 Accounts Receivable 48,600
Notes Receivable 48,000
Interest Revenue 600
3. Dec. 31 Interest Receivable 452
4. Jan. 14 Cash 36,480
Notes Receivable 36,000
Interest Receivable 368
Interest Revenue 112
($36,000 × 8% × 14 ÷ 360).
Feb. 8 Cash 24,240
Notes Receivable 24,000
Feb. 13
Due Date
(a)
Apr. 23
Oct. 10
Interest Due at Maturity
(b)
($33,000 × 4% × 30 ÷ 360)
($60,000 × 7% × 45 ÷ 360)
($48,000 × 5% × 90 ÷ 360)
CHAPTER 9 Receivables
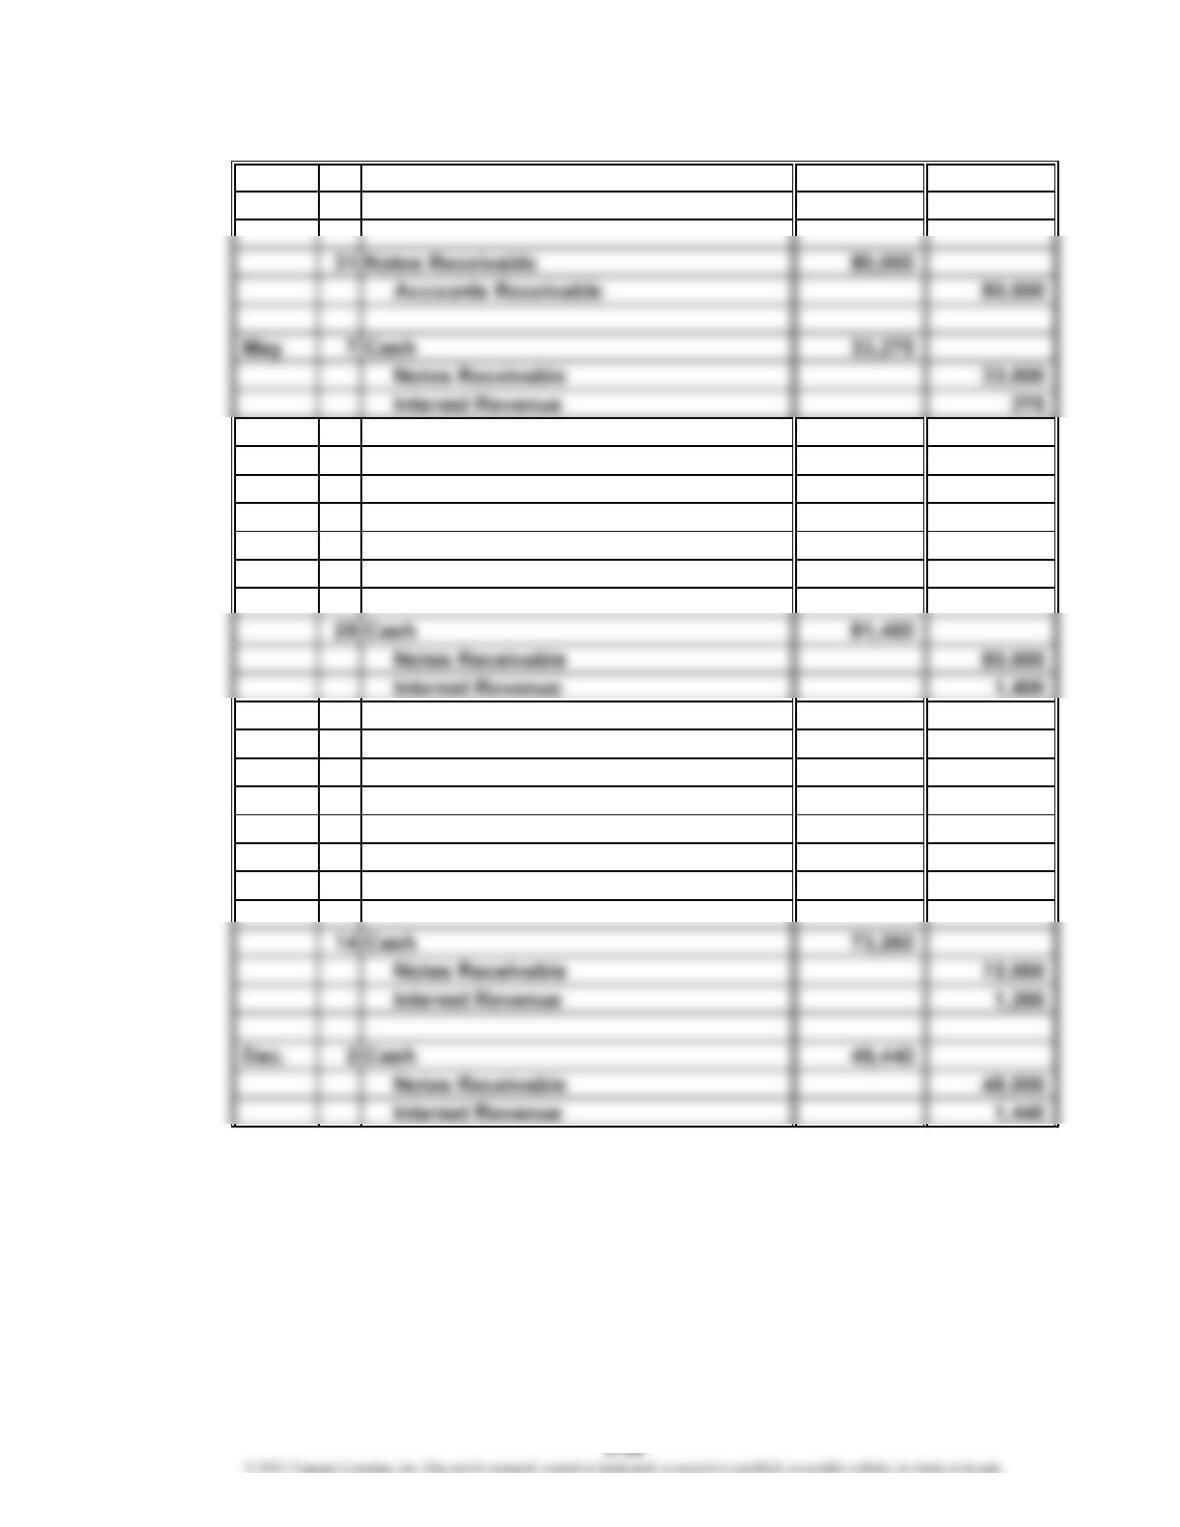
Prob. 9-5B
Mar. 8 Notes Receivable 33,000
Accounts Receivable 33,000
16 Notes Receivable 72,000
Accounts Receivable 72,000
June 11 Notes Receivable 36,000
Accounts Receivable 36,000
July 26 Cash 36,270
Notes Receivable 36,000
Interest Revenue 270
Aug. 4 Notes Receivable 48,000
Accounts Receivable 48,000
CHAPTER 9 Receivables
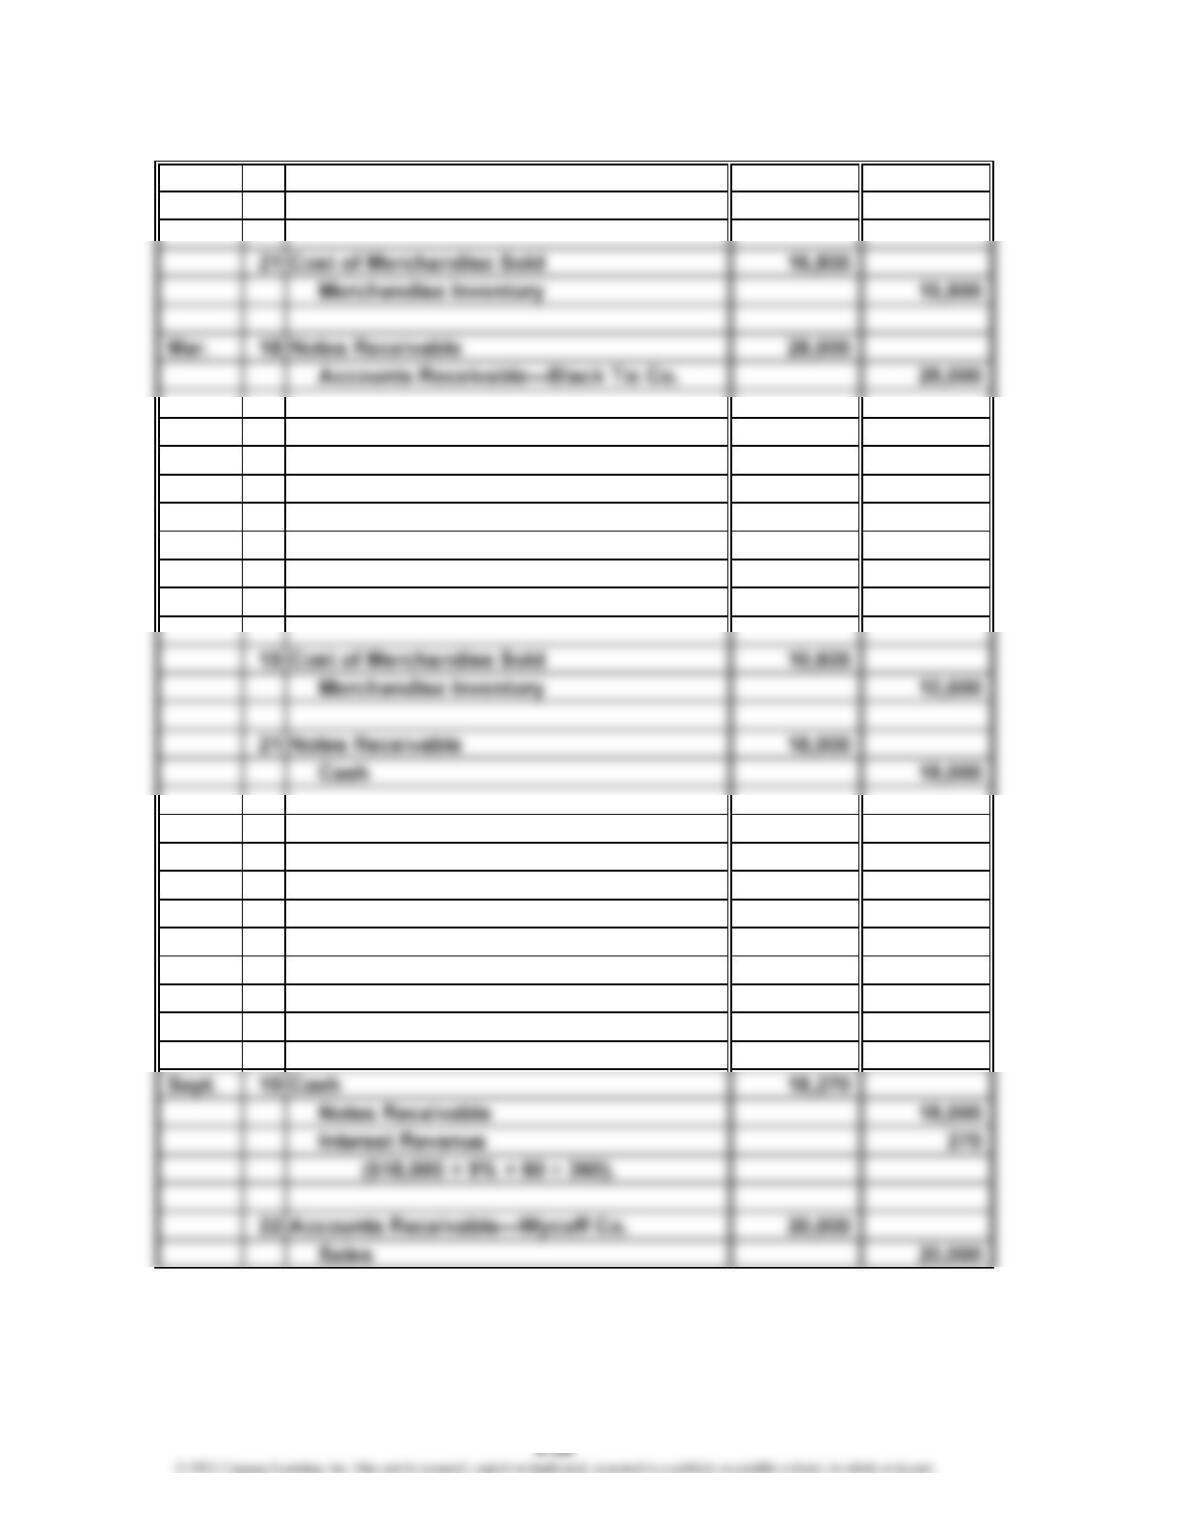
Prob. 9-6B
Jan. 21 Accounts Receivable—Black Tie Co. 28,000
Sales 28,000
May 17 Cash 28,280
Notes Receivable 28,000
Interest Revenue 280
($28,000 × 6% × 60 ÷ 360).
June 15 Accounts Receivable—Pioneer Co. 17,700
Sales 17,700
25 Cash 17,700
Accounts Receivable—Pioneer Co. 17,700
July 21 Notes Receivable 18,000
Cash 120
Notes Receivable 18,000
Interest Revenue 120
($18,000 × 8% × 30 ÷ 360).
CHAPTER 9 Receivables
Prob. 9-6B (Concluded)
Sept. 22 Cost of Merchandise Sold 12,000
Merchandise Inventory 12,000
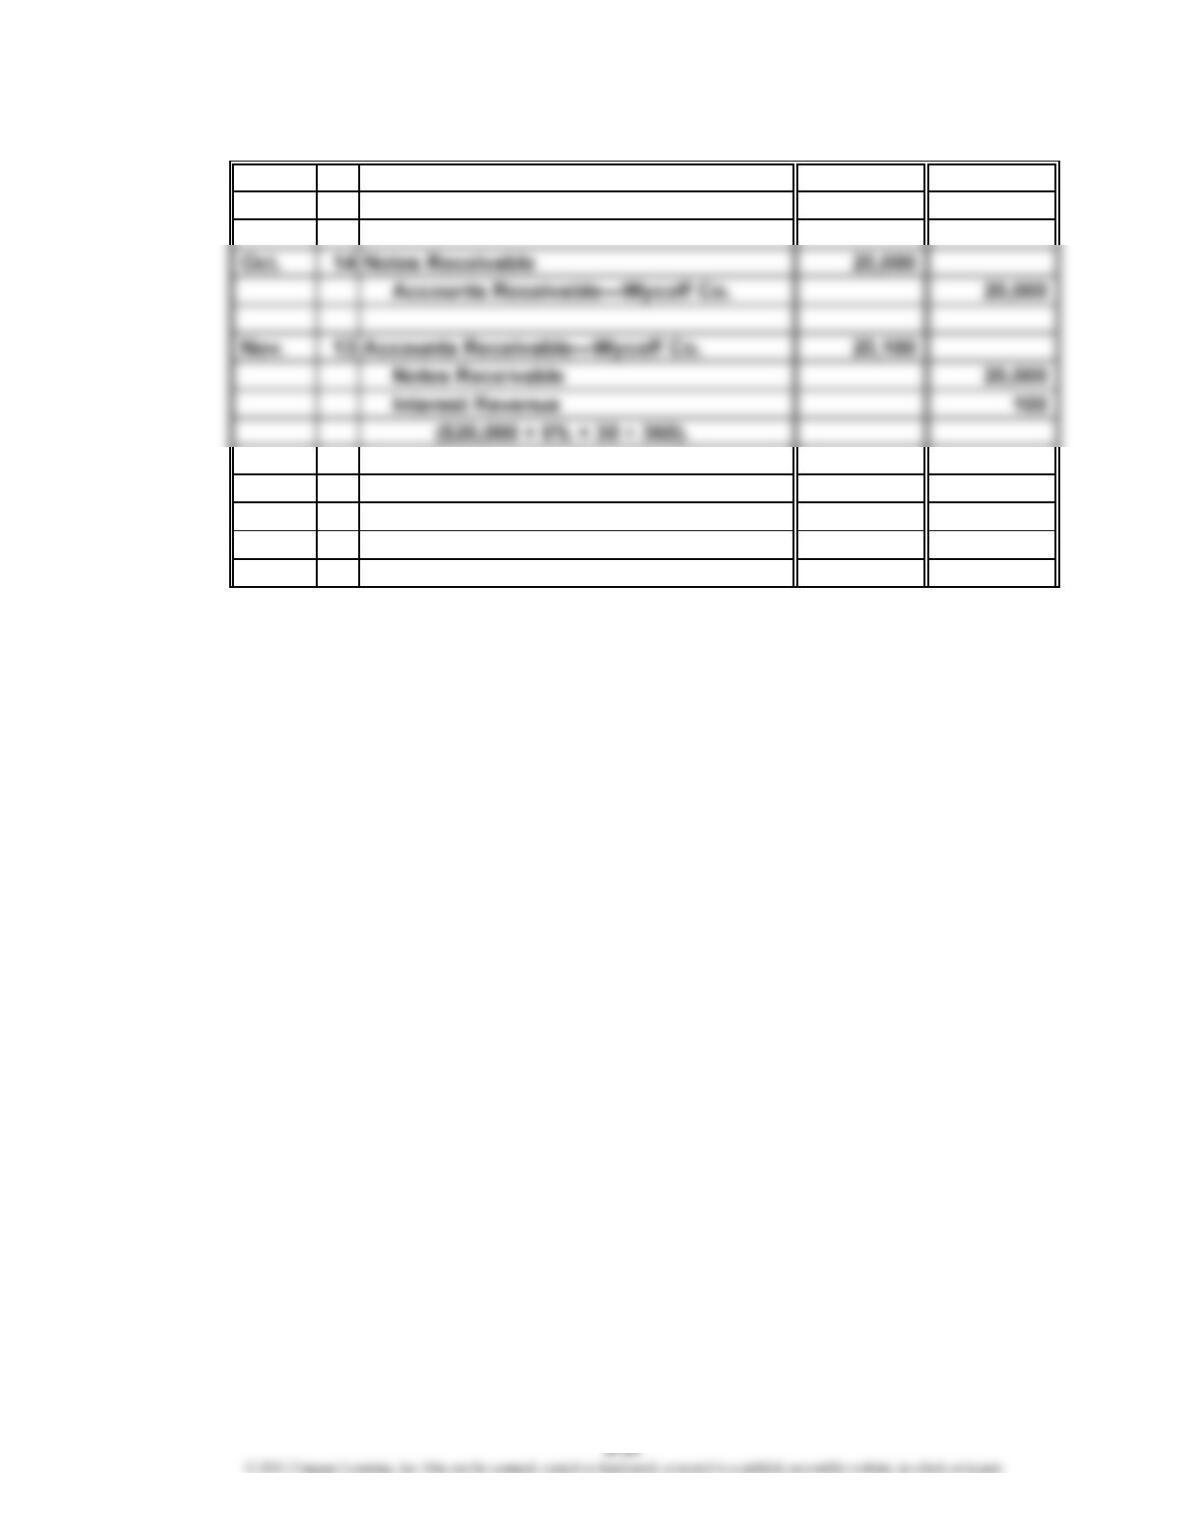
Dec. 28 Cash 20,301
Accounts Receivable—Wycoff Co. 20,100
Interest Revenue 201
($20,100 × 8% × 45 ÷ 360).
CHAPTER 9 Receivables
CP 9-1
Estimates of uncollectible accounts receivable create a unique financial reporting
challenge. Because the company does not know with certainty the amount of accounts
receivable that will be uncollectible, there is no “correct” estimate. The company must
use its judgment along with historical data to develop an estimate that fairly presents the
portion of credit sales that will become uncollectible. These estimates are required
under GAAP and should be representationally faithful and accurately match bad debt
expense to revenues generated from credit sales.
CP 9-2
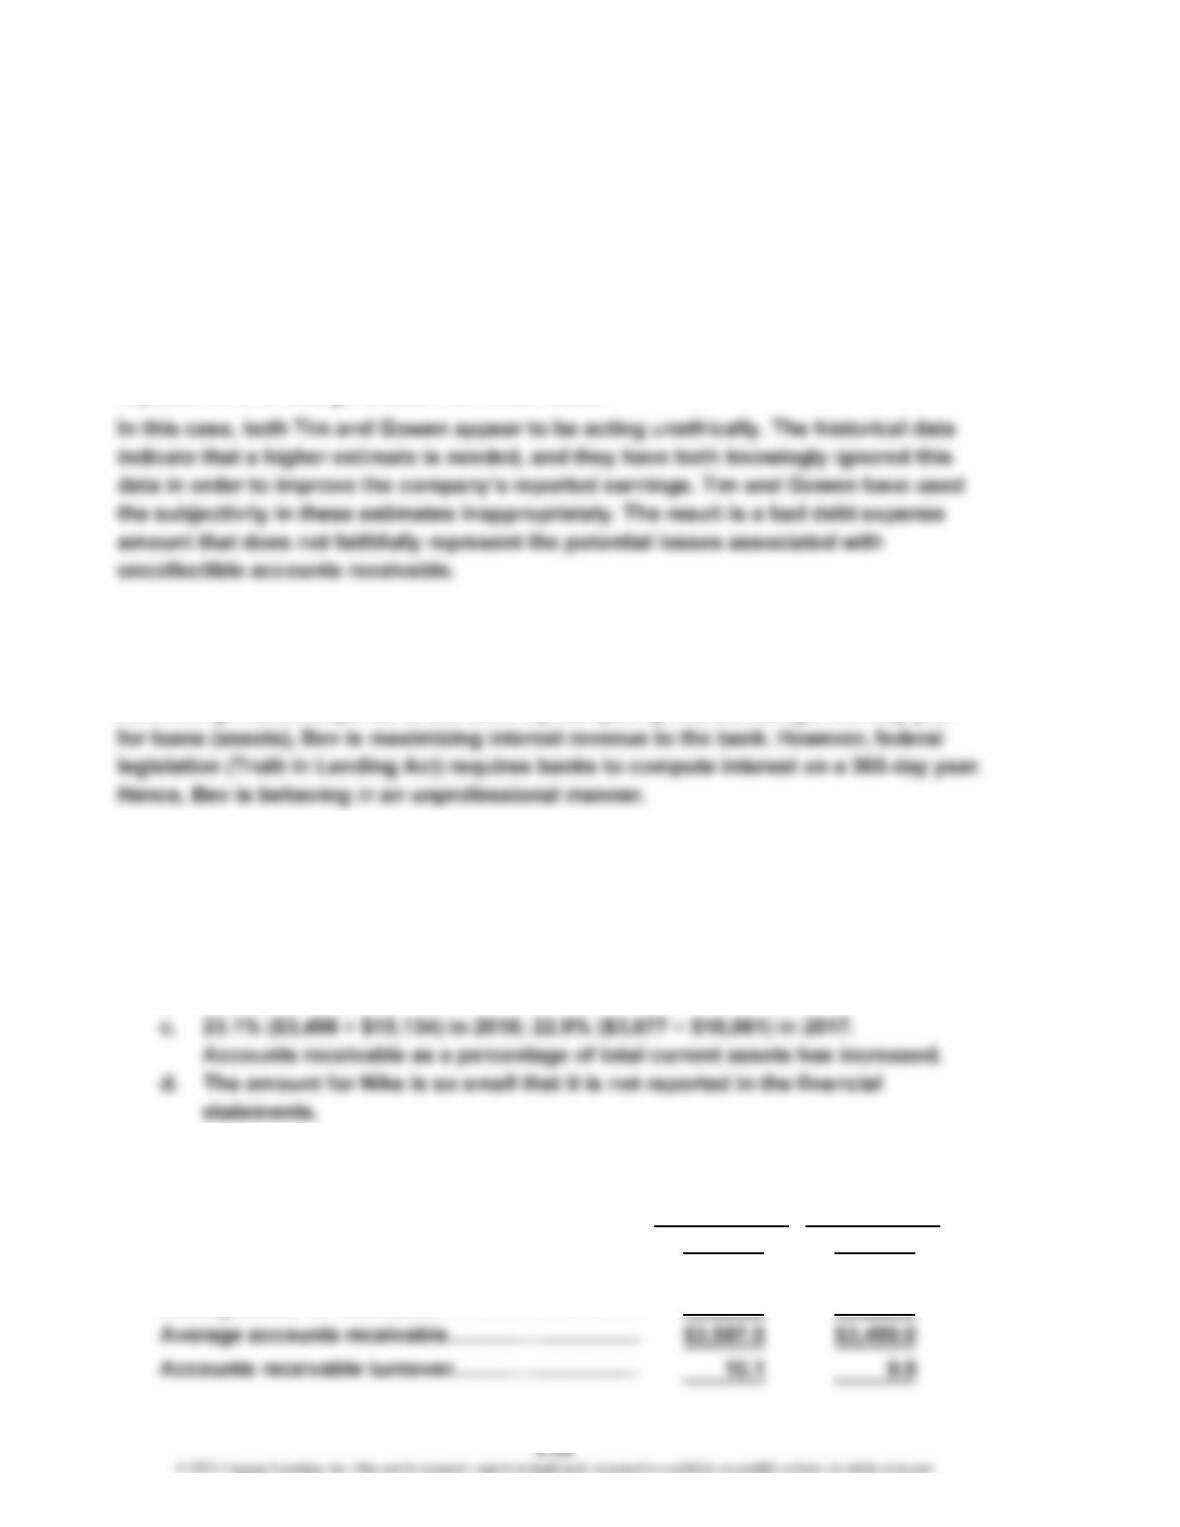
By computing interest using a 365-day year for depository accounts (liabilities), Bev is
minimizing interest expense to the bank. By computing interest using a 360-day year
CP 9-3
A sample solution based on Nike Inc.’s Form 10-K for the fiscal year ended May 31, 2018,
follows:
1. a. $3,498 million (from balance sheet)
b. $30 million (Note 1)
2. The company’s receivables turnover has improved from 9.9 in 2017 to 10.1 in 2018,
as shown below.
2018 2017
Sales……………………………………………………
…
$ 36,397 $ 34,350
Beginning accounts receivable……………………
…
$ 3,677 $ 3,241
Ending accounts receivable………………………
…
3,498 3,677
CASES & PROJECTS
CHAPTER 9 Receivables
CP 9-4
To: Todd Hurley, CEO
From: A+ Student
Re: Allowance Method for Uncollectible Accounts
Accounts receivable result from the sale of goods to customers on account. Because
payment is received from customers after goods are delivered, there is a risk that
customers will default on their accounts. While the company does not know which
customers will default, it does have historical information on the portion of accounts
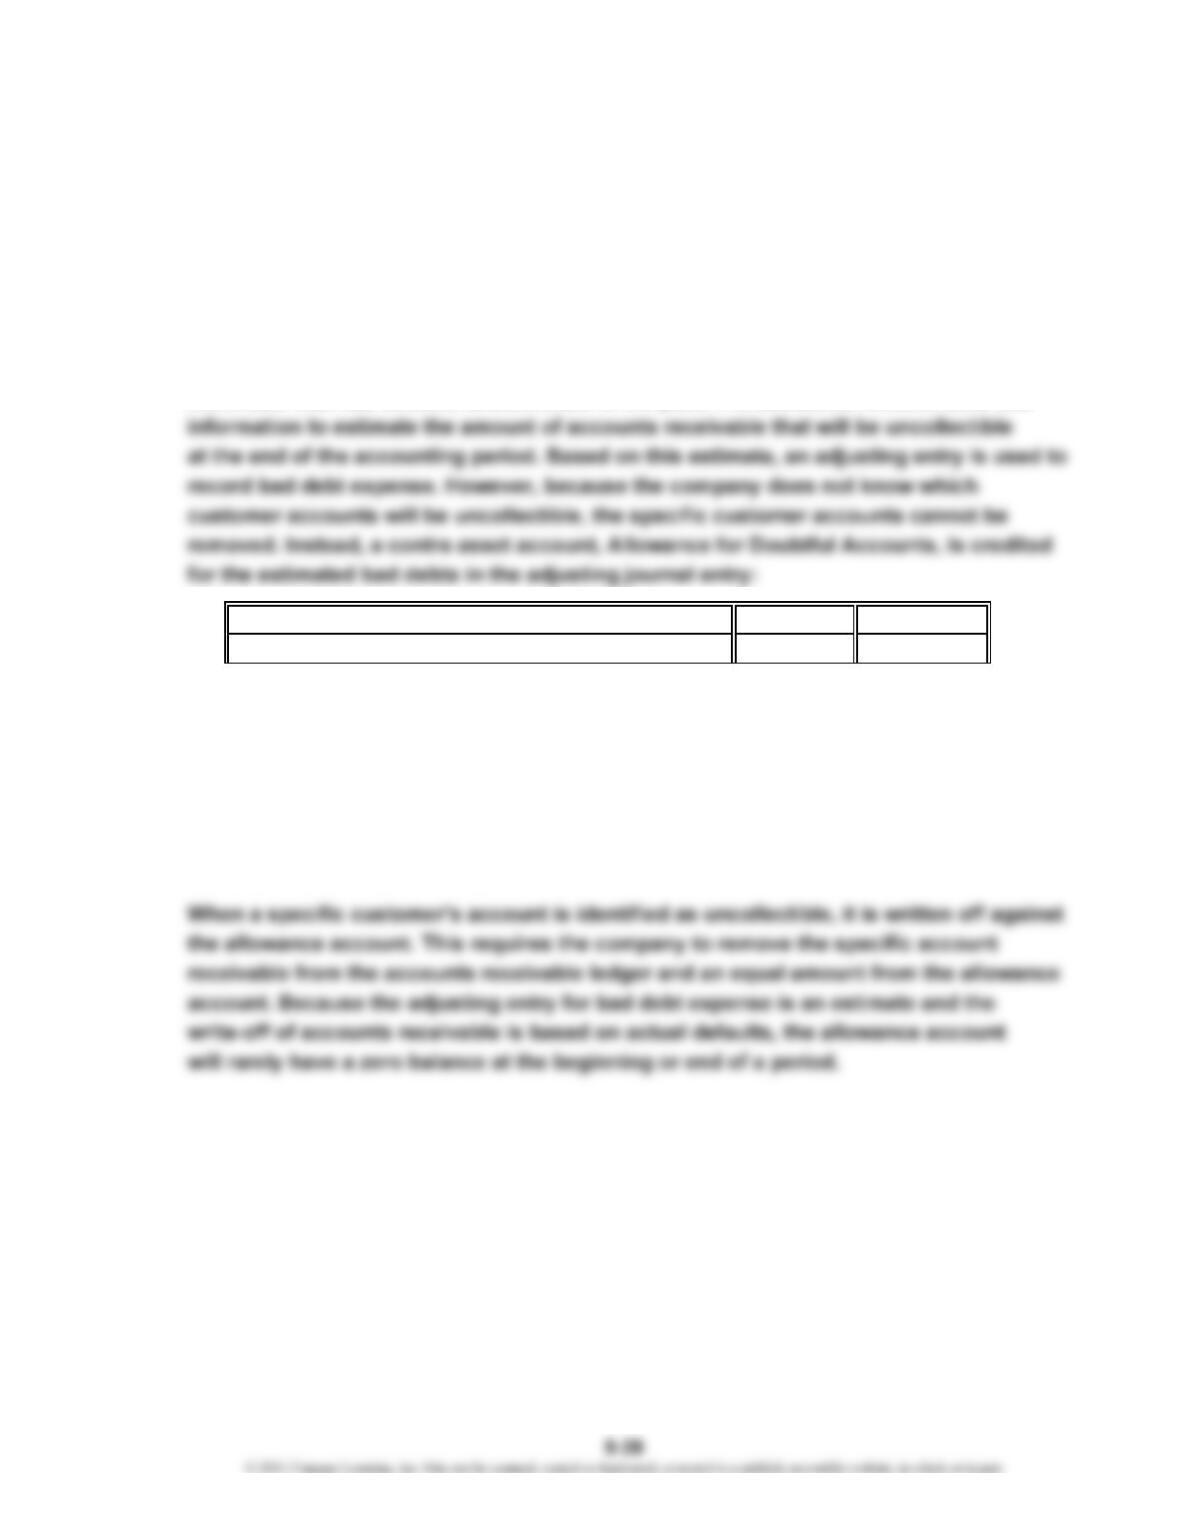
receivable that has become uncollectible in the past. The allowance method uses this
Bad Debt Expense XXX
Allowance for Doubtful Accounts XXX
This adjusting entry affects both the income statement and balance sheet. On the
income statement, bad debt expense is matched against the revenues generated
by the accounts receivable. On the balance sheet, the accounts receivable balance is
reduced by the allowance for doubtful accounts, which is the portion of the accounts
receivable that the company does not expect to collect. This resulting number is the
amount of accounts receivable that the company expects to collect, called the net
realizable value of the receivables.
CHAPTER 9 Receivables
CP 9-5
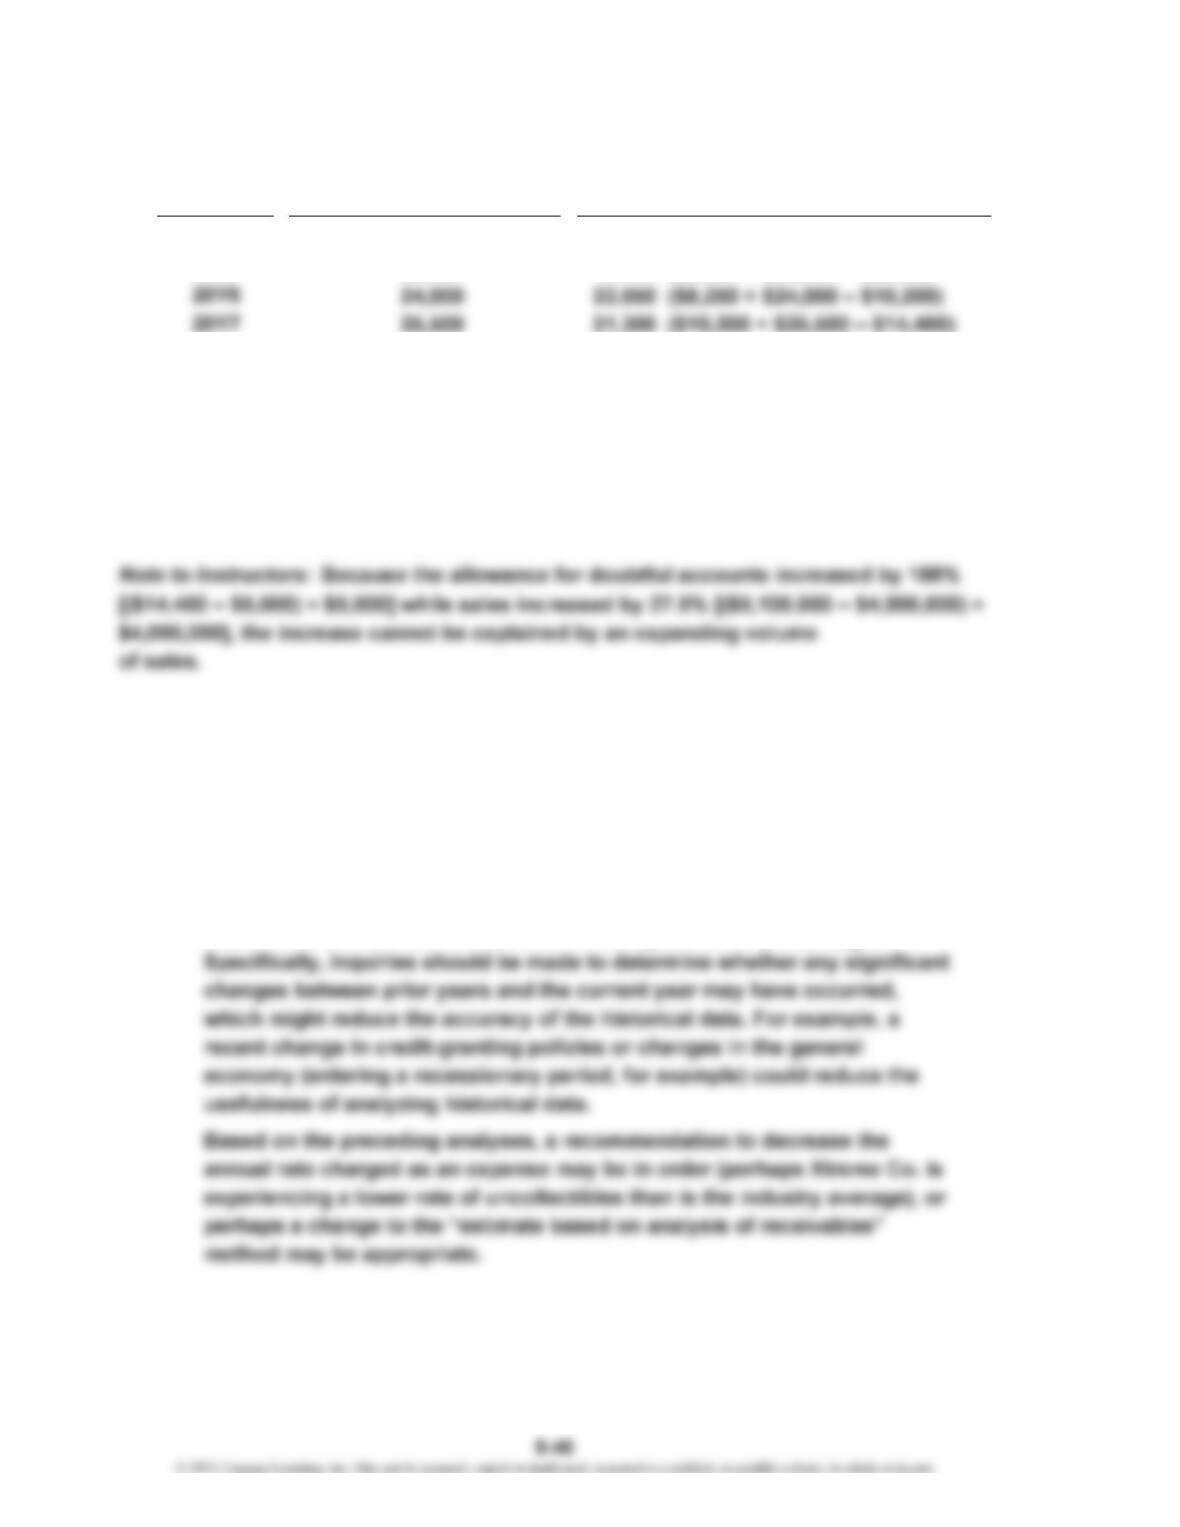
1. a.
Addition to Allowance
for Doubtful Accounts
$20,000 $15,000 ($20,000 – $5,000)
22,000 18,750 ($5,000 + $22,000 – $8,250)
2. a. The estimate of 1/2 of 1% of credit sales may be too large because the allowance
for doubtful accounts has steadily increased each year. The increasing balance
of the allowance for doubtful accounts may also be due to the failure to write
off a large number of uncollectible accounts. These possibilities could be
evaluated by examining the accounts in the accounts receivable subsidiary
ledger for collectibility and comparing the result with the balance in the
allowance for doubtful accounts.
b. The balance of Allowance for Doubtful Accounts that should exist at
December 31, 20Y7, can only be determined after all attempts have been
made to collect the receivables on hand at December 31, 20Y7. However,
the account balances at December 31, 20Y7, could be analyzed, perhaps
using an aging schedule, to determine a reasonable amount of allowance
and to determine accounts that should be written off. Also, past write-offs
of uncollectible accounts could be analyzed in depth in order to develop a
reasonable percentage for future adjusting entries, based on past history.
Caution, however, must be exercised in using historical percentages.
20Y5
b.
Accounts Written
Year Off During Year
20Y4
CHAPTER 9 Receivables
CP 9-6
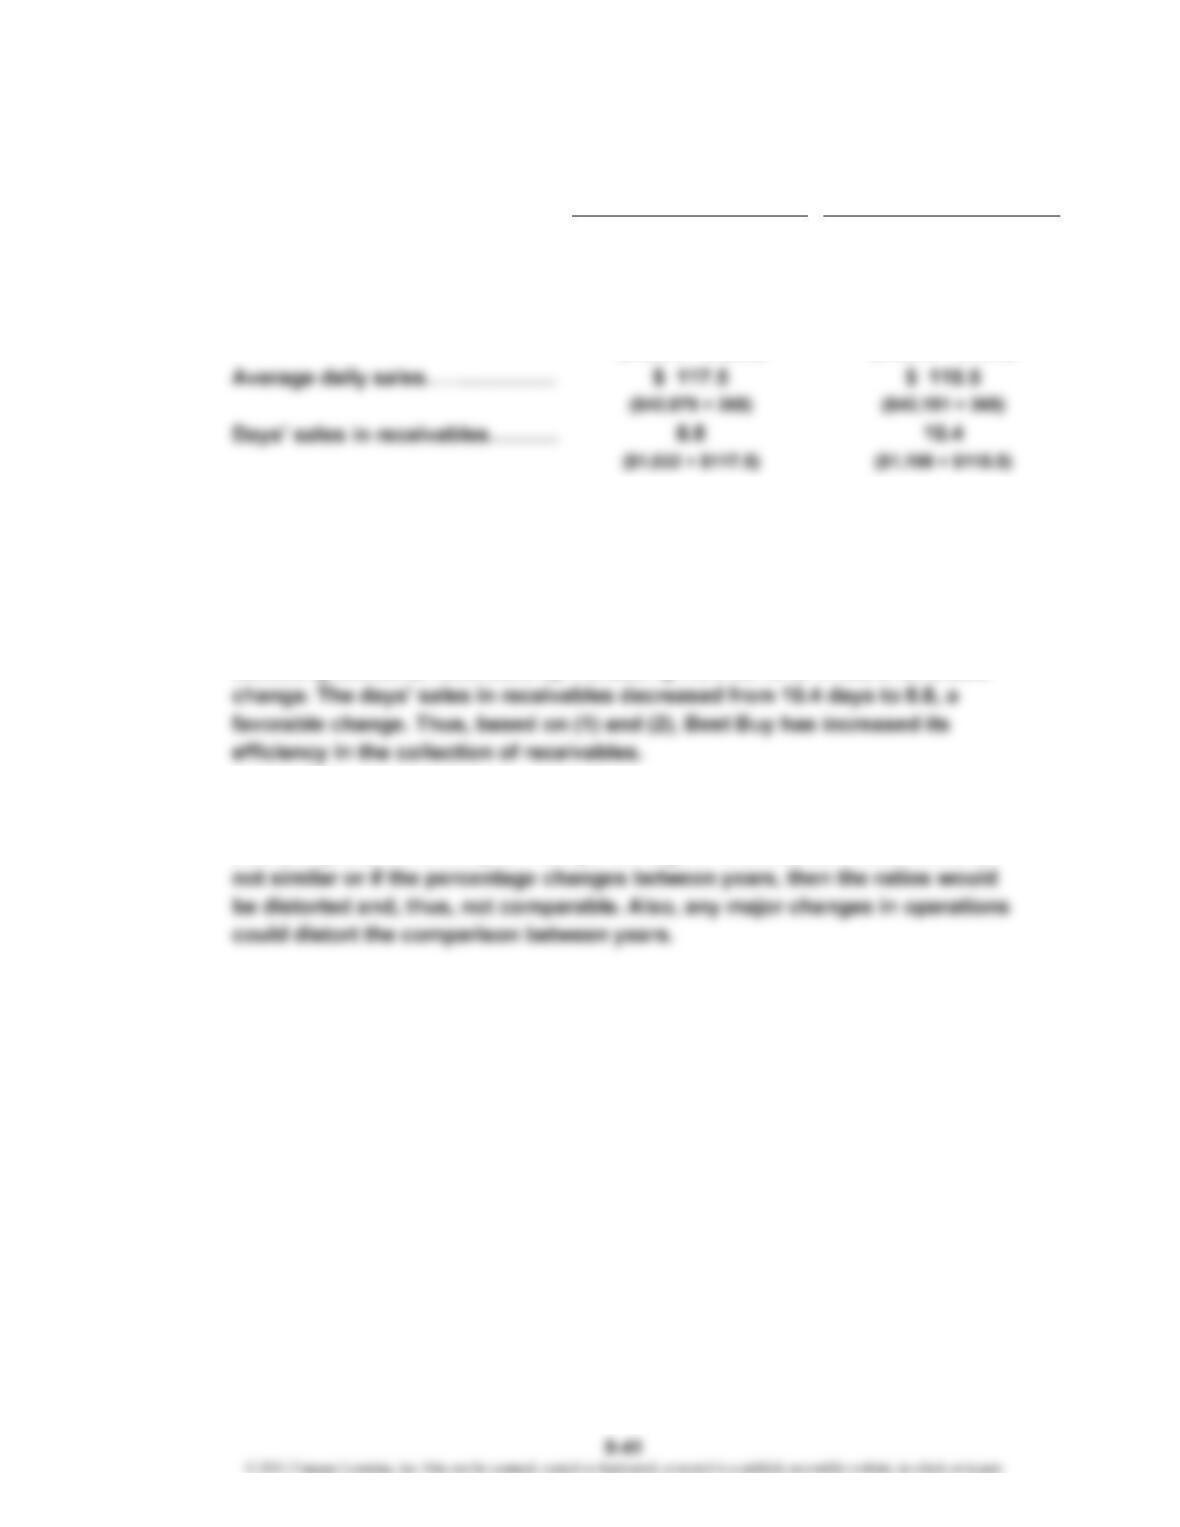
1. and 2.
Sales…………………………………
Average accts. receivable………
…
Accts. receivable turnover………
…
The days’ sales in receivables could also be computed by dividing 365 days by
the accounts receivable turnover as follows:
Year 2: 8.8 (365 days ÷ 41.55)
Year 1: 10.4 (365 days ÷ 35.18)
3. The accounts receivable turnover indicates an increase in the efficiency of
collecting accounts receivable by increasing from 35.18 to 41.55, a favorable
4. We assumed that the percentage of credit sales to total sales remains constant
from one period to the next and no major changes in operations occurred
between years. For example, if the percentage of credit sales to total sales is
$ 1,198$ 1,032
[($1,015 + $1,049) ÷ 2] [($1,049 + $1,347) ÷ 2]
35.1841.55
($42,879 ÷ $1,032) ($42,151 ÷ $1,198)
Year 2 Year 1
$42,879 $42,151
…
CP 9-7
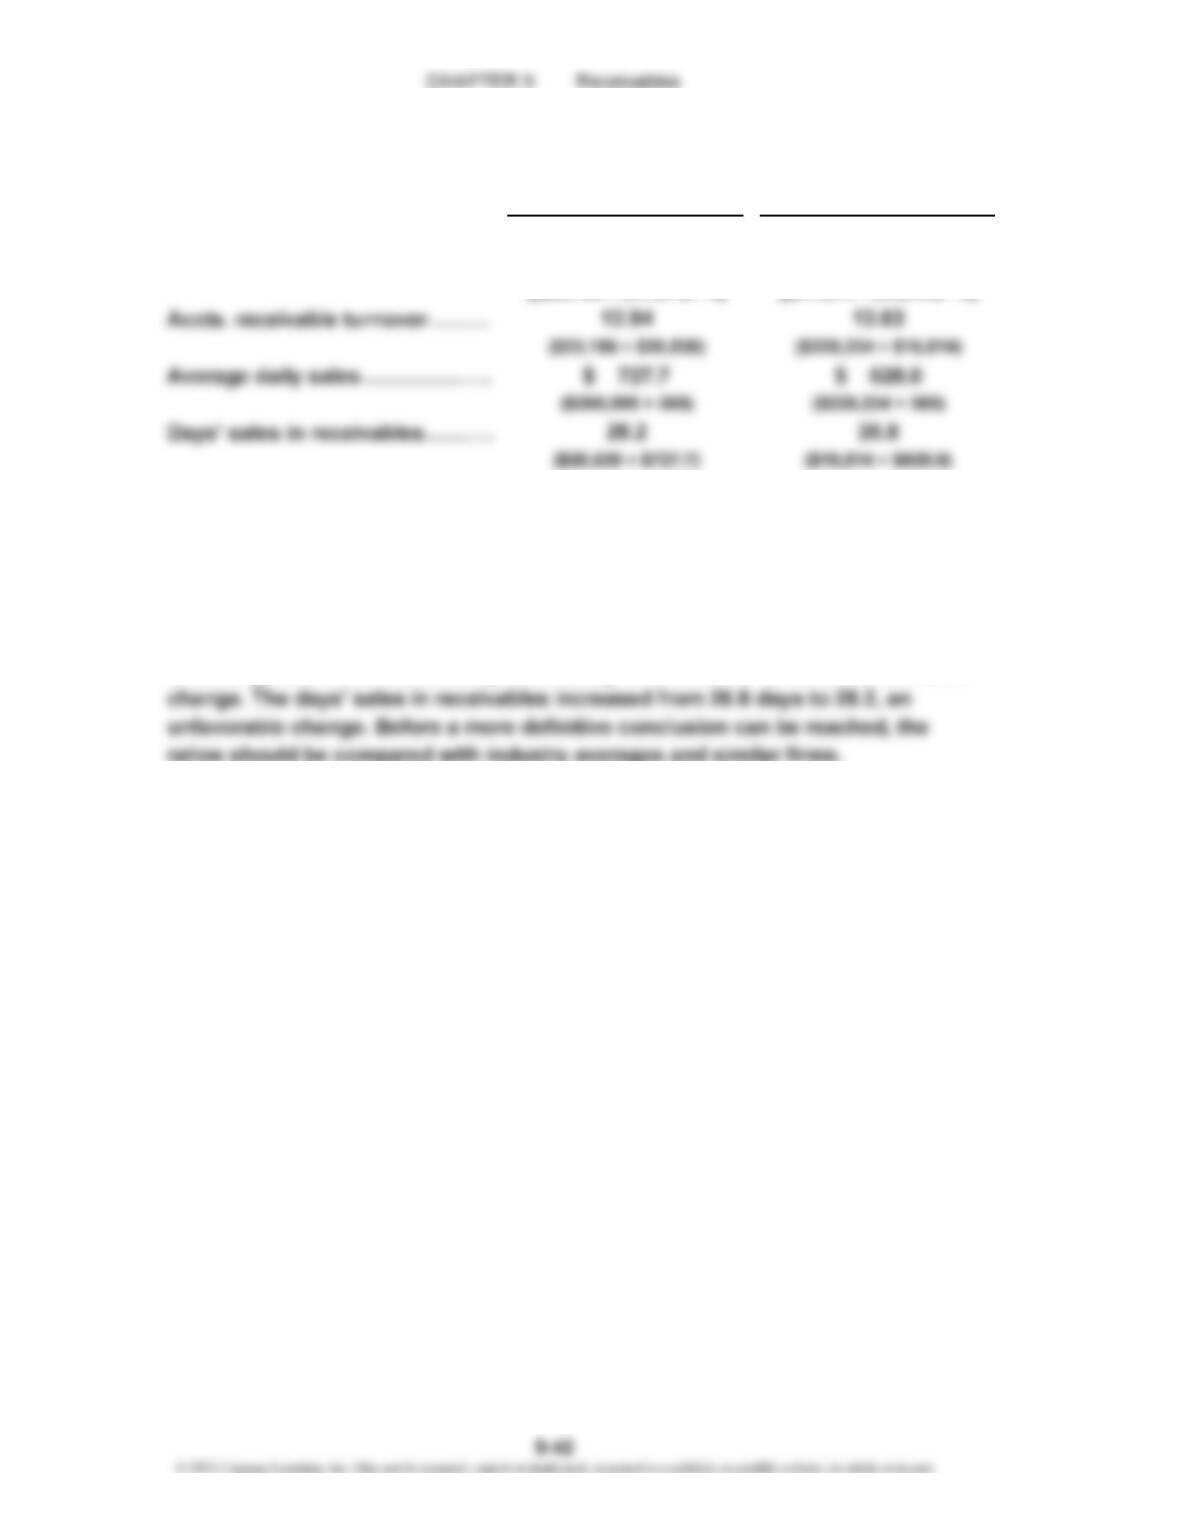
1. and 2.
Sales…………………………………
Average accts. receivable………
…
…
The days’ sales in receivables could also be computed by dividing 365 days by
the accounts receivable turnover as follows:
Year 2: 28.2 (365 days ÷ 12.94)
Year 1: 26.8 (365 days ÷ 13.63)
3. The accounts receivable turnover indicates a decline in the efficiency of
collecting accounts receivable by decreasing from 13.63 to 12.94, an unfavorable
Year 2 Year 1
$265,595 $229,234
$ 20,530 $ 16,814
CHAPTER 9 Receivables
CP 9-8
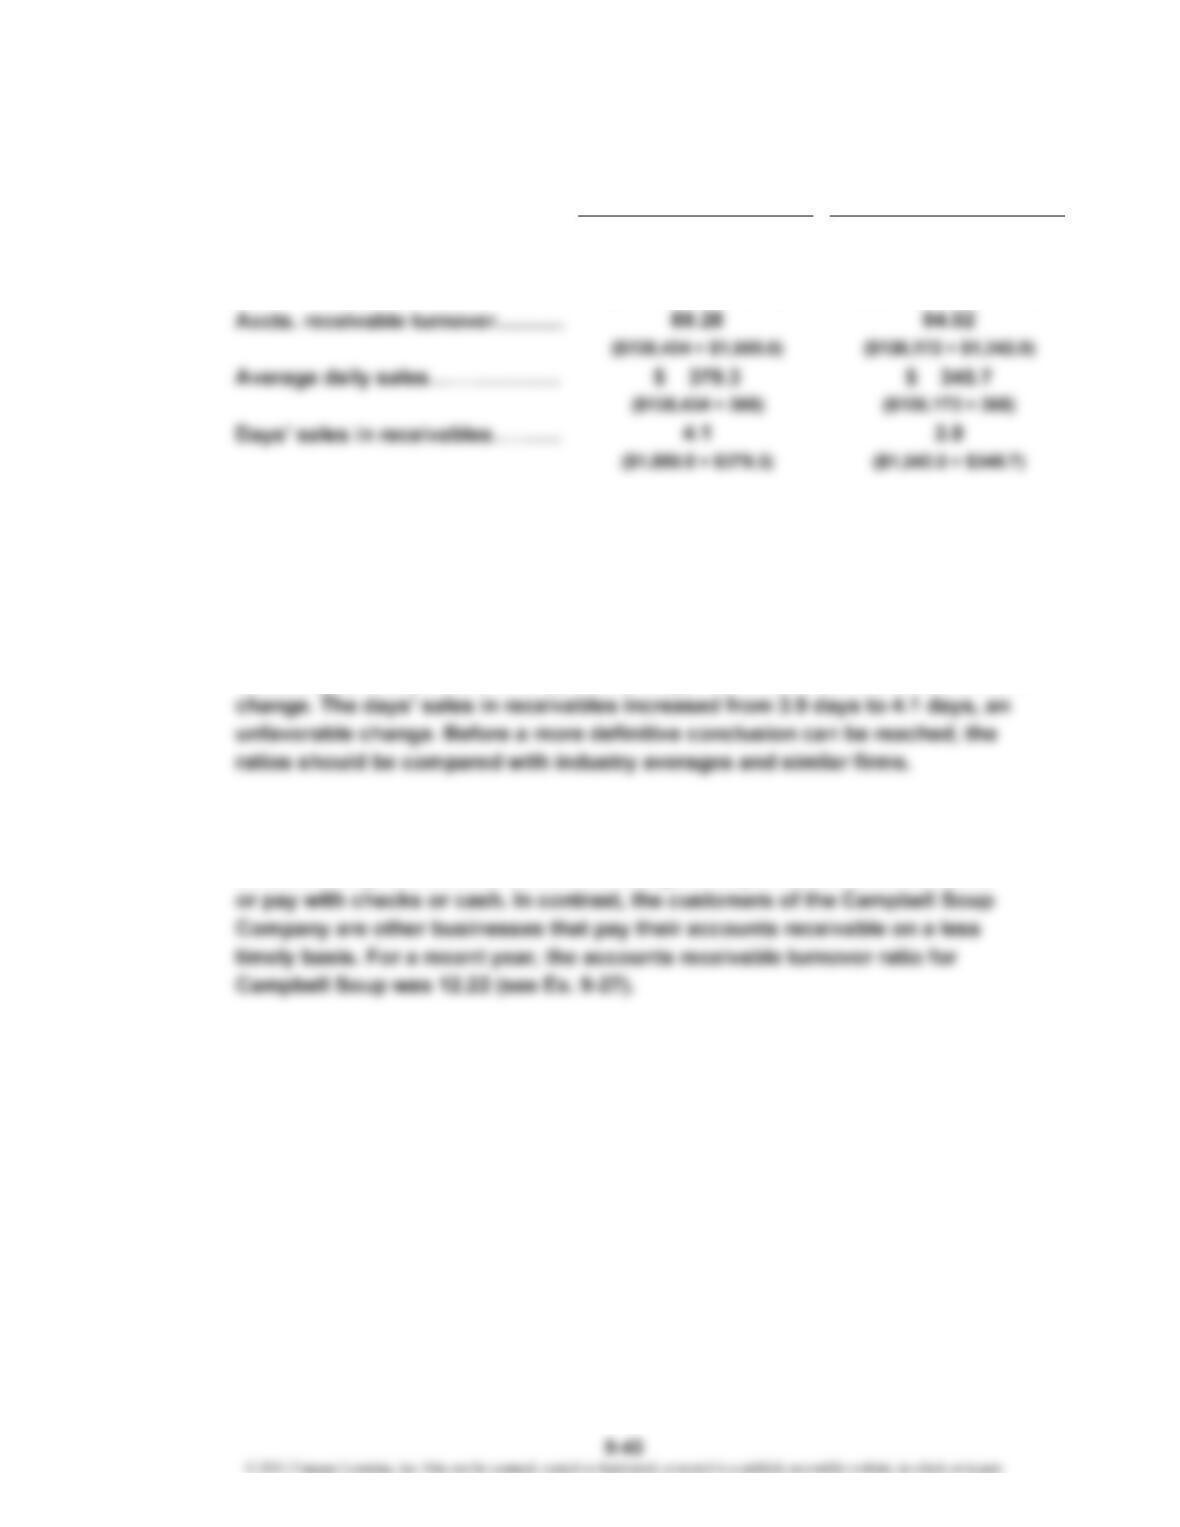
1. and 2.
Sales…………………………………
Average accts. receivable………
…
The days’ sales in receivables could also be computed by dividing 365 days by
the accounts receivable turnover as follows:
Year 2: 4.1 (365 days ÷ 89.28)
Year 1: 3.9 (365 days ÷ 94.02)
3. The accounts receivable turnover indicates a slight decrease in the efficiency of
collecting accounts receivable by decreasing from 94.02 to 89.28, an unfavorable
4. Costco’s accounts receivable turnover would normally be higher than that of a
typical manufacturing company such as the Campbell Soup Company. This is
because many of Costco’s customers charge their purchases to credit cards
Year 2 Year 1
$138,434 $126,172
$ 1,550.5 $ 1,342.0
[($1,669 + $1,432) ÷ 2]
[($1,432 + $1,252) ÷ 2]
…
CP 9-9
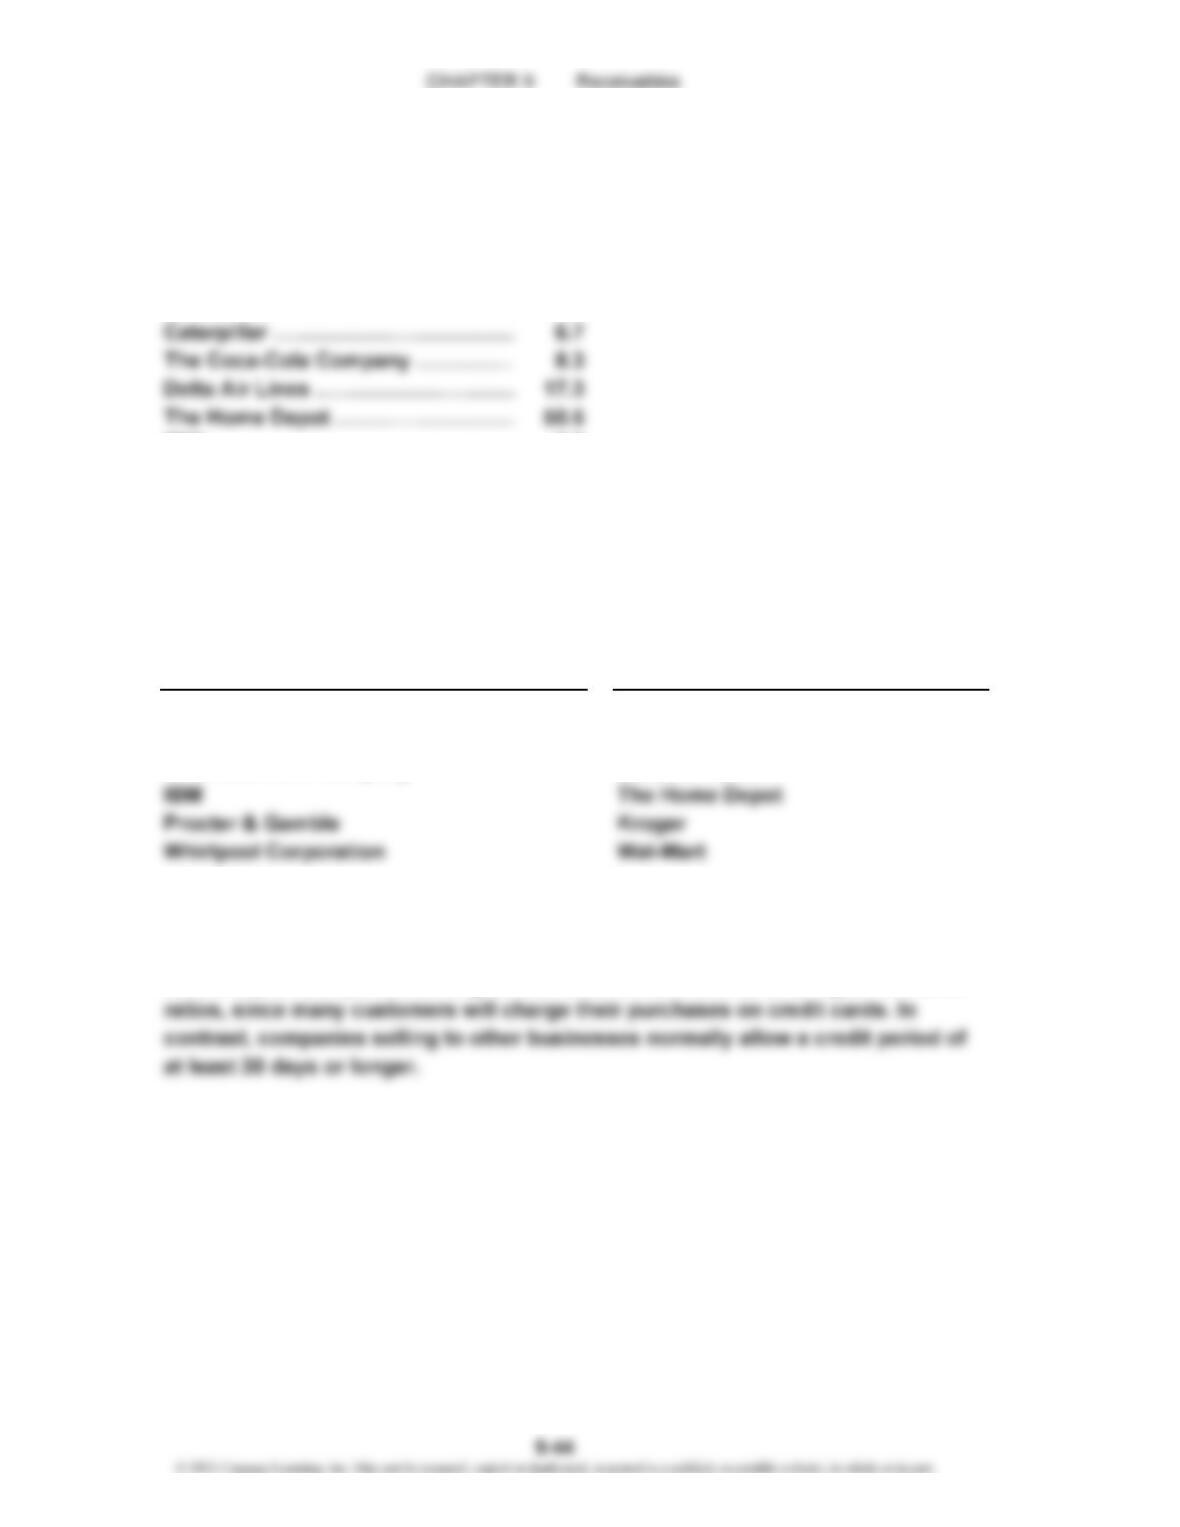
1. Note to Instructors: The turnover ratios will vary over time. Recently, the various
turnover ratios (rounded to one decimal place) were as follows:
Alcoa Corp. …………………………
…
12.2
AutoZone, Inc. ………………………
…
40.6
Barnes & Noble, Inc. ………………
…
55.8
…
…
…
IBM ……………………………………
…
9.8
Kroger …………………………………
…
79.6
Procter & Gamble …………………… 13.8
Wal-Mart ………………………………
…
95.1
Whirlpool Corporation ……………
…
8.5
Based on the above ratios, the companies can be categorized as follows:
Alcoa Inc. AutoZone, Inc.
Caterpillar Barnes & Noble, Inc.
The Coca-Cola Company Delta Air Lines
2. The companies with accounts receivable turnover ratios above 15 are all companies
selling primarily to individual consumers. In contrast, companies with turnover
ratios below 15 are companies selling primarily to other businesses. Generally, we
would expect companies selling to individual consumers to have higher turnover
Below 15 Above 15
Accounts Receivable Turnover Ratio