9
Activity-Based Costing
Solutions to Review Questions
9-1.
Common allocation bases are direct labor-hours, direct labor costs, and machine-hours.
Somewhat less common is direct material costs.
9-2.
The term “death spiral” refers to a process that begins by attempting to increase prices
9-3.
False. Department allocation is a two-stage process, so the first-stage assignment of
costs and the choice of cost drivers affects the allocation of costs to products. The total
product costs are the same under either approach, but the individual product costs
differ. This can affect the decisions managers make regarding individual products.
9-4.
Most companies produce multiple products and simply adding them up does not
account for differences in complexity of the use of resources. As an extreme example,
suppose a company produced airplanes and staplers. Allocating overhead on the basis
of units would assign the same overhead cost to a stapler and a plane.
9-5.
The costs include the systems and the software, but the most important cost is
9-6.
1. Identify activities that consume resources.
2. Identify the cost driver associated with each activity.
3. Compute a cost rate per activity unit (e.g., rate per setup, rate per part, rate per
machine-hour).
4. Allocate costs to products by multiplying the activity rate times the volume of activity
consumed by the product.
9-7.
9-8.
False. While the total cost allocated is the same, the reported costs for individual
9-9.
Activity-based costing will benefit most companies with high overhead costs and diverse
9-10.
A personnel department provides its services by completing a set of activities using
resources. In this way, implementing activity-based costing in an administrative function
is the same as implementing it in a manufacturing firm. However, the products and
activities may be much harder to define, making it less like a manufacturing
environment.
9-11.

9-12.
9-13.
Time equations allow managers to adjust the time required for activities for selected
characteristics of products or services.
Solutions to Critical Analysis and Discussion Questions
9-14.
9-15.
Activity-based costing does not change the process for direct costs, so the statement is
false. For indirect cost, it is uncertain, because it depends on the cost drivers used and
the diversity in the processes. For processes that are used in the same way for all
products, the particular allocation process is not that important.
9-16.
Disagree. The services in a business school, as in any service business, require
activities (preparing classrooms, organizing recruiting, etc.). The costs of the business
school can be assigned to these activities and then allocated to services (e.g., degree
programs) using appropriate cost drivers (e.g., number of students, number of classes,
number of faculty, etc.).
9-17.
False. Activity-based costing is most useful when the first-stage allocation is to
activities, not departments. Further, an activity-based costing system also uses cost
drivers that form a hierarchy of costs, as appropriate, whereas most department
allocation costing systems use volume-based cost drivers.
9-18.
9-19.
9-20.
False. The lesson learned from activity-based costing is that costs are a function not
only of output volume, but also of other factors such as complexity. For example, a
complex multiproduct operation will cost more than a simple single-product operation.
9-21.
False. Activity-based costing breaks down the costs into cost pools according to the
activities that cause the costs. While several departments may have the same cost
drivers, each department should individually determine which activities cause their
costs.
9-22.
There are two important characteristics you should look for. Are the first-stage cost
pools activities? Second, do the cost drivers in the second stage form a cost hierarchy
(e.g., volume related, batch related, etc.) or are they all volume-related costs?
9-23.
9-24.
Disagree. The cost of implementing activity-based costing for inventory valuation
generally is not worth the small benefits that might be realized. It is most worthwhile
when managers use product cost data to make decisions at the product level.
9-25.
Answers will vary based on the degrees offered and the nature of the school. Some
9-26.
Answers will vary. The function selected will determine the activities, but some
9-27.
Answers will vary. Elements of the system that suggest it is an ABC system include cost
pools that are activities, multiple cost pools, and multiple cost drivers. However, the two
drivers are both volume-based, meaning there really is no cost hierarchy. The system
will suffer from many of the problems of a traditional system, including the assignment
of costs to products based on volume alone.
9-28.
Although it appears that a time-driven activity-based cost system lacks a cost hierarchy,
9-29.
Job costing and ABC systems are not mutually exclusive, although it might seem that
way. A job costing system is designed to cost certain cost objects, called jobs. It does
this by tracing direct costs (materials and labor) to the jobs and applies overhead to the
jobs based on the application base. Although in chapter 7 we assumed only one
application base, there was nothing that restricted us from developing multiple overhead
pools based on activities and then allocating costs from the activities to the individual
jobs.
9-30.
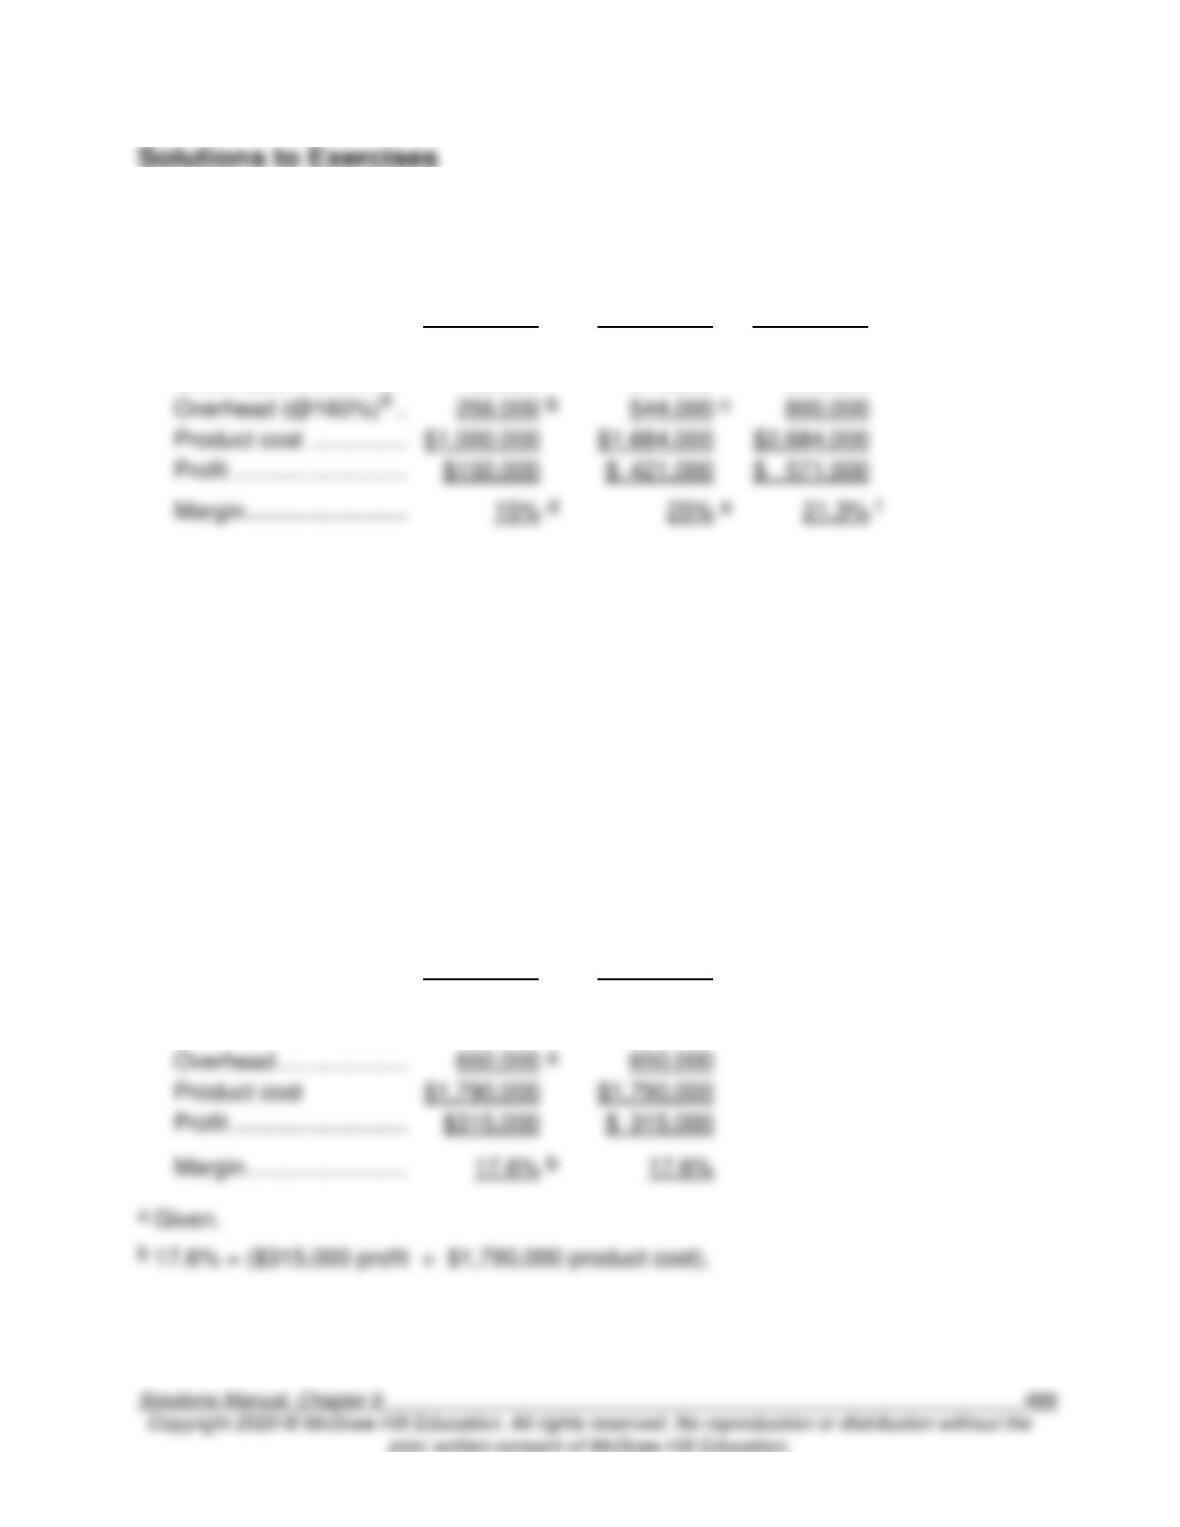
9-31. (15 min.) Reported Costs and Decisions: McNulty, Inc.
Chairs
Desks
Total
a.
Sales revenue ………….
$1,150,000
$2,105,000
$3,255,000
Direct material ………….
584,000
800,000
1,384,000
Direct labor ……………..
160,000
340,000
500,000
256,000
b
Product cost ……………
$1,000,000
$1,684,000
a 160% = ($800,000 overhead ÷ $500,000 direct labor).
b $256,000 = $160,000 direct labor x 160%.
c $544,000 = $340,000 direct labor x 160%.
d 15% = ($150,000 profit ÷ $1,000,000 product cost).
e 25% = ($421,000 profit ÷ $1,684,000 product cost).
f 21.3% = ($571,000 profit ÷ $2,684,000 product cost).
b. After dropping chairs, the profit margin on desks falls below 20 percent.
Desks
Total
Sales revenue ………….
$2,105,000
$2,105,000
Direct Labor …………….
800,000
800,000
Direct materials ………..
340,000
340,000
Overhead ………………..
a
Product cost
$1,790,000
$1,790,000
Margin …………………….
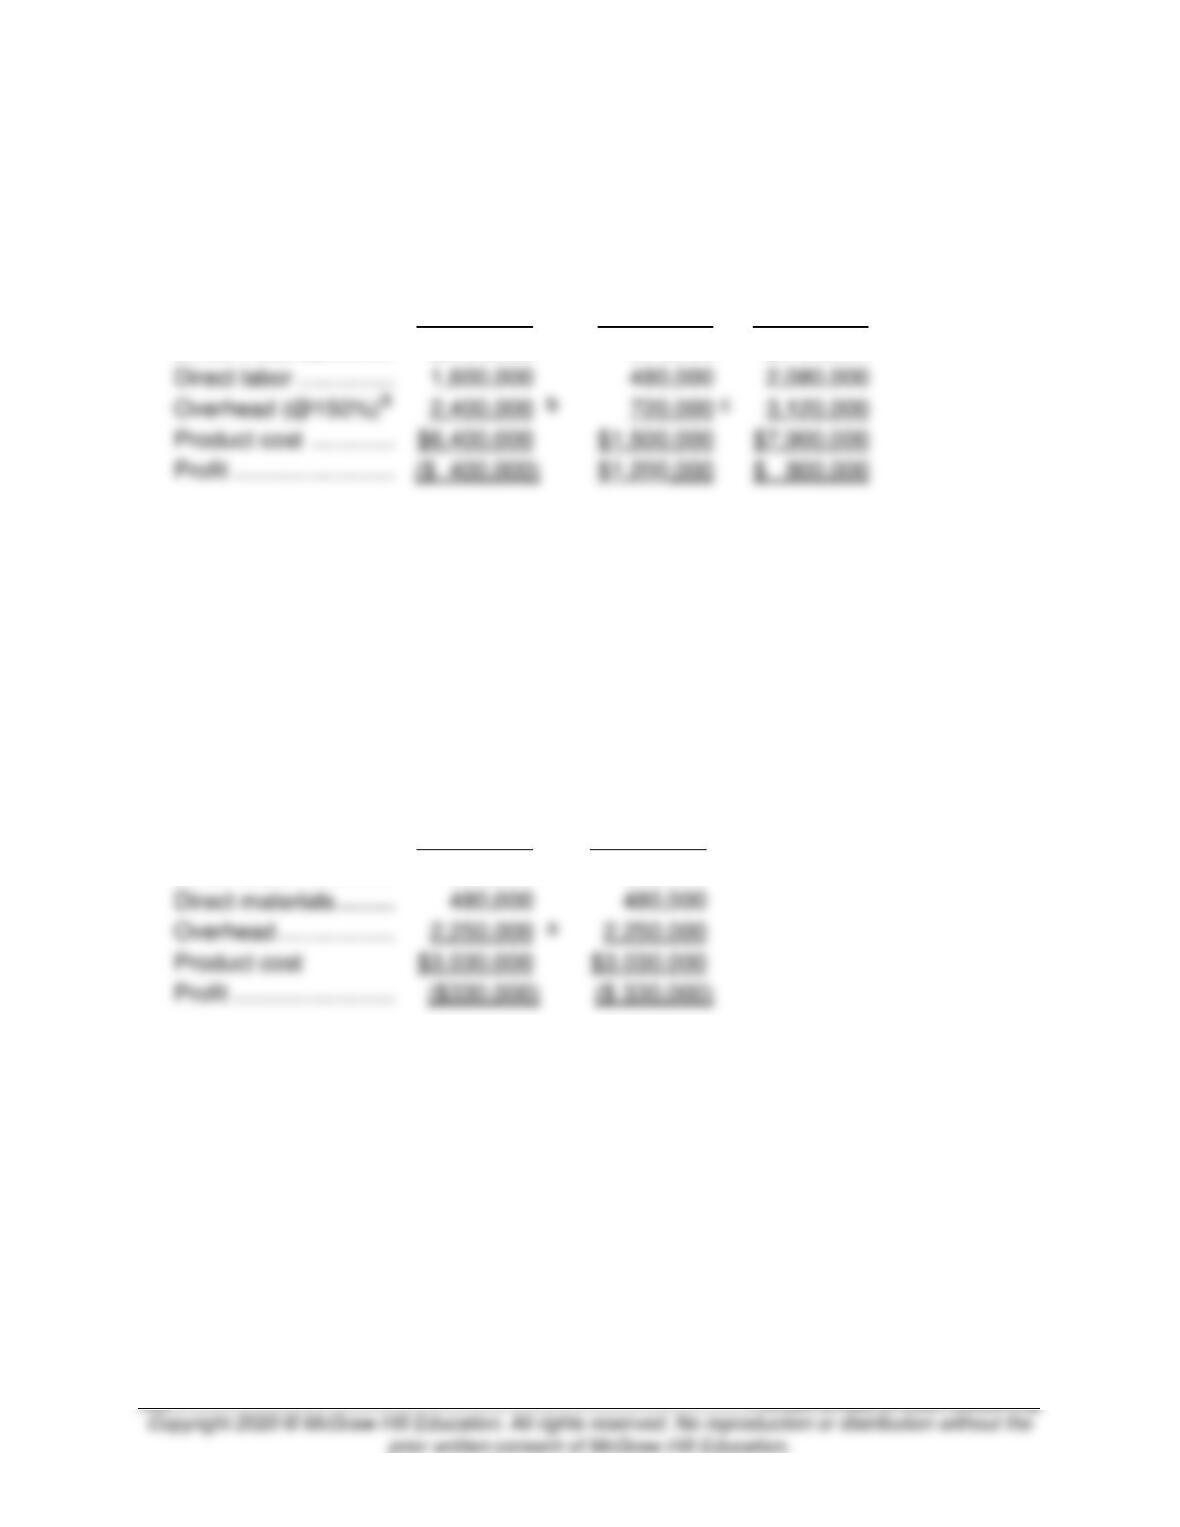
9-32. (15 min.) Reported Costs and Decisions: Kima Company.
Standard
Galaxy
Total
a.
Sales revenue ………..
$6,000,000
$2,700,000
$8,700,000
Direct material ………..
2,400,000
300,000
2,700,000
Direct labor ……………
1,600,000
480,000
2,080,000
b
Product cost ………….
$6,400,000
a 150% = ($3,120,000 overhead ÷ $2,080,000 direct labor).
b $2,400,000 = $1,600,000 direct labor × 150%.
c $720,000 = $480,000 direct labor × 150%.
b. After dropping the standard model, the profit on the Galaxy model (and for the
company) becomes negative.
Galaxy
Total
Sales revenue ………..
$2,700,000
$2,700,000
Direct Labor …………..
300,000
300,000
Direct materials ………
Overhead ………………
a
2,250,000
Product cost
$3,030,000
a Given.
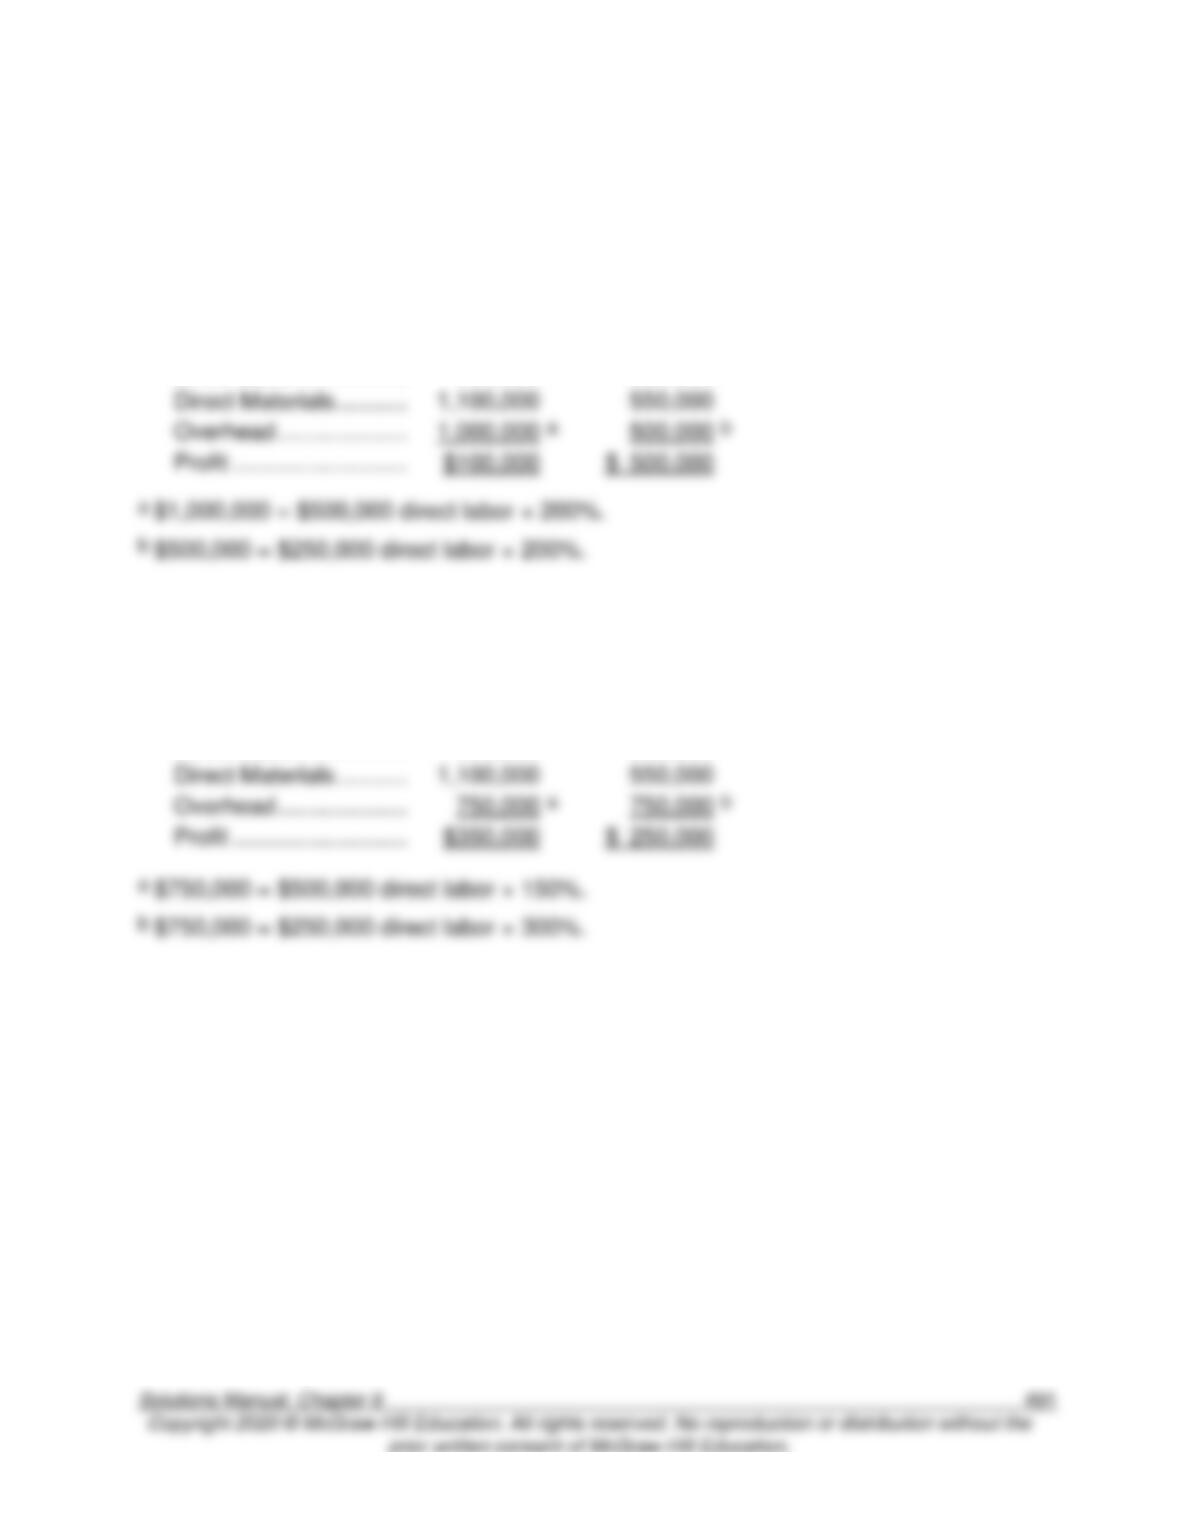
9-33. (30 min.) Plantwide versus Department Allocation: Munoz Sporting
Equipment.
Baseball
Bats
Tennis
rackets
a.
Sales revenue ………….
$2,700,000
$1,800,000
Direct Labor …………….
500,000
250,000
Direct Materials ………..
550,000
Overhead ………………..
a
500,000
b
b. Maria was wrong; Baseball bats were more profitable.
Baseball
Bats
Tennis
rackets
Sales revenue ………….
$2,700,000
$1,800,000
Direct Labor …………….
500,000
250,000
Direct Materials ………..
550,000
Overhead ………………..
750,000
a
750,000
b
c. The plantwide allocation method allocates overhead at 200% of direct labor for both
types of equipment. While this is the simplest method, it is usually not very accurate. It
assumes that overhead in both departments has the same rate. When overhead costs
are broken down into department cost pools, we see that Department B is allocated a
smaller share of the overhead. Each department should try to assess what causes its
overhead, and use that as its allocation base.
9-34. (35 min.) Plantwide versus Department Allocation: Main Street Ice Cream
Company.
Strawberry
Vanilla
Chocolate
a.
Direct Labor (per 1,000 gallons) ….
$750
$825
$1,125
Raw Materials (per 1,000 gallons) .
800
500
600
Overhead …………………………………
150
a
165
b
225
c
Total cost (per 1,000 gallons) ……..
$1,700
$1,490
$1,950
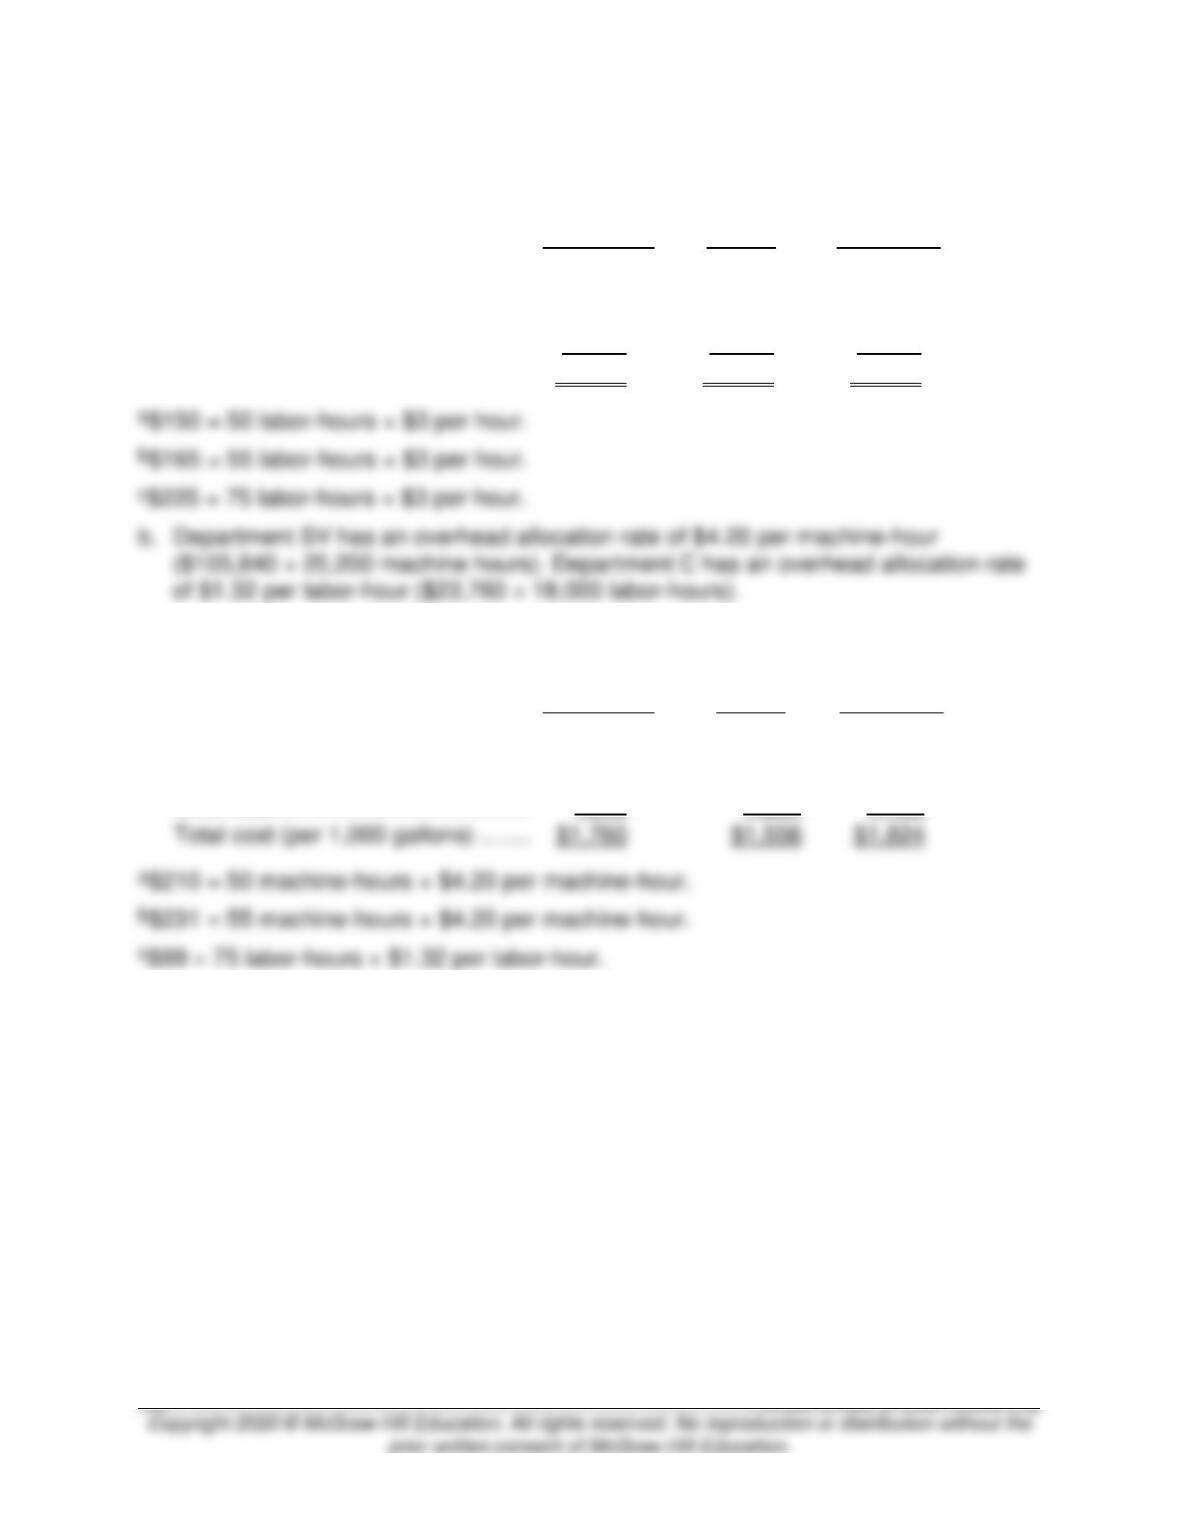
c.
Strawberry
Vanilla
Chocolate
Direct Labor (per 1,000 gallons) ….
$750
$825
$1,125
Raw Materials (per 1,000 gallons) .
800
500
600
Overhead …………………………………
210
a
231
b
99
c
d. Charlene was correct in her belief that she was being allocated some of Department
SV’s overhead. Plantwide allocation does not correctly allocate the overhead by
department; it simply uses one allocation rate for all products in all departments.
Under plantwide allocation, 1,000 gallons of chocolate cost $1,950. Once the
overhead was reallocated into department cost pools, the cost of chocolate fell to
$1,824. Although it requires more time and skill to collect and process the
information, department allocation generally yields more accurate product cost
information.
9-35. (30 min.) Unitwide versus Department Allocation: Hernandez Bros.
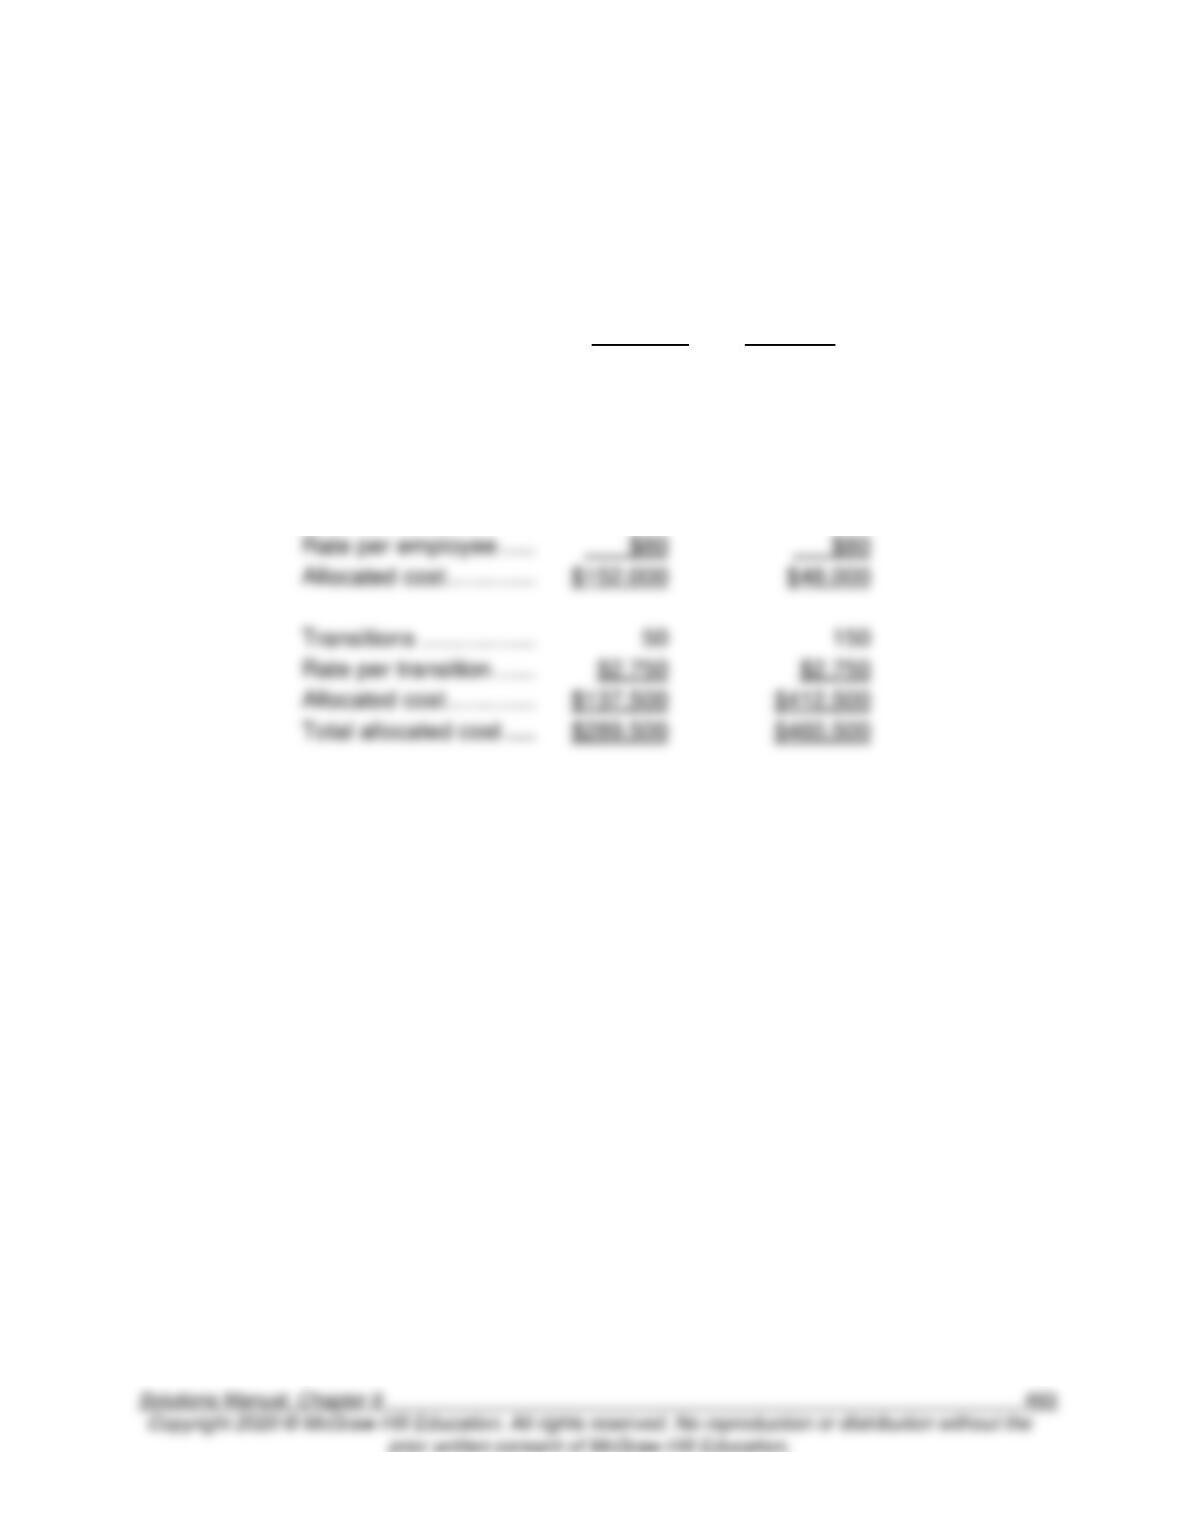
a.
b.
Miami
New York
Employees ………………
1,900
600
Rate per employee ……
Allocated cost …………..
Transitions ………………
Rate per transition …….
Allocated cost …………..
Total allocated cost …..
Miami
New York
Employees ………………
1,900
600
Rate per employee …..
$300
$300
Allocated cost ………….
$570,000
$180,000
9-36. (30 min.) Unit wide versus Department Allocation: Hernandez Bros.
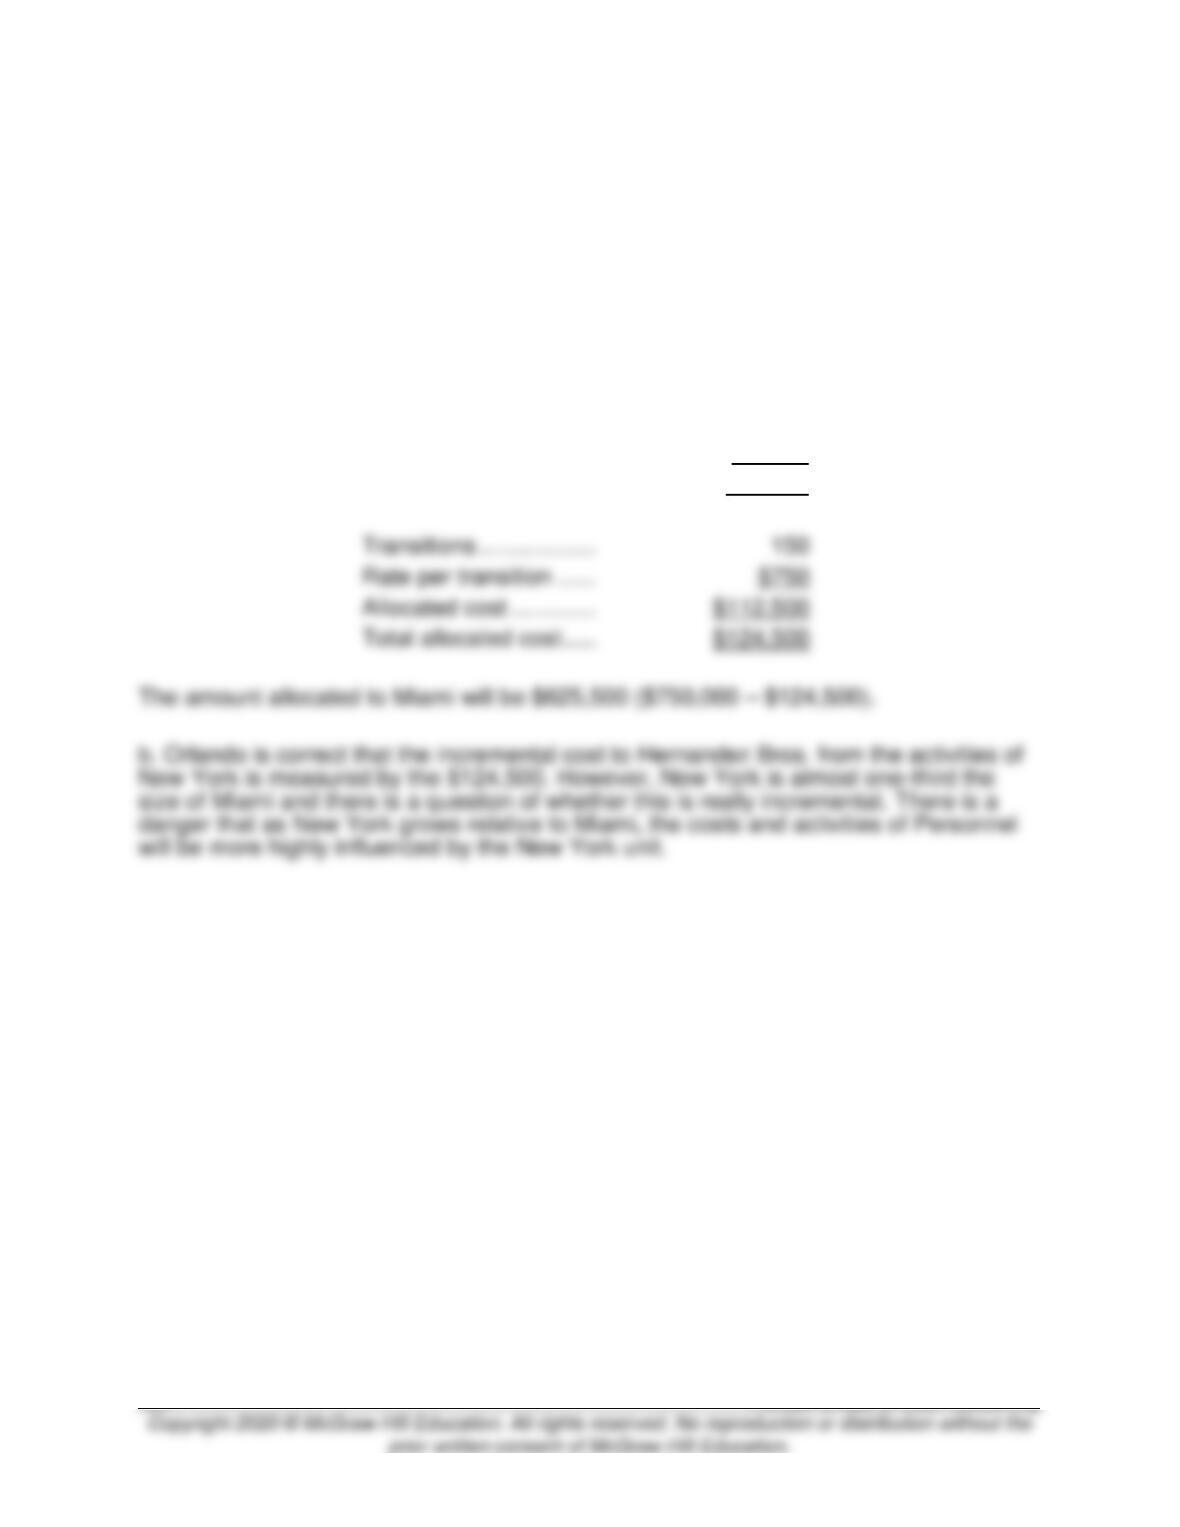
a. First, note that the total to be allocated is $750,000 (= $570,000 + $180,000 in the
current system or $289,500 + $460,500 in the revised system). Then we just need to
compute the variable cost to be allocated to New York; the difference between this and
$750,000 will be allocated to Miami.
New York
Employees ………………
600
Rate per employee …..
$20
Allocated cost ………….
$12,000
Transitions ………………
Rate per transition ……
Allocated cost ………….
Total allocated cost …..
9-37. (30 min.) Activity-Based Costing: IVC, Inc.
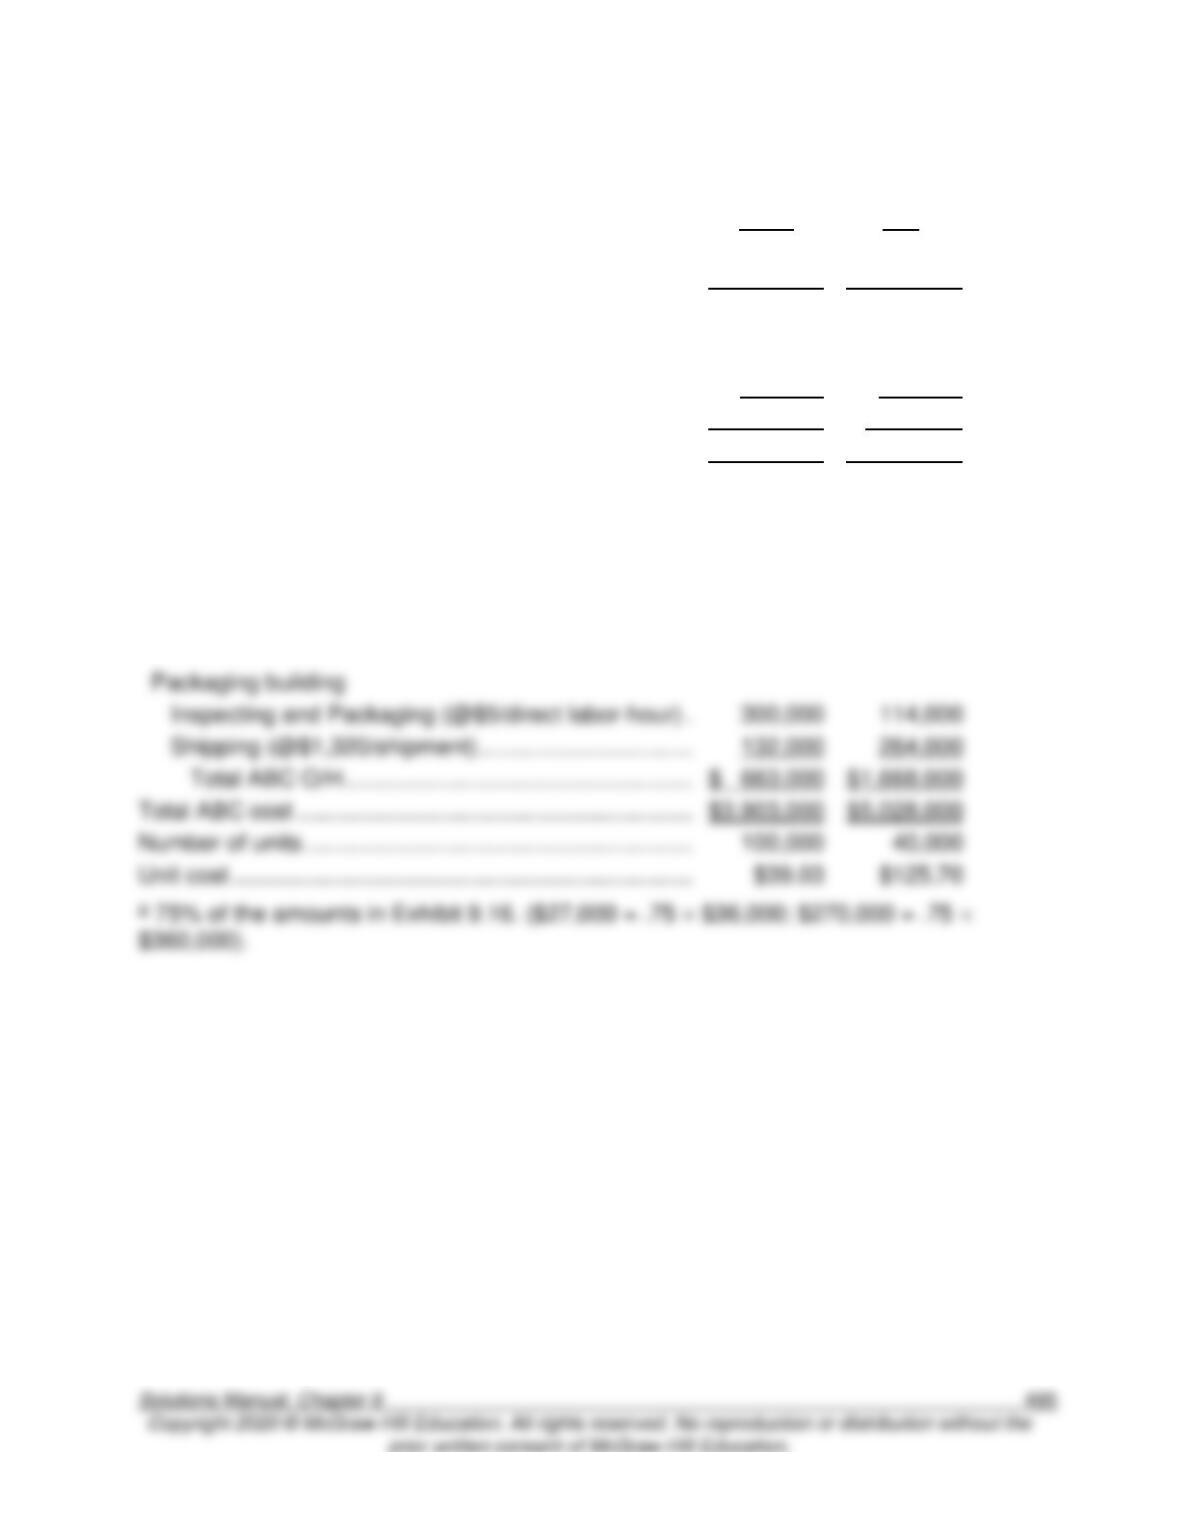
a.
Sport
Pro
Direct material ……………………………………………………..
$1,500,000
$2,400,000
Direct labor
Assembly …………………………..…………………………...
$ 750,000
$ 600,000
Packaging ………………………………………………………
990,000
360,000
Total direct labor …………………………………………..
$1,740,000
$960,000
Direct costs …………………………………………………………
$3,240,000
$3,360,000
Overhead
Assembly building
Assembling (@ $30/mh) ……………………………………
$ 180,000
$ 900,000
Setting up machine (@$900/setup-hour)a ……………
27,000
270,000
Handling material (@$3,000/run) ……………………….
24,000
120,000
Packaging building
Inspecting and Packaging (@$5/direct labor-hour) .
300,000
114,000
Shipping (@$1,320/shipment) …………………………...
132,000
264,000
Total ABC O/H………………………………………………
$ 663,000
Total ABC cost …………………………………………………….
$3,903,000
$5,028,000
Number of units ……………………………………………………
100,000
Unit cost ……………………………………………………………..
$39.03
9-37. (continued)
b. Tom could have made the reductions he planned, but the effect on the product costs
would have been different. The $99,000 reduction in setup costs (25% of $396,000),
would have been spread between the two products based on labor or machine–
hours.
ABC provides more detailed measures of costs than do plantwide or department
allocation methods. In this case, ABC shows the costs of machining, setting up
equipment, handling materials, inspecting, packaging products, and shipping. The
plantwide and department allocation methods did not reveal any of these detailed
cost drivers. With ABC’s more detailed information, management has an opportunity
to manage costs by managing cost drivers. For example, are there less costly ways
to inspect and package products? Or perhaps spending additional resources to
improve quality would more than pay for itself with reduced inspections.
9-38. (15 min.) Activity-Based Costing and Cost Driver Rates: Upriver Parts.
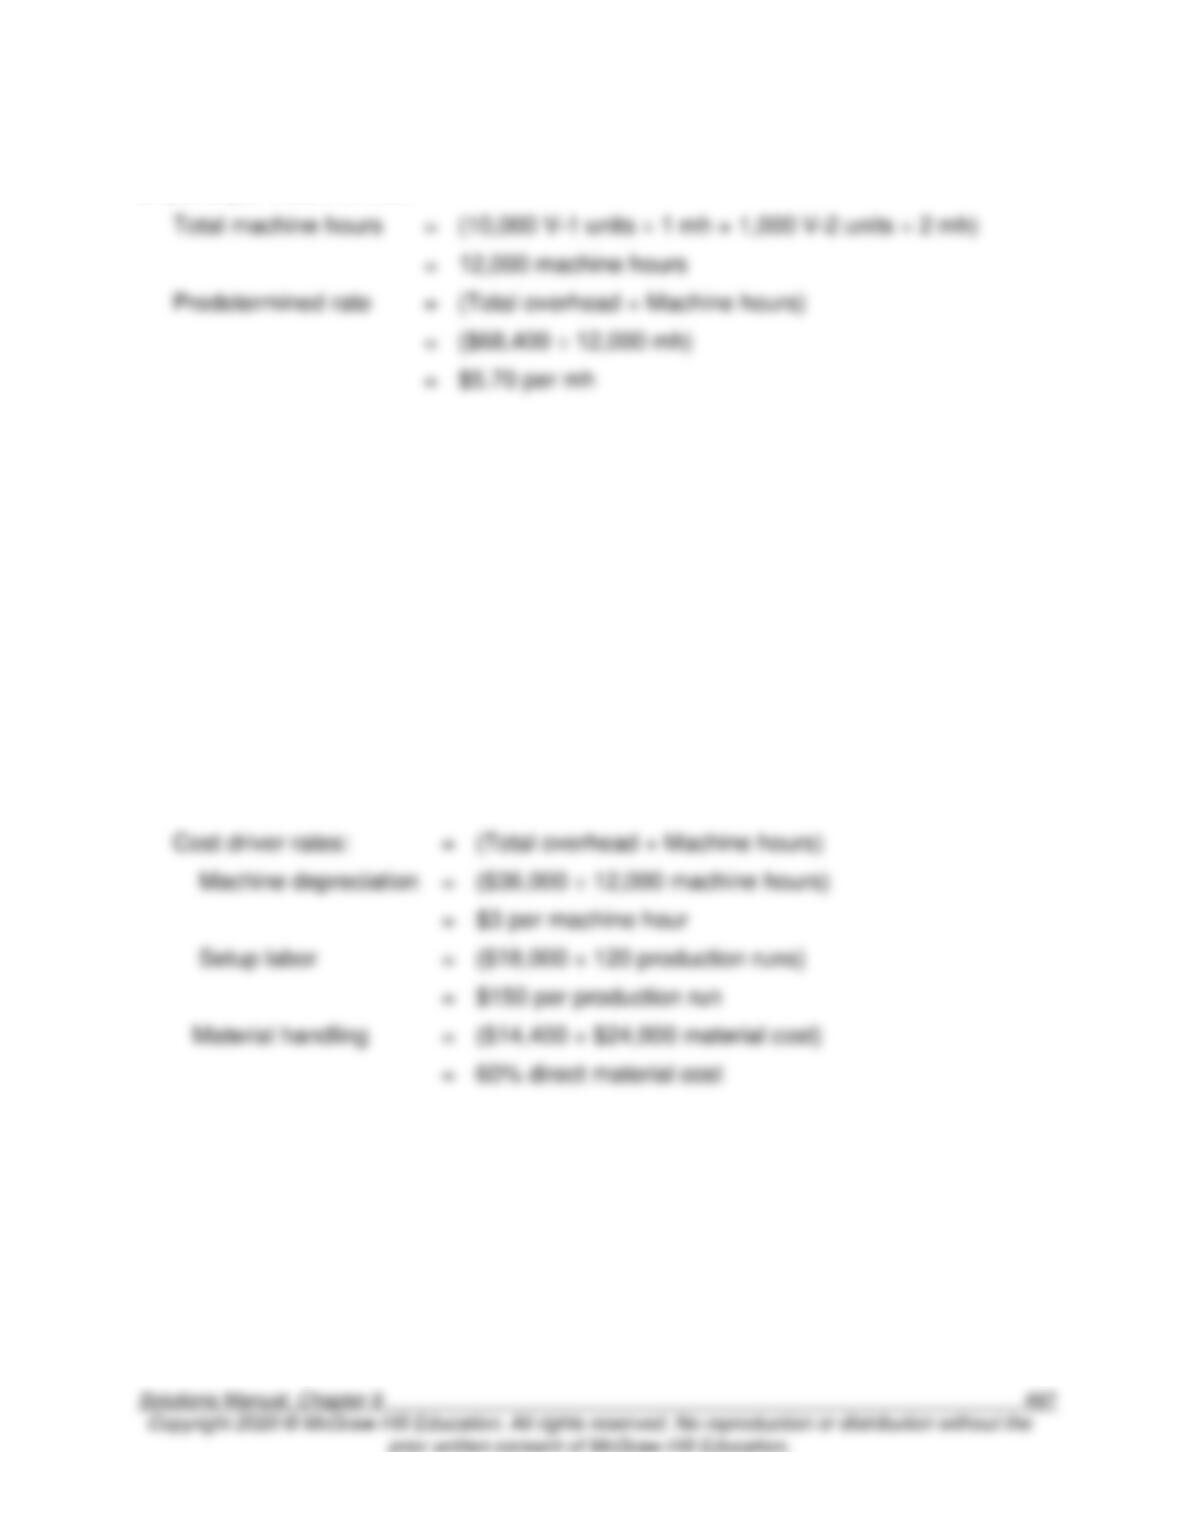
a. $5.70 per machine hour.
Total machine hours
=
(10,000 V-1 units 1 mh + 1,000 V-2 units 2 mh)
=
12,000 machine hours
Predetermined rate
=
(Total overhead ÷ Machine hours)
=
($68,400 ÷ 12,000 mh)
=
$5.70 per mh
b. ($3 per machine hour, $150 per production run, 60% direct material cost)
Cost driver rate
=
(Activity cost ÷ Cost driver volume)
Cost driver volumes:
Total machine hours
=
(10,000 V-1 units 1 mh + 1,000 V-2 units 2 mh)
=
12,000 machine hours
Total production runs
=
(80 V-1 runs + 40 V-2 runs)
=
120 production runs
Total material costs
=
(10,000 V-1 units x $2 + 1,000 V-2 units $4)
=
$24,000
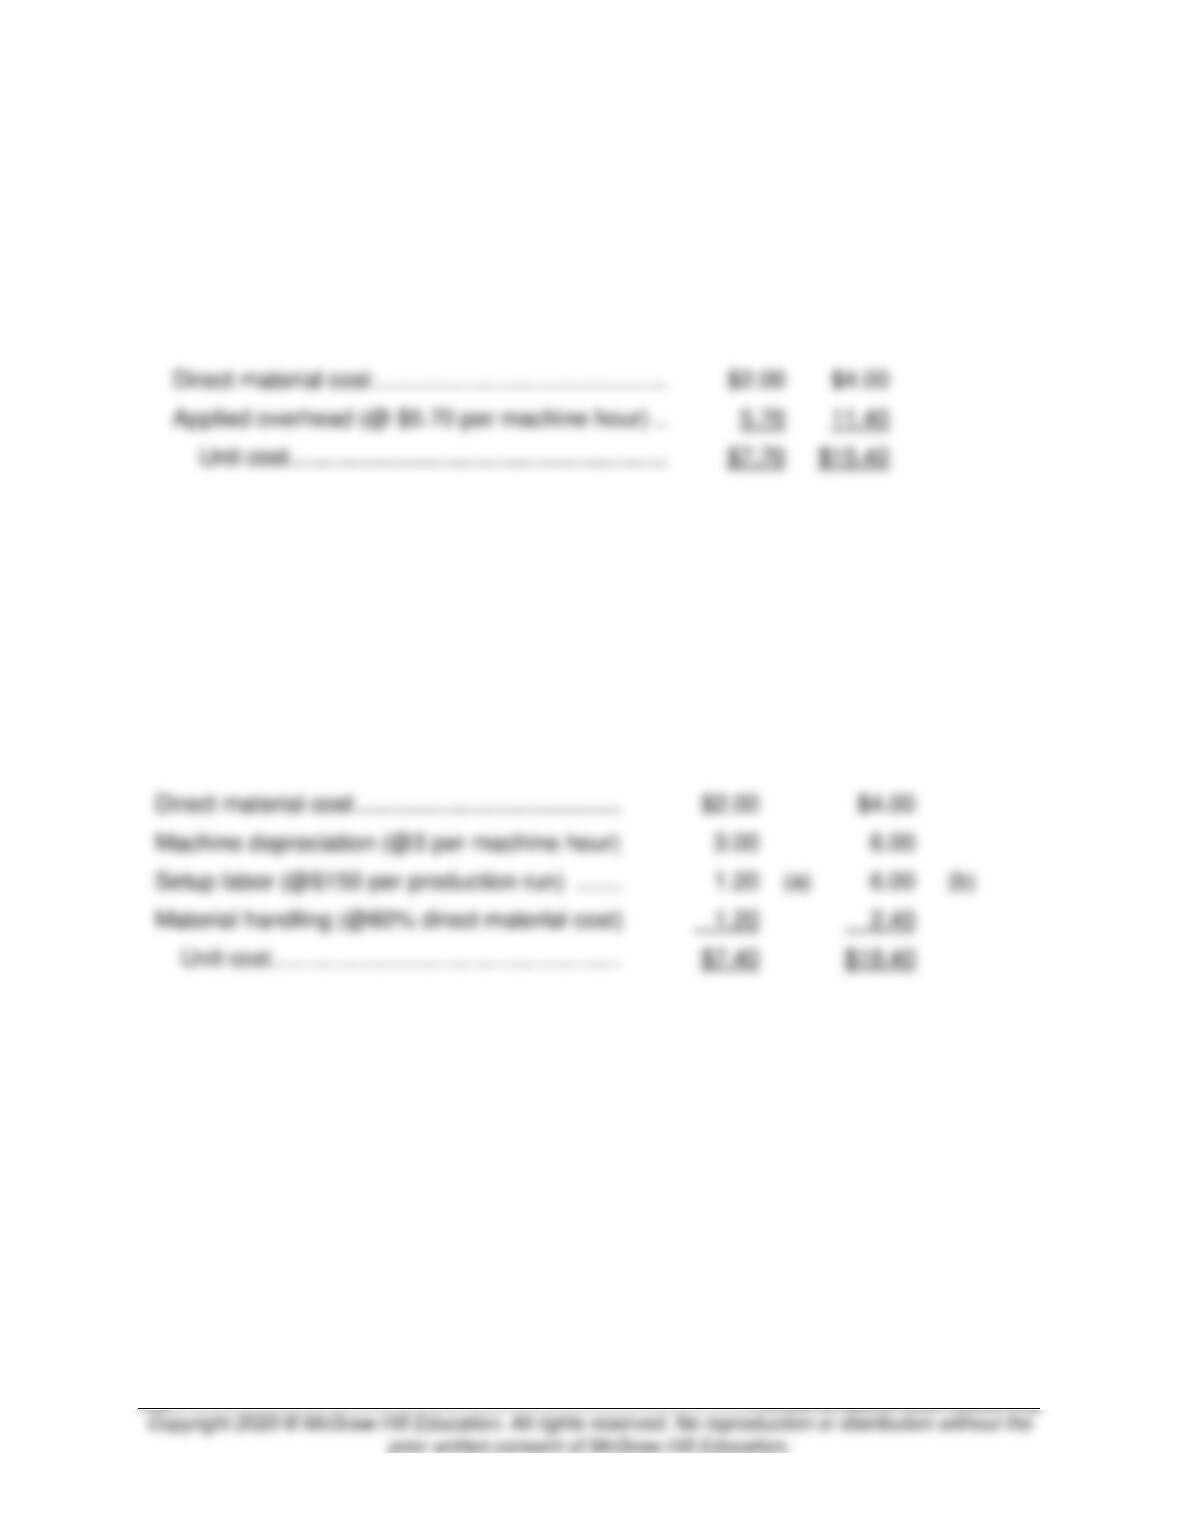
Cost driver rates:
=
(Total overhead ÷ Machine hours)
Machine depreciation
=
($36,000 ÷ 12,000 machine hours)
=
$3 per machine hour
Setup labor
=
($18,000 ÷ 120 production runs)
=
$150 per production run
Material handling
=
($14,400 ÷ $24,000 material cost)
=
60% direct material cost
9-39. (15 min.) Activity-Based Costing: Upriver Parts.
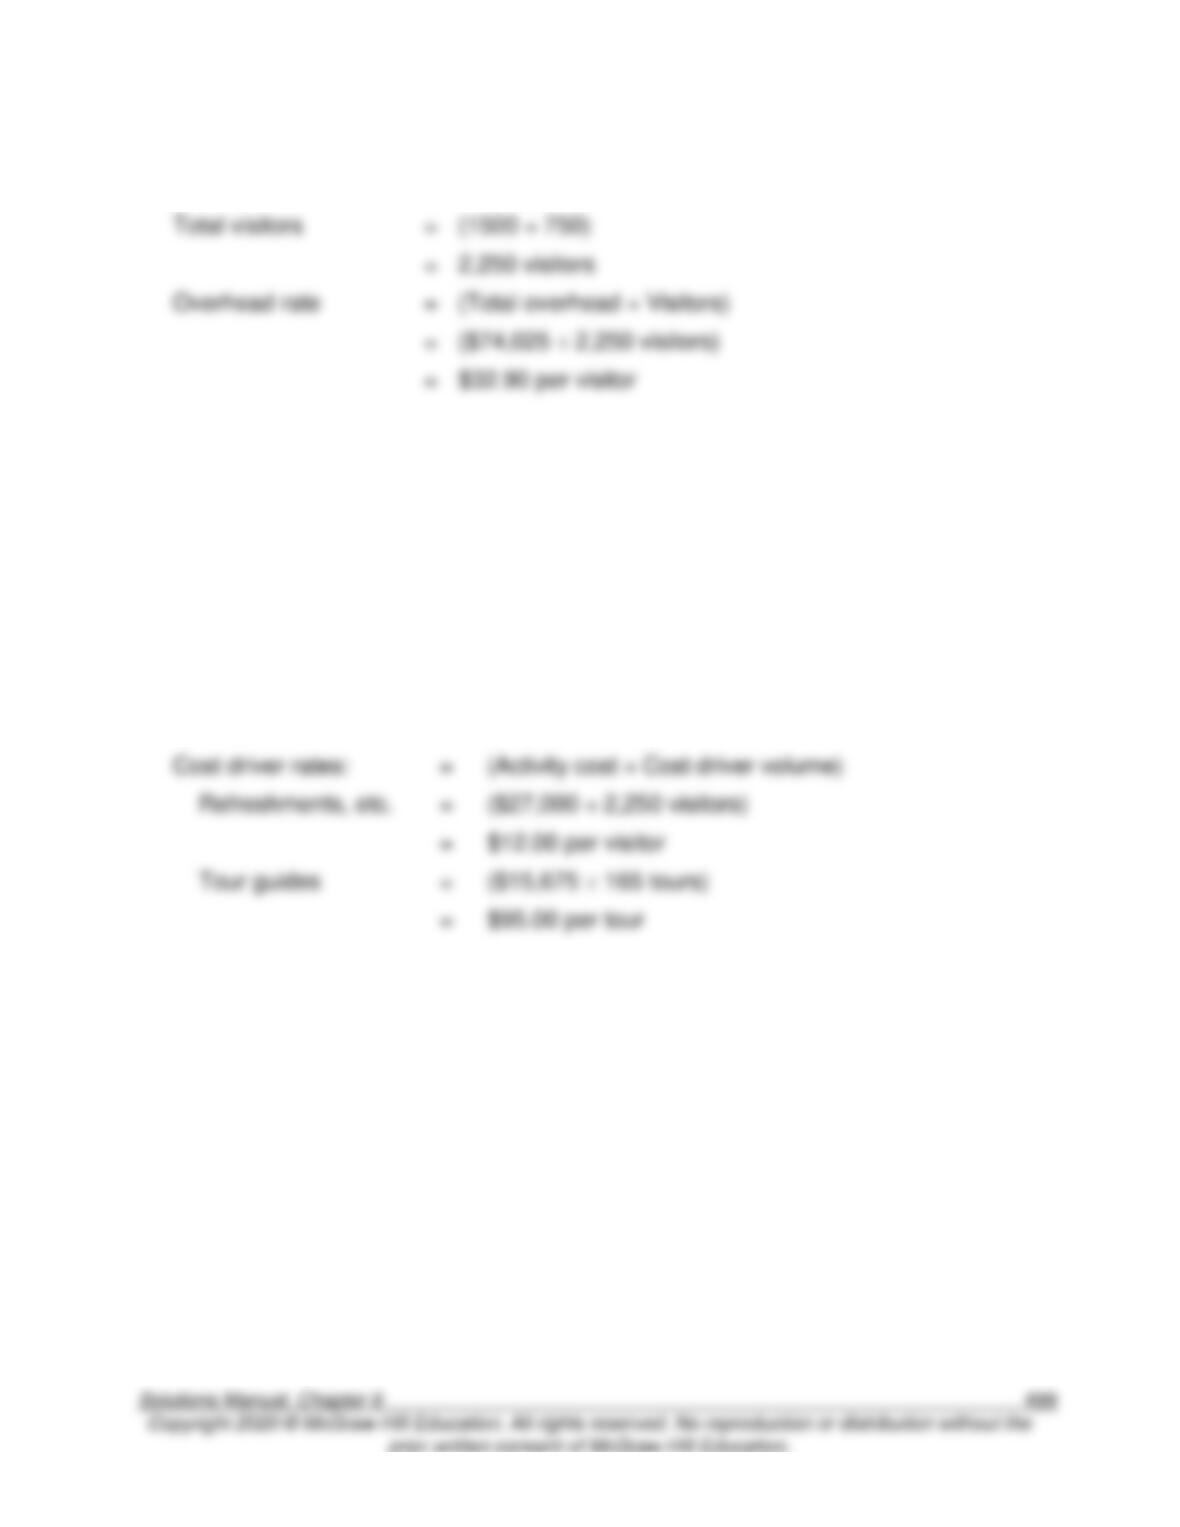
a. $7.70 per unit V-1, $15.40 per unit V-2.
V-1
V-2
Machine hours per unit …………………………………
1
2
Direct material cost ………………………………………
$2.00
$4.00
Applied overhead (@ $5.70 per machine hour) ..
11.40
$7.70
b. $7.40 per unit V-1, $18.40 per unit V-2.
V-1
V-2
Machine hours per unit ……………………………..
1
2
Production run (total) ………………………………..
80
40
Direct materials cost per unit ……………………..
$2.00
$4,00
Direct material cost …………………………………..
$2.00
$4.00
Machine depreciation (@3 per machine hour)
Setup labor (@$150 per production run) …….
Material handling (@60% direct material cost)
Notes: (a) $1.20 = (80 production runs $150 per run) ÷ 10,000 units.
(b) $6.00 = (40 production runs $150 per run) ÷ 1,000 units.
9-40. (15 min.) Activity-Based Costing and Cost Driver Rates: The City Museum.
a. $32.90 per visitor.
Total visitors
=
(1500 + 750)
=
2,250 visitors
Overhead rate
=
(Total overhead ÷ Visitors)
=
=
$32.90 per visitor
b.
Cost driver volumes:
Visitors
=
(1,500 Student tours + 750 Donor tours)
=
2,250 visitors
Tours
=
(75 Student tours + 90 Donor tours)
=
165 tours
Coordinator volume
=
(1 student coordinator + 1 donor coordinator)
=
2 coordinators.
Cost driver rates:
=
(Activity cost ÷ Cost driver volume)
Refreshments, etc.
=
=
$12.00 per visitor
Tour guides
=
=
$95.00 per tour
c.
1. Visitors ……………
D. Volume-related
2. Tours ………………
C. Batch-related
3. Coordinators …….
A. Product-related
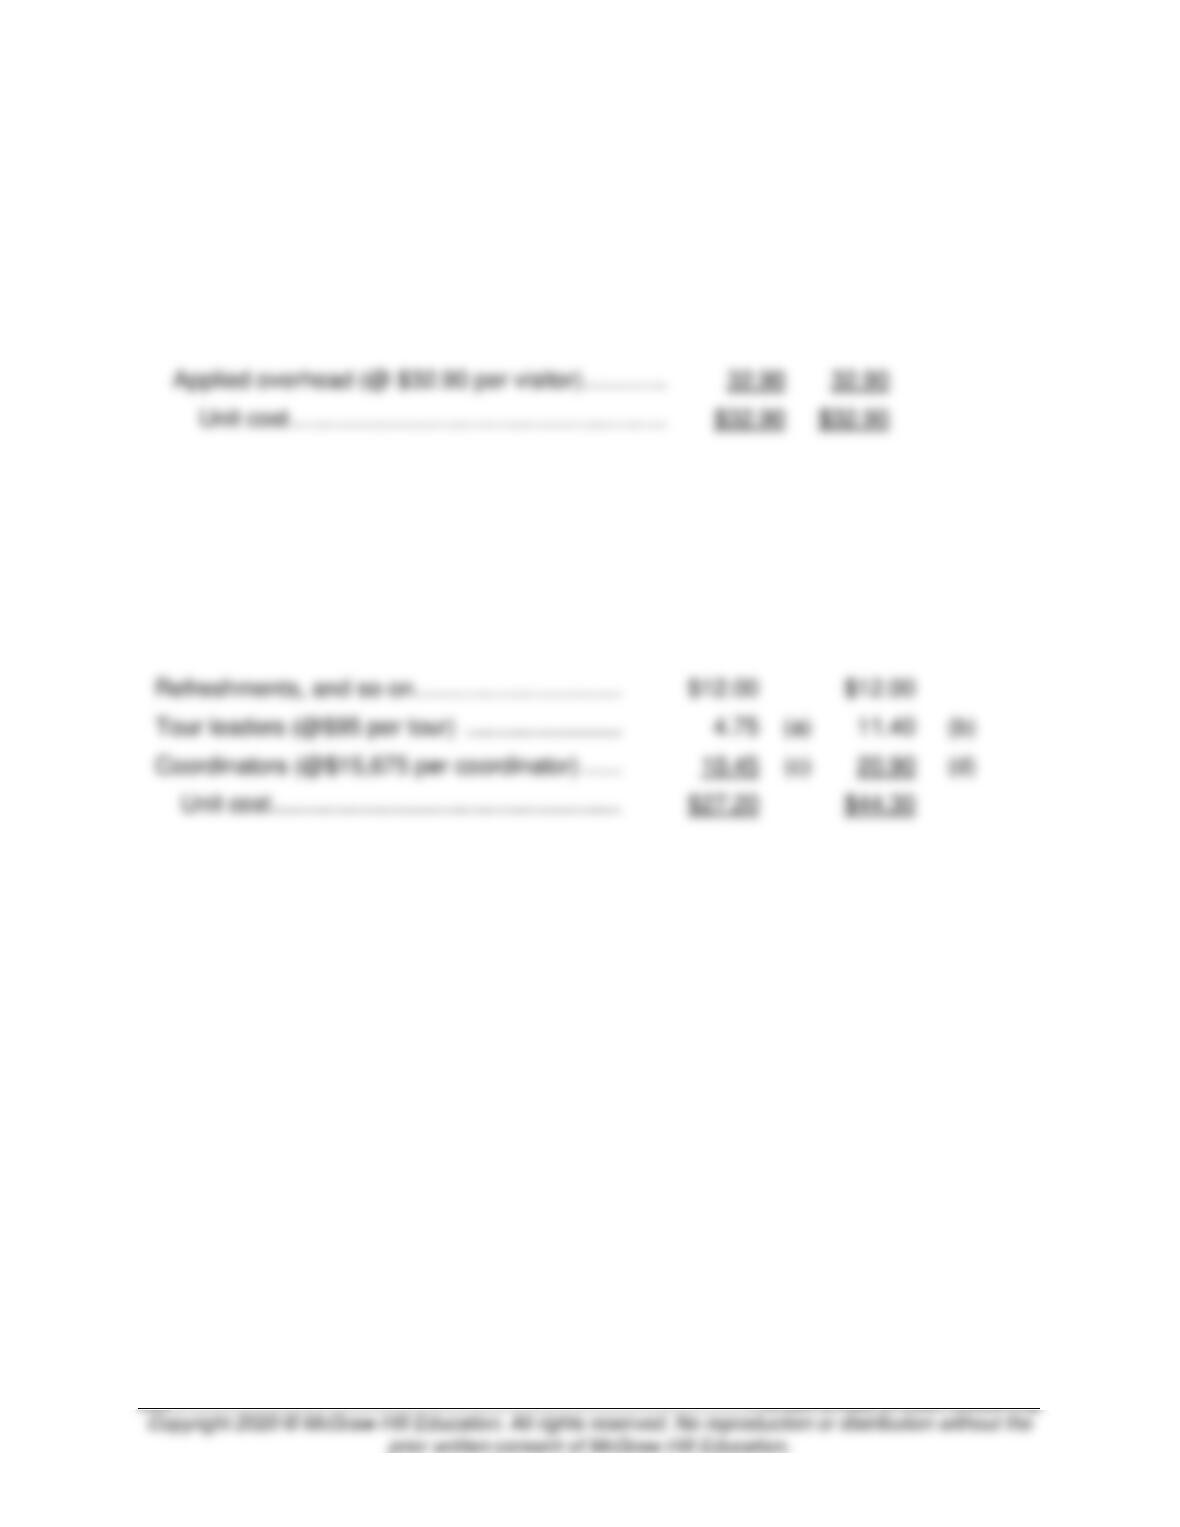
9-41. (15 min.) Activity-Based Costing: The City Museum.
a. $32.90 per visitor for Student Tours, $32.90 per visitor for Donor Tours.
Student
Donor
Visitors
1
1
Applied overhead (@ $32.90 per visitor) ………….
32.90
32.90
b.
Students
Donors
Visitors
1
1
Tours ……………………………………………………..
75
90
Coordinators ……………………………………………
1
1
Refreshments, and so on …………………………..
Tour leaders (@$95 per tour) ……………………
11.40
Coordinators (@$15,675 per coordinator) ……
20.90
Notes: (a) $4.75 = (75 tours $95 per tour) ÷ 1,500 visitors.
(b) $11.40 = (90 tours $95 per tour) ÷ 750 visitors.
(c) $10.45 = (1 coordinator $15,675 per coordinator) ÷ 1,500 visitors.
(d) $20.90 = (1 coordinator $15,675 per coordinator) ÷ 750 visitors.
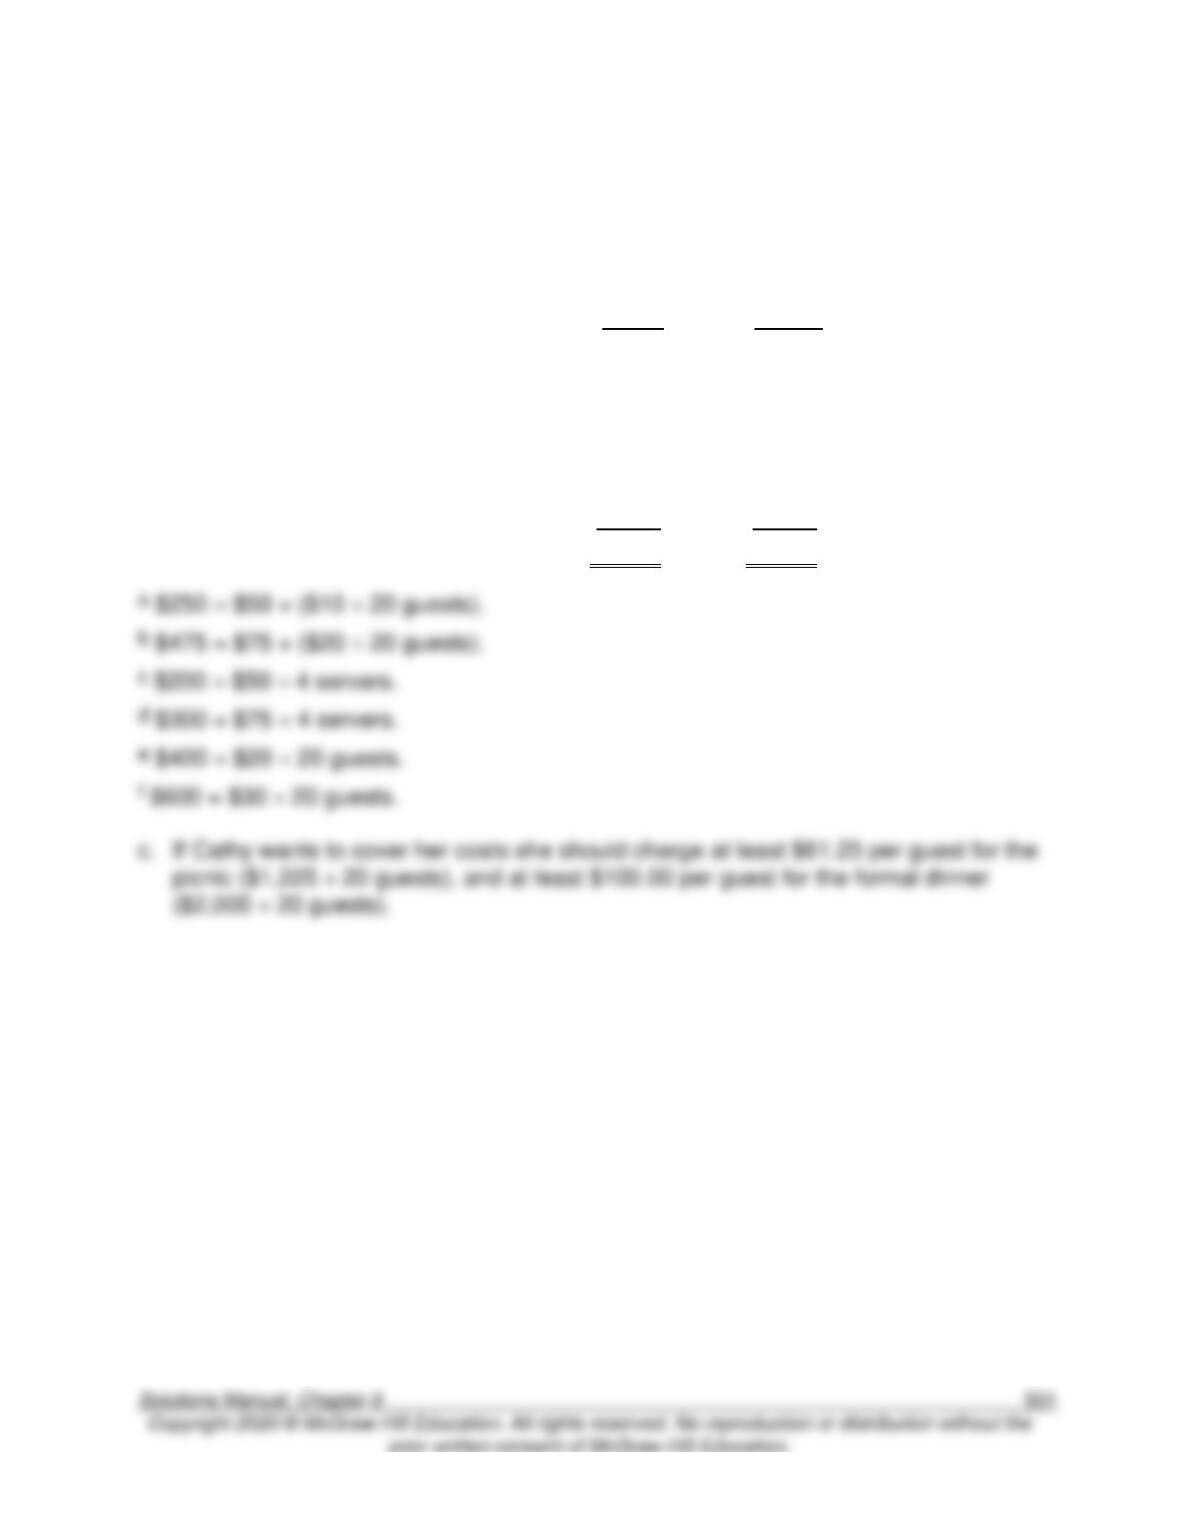
9-42. (30 min.) Activity-Based Costing in a Nonmanufacturing Environment:
Cathy’s Catering.
a. & b.
Activities
a.
Afternoon
Picnic
b.
Formal
Dinner
Advertising (parties) ………………………….
$ 100
$ 100
Planning (parties) ……………………………..
75
125
Equipment rental (parties, guests) ………
250
a
475
b
Insurance (parties) …………………………...
200
400
Server cost (parties) ………………………….
200
c
300
d
Food (guests) …………………………………..
400
e
600
f
Total ………………………………………………….
$1,225
$2,000
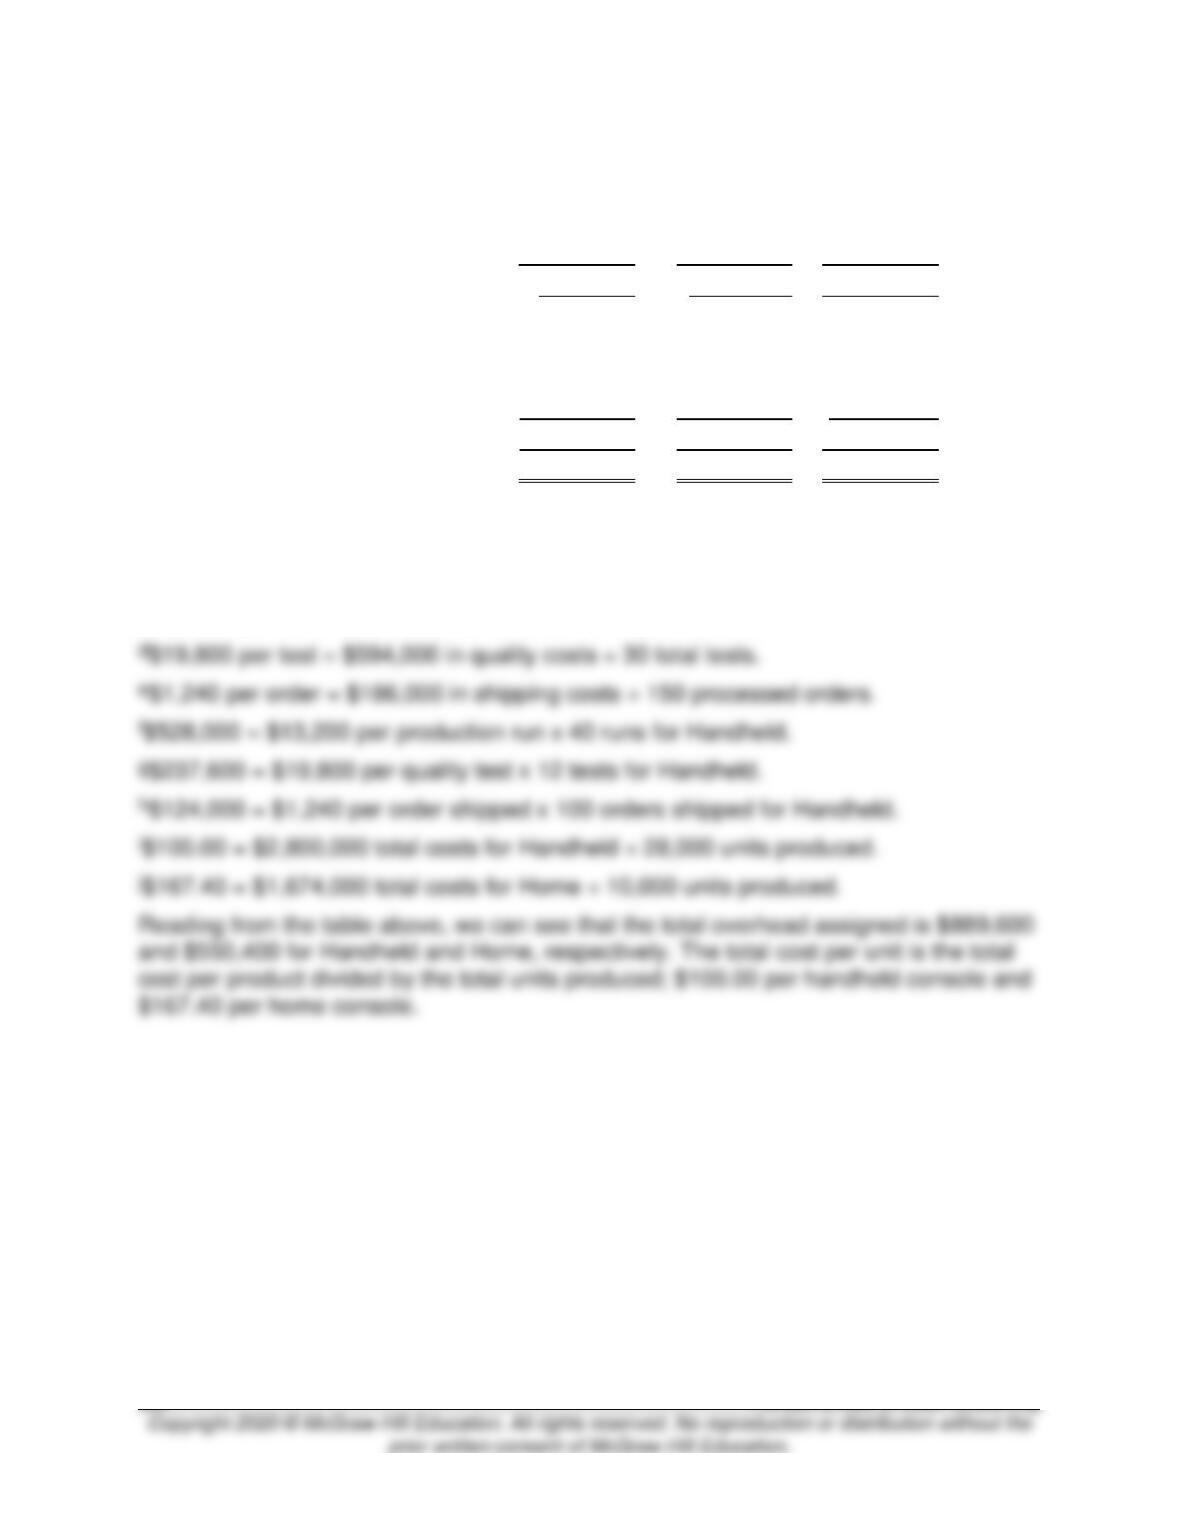
9-43. (35 min.) Activity-Based versus Traditional Costing: Maglie Company.
a.
Rate
Handheld
Home
Total
Direct labora ………..
$1,160,400
$ 439,600
$1,600,000
Direct materialsb ….
$750,000
$ 684,000
$1,434,000
Overhead costs
Prod. runs ………..
$13,200
c
$ 528,000
f
$ 132,000
$ 660,000
Quality tests ……..
19,800
d
237,600
g
356,400
594,000
Ship. orders ……..
1,2400
e
124,000
h
62,000
186,000
Total overhead …
$ 889,600
$ 550,400
$1,440,000
Total costs …………..
$2,800,000
$1,674,000
$4,474,000
Total unit cost ………
$100.00
i
$167.40
j
aData given in the first table of the exercise in the text.
bData given in the first table of the exercise in the text.
c$13,200 per run = $660,000 in production run costs ÷ 50 total runs.