E9-2 Prepare a sales budget for 2 quarters
Edington Electronics Inc. produces and sells two models of pocket calculators, XQ-103 and XQ-104.
The calculators sell for $15 and $25 respectively. Because of the intense competition Edington faces,
management budgets sales semiannually. The projections for the first 2 quarters of 2017 are as follows.
Product Quarter 1 Quarter 2
XQ-103 20,000 22,000
XQ-104 12,000 15,000
No changes in selling prices are anticipated.
Instructions
Prepare a sales budget for the 2 quarters ending June 30, 2017. List the products and show for each
quarter and for the 6 months, units, selling price, and total sales by product and in total.
NOTE: Enter a number in cells requesting a value; enter either a number or a formula in cells with a “?” .
Selling Total Selling Total Selling Total
Product Units Price Sales Units Price Sales Units Price Sales
XQ-103 Value $15 ? Value $15 ? ? $15 ?
XQ-104 Value 25 ? Value 25 ? ? 25 ?
Totals ? ? ? ? ? ?
After you have completed E9-2 consider the following additional question.
1. Assume that the number of XQ-103 units sold in Quarter 2 and XQ-104 in Quarter 1
changed to 30,000 and 17,000 respectively. Revise the flexible budget report for
the two quarters ending June 30, 2017.
Unit Sales
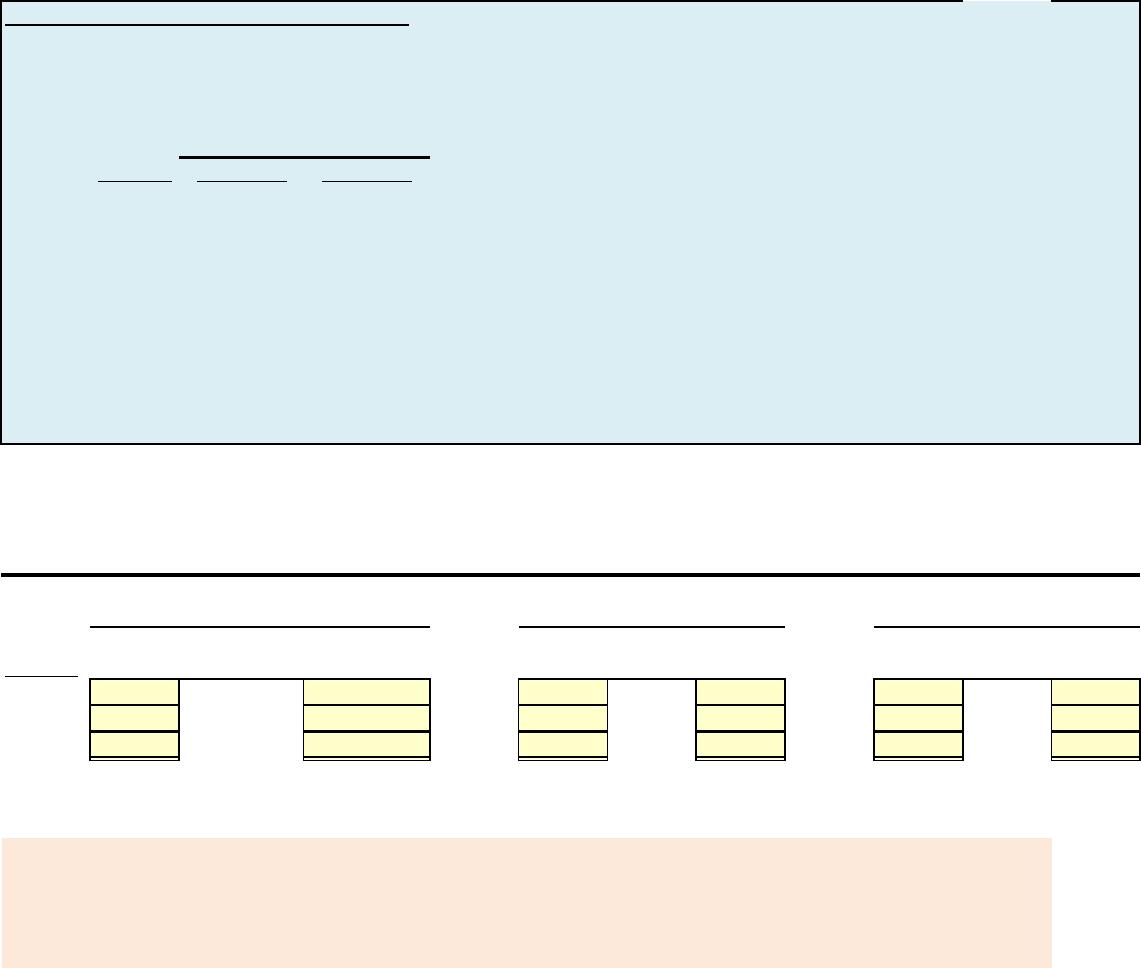
EDINGTON ELECTRONICS INC.
Sales Budget
For the Six Months Ending June 30, 2017
Quarter 1
Quarter 2
Six Months

E9-2 Solution
Selling Total Selling Total Selling Total
Product Units Price Sales Units Price Sales Units Price Sales
XQ-103 20,000 $15 $300,000 22,000 $15 $330,000 42,000 $15 $630,000
EDINGTON ELECTRONICS INC.
Sales Budget
For the Six Months Ending June 30, 2017
Quarter 1
Quarter 2
Six Months
E9-2 Solution to additional question
1. Assume that the number of XQ-103 units sold in Quarter 2 and XQ-104 in Quarter 1
changed to 30,000 and 17,000 respectively. Revise the flexible budget report for
the two quarters ending June 30, 2017.
Selling Total Selling Total Selling Total
Product Units Price Sales Units Price Sales Units Price Sales
EDINGTON ELECTRONICS INC.
Sales Budget
For the Six Months Ending June 30, 2017
Quarter 1
Quarter 2
Six Months
E9-4 Prepare quarterly production budgets
Turney Company produces and sells automobile batteries, the heavy-duty HD-240.
The 2017 sales forecast is as follows.
Quarter HD-240
1 5,000
2 7,000
3 8,000
4 10,000
The January 1, 2017, inventory of HD-240 is 2,000 units. Management desires an ending
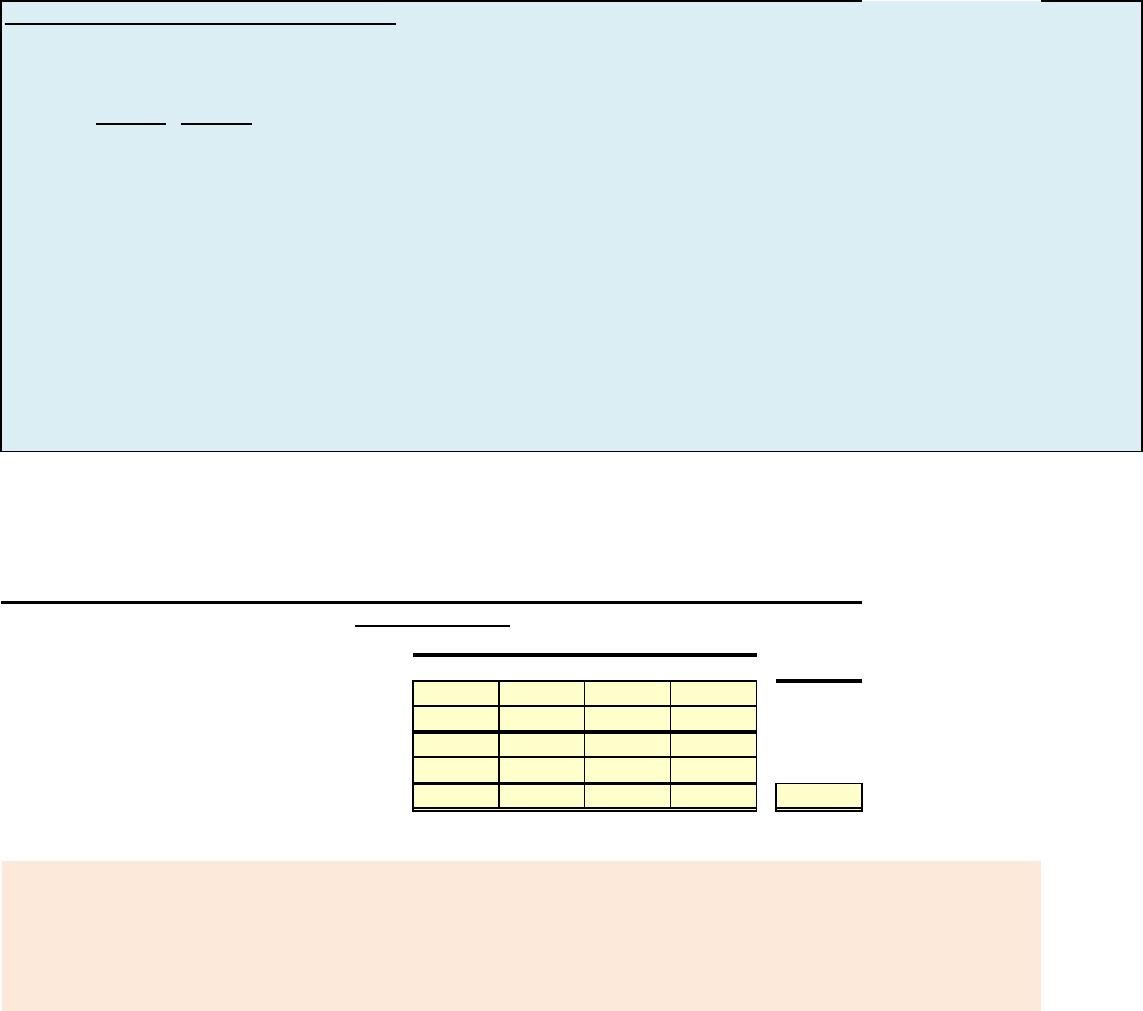
inventory each quarter equal to 40% of the next quarter’s sales. Sales in the first quarter of
2018 are expected to be 25% higher than sales in the same quarter in 2017.
Instructions
Prepare quarterly production budgets for each quarter and in total for 2017.
NOTE: Enter a number in cells requesting a value; enter either a number or a formula in cells with a “?” .
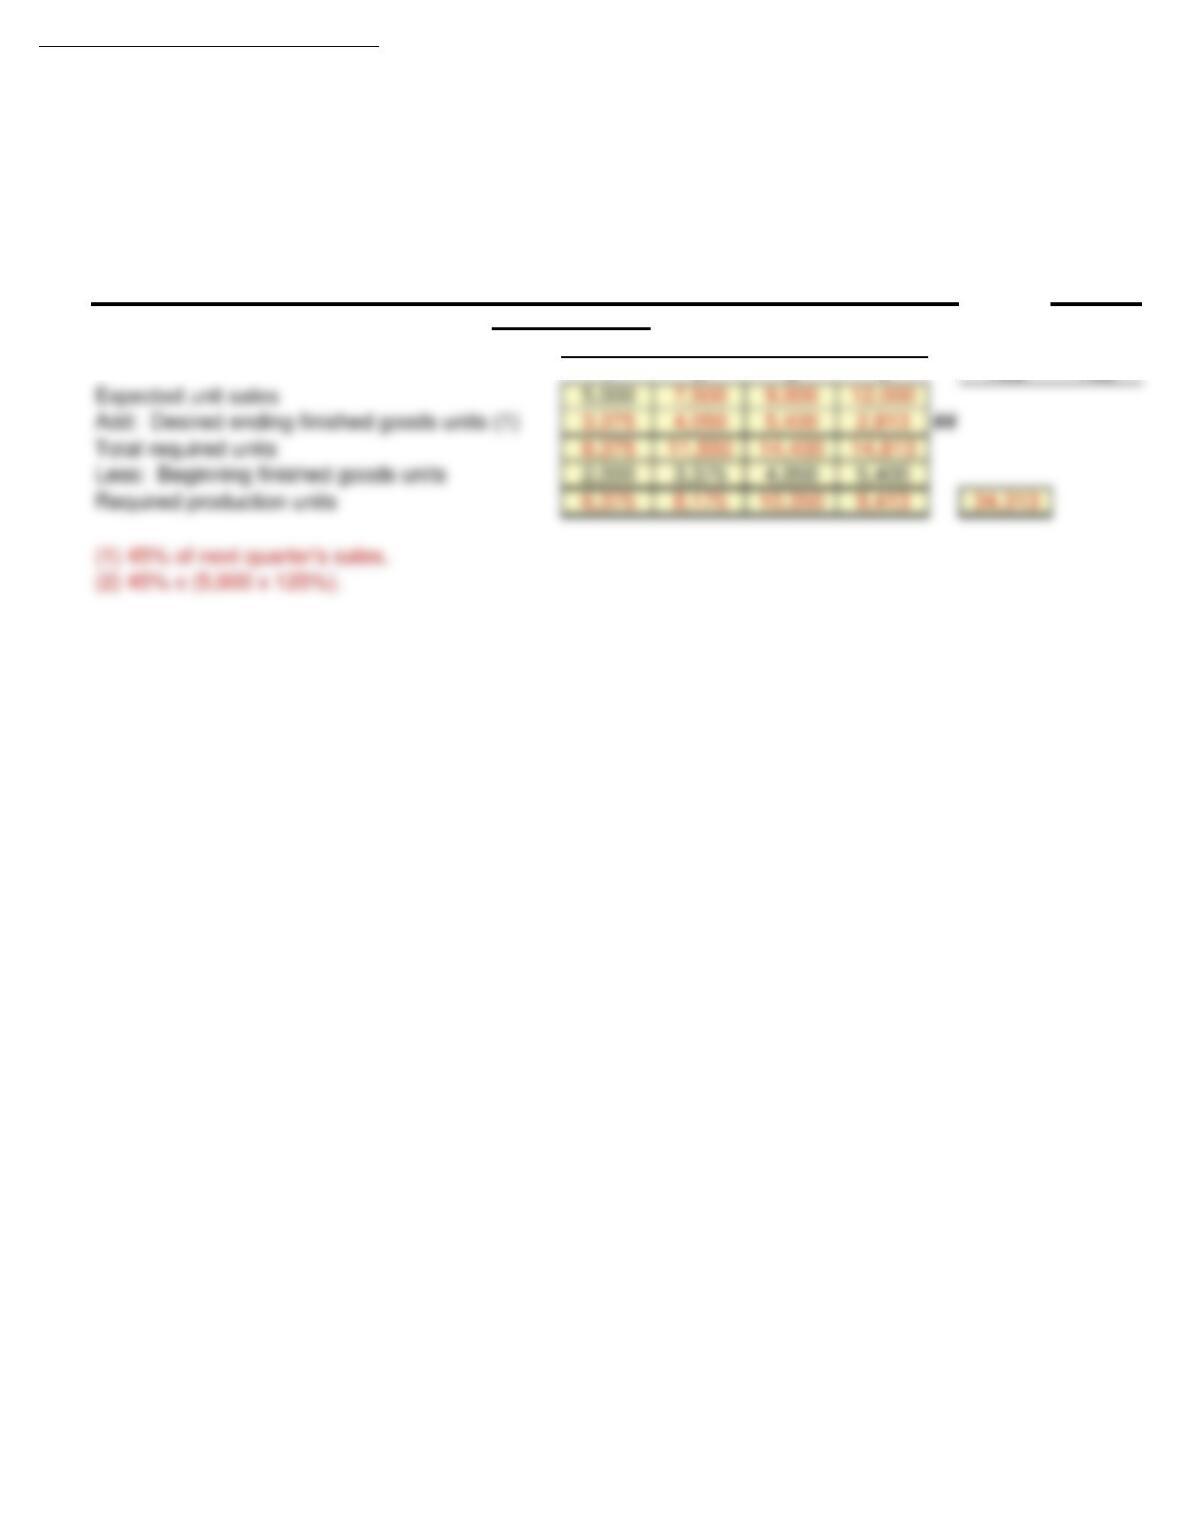
1 2 3 4 Year
Expected unit sales Value Value Value Value
Add: Desired ending finished goods units ? ? ? ?
Total required units ? ? ? ?
Less: Beginning finished goods units Value Value Value Value
Required production units ? ? ? ? ?
After you have completed E9-4 consider the following additional question.
1. Assume that sales for quarter 2, 3, and 4 changed to 7,500, 9,000 and 12,000 units. In addition,
the desired ending inventory each quarter changed to 45% of the next quarter sales. Revise
the quarterly production budgets for each quarter and in total for 2017.
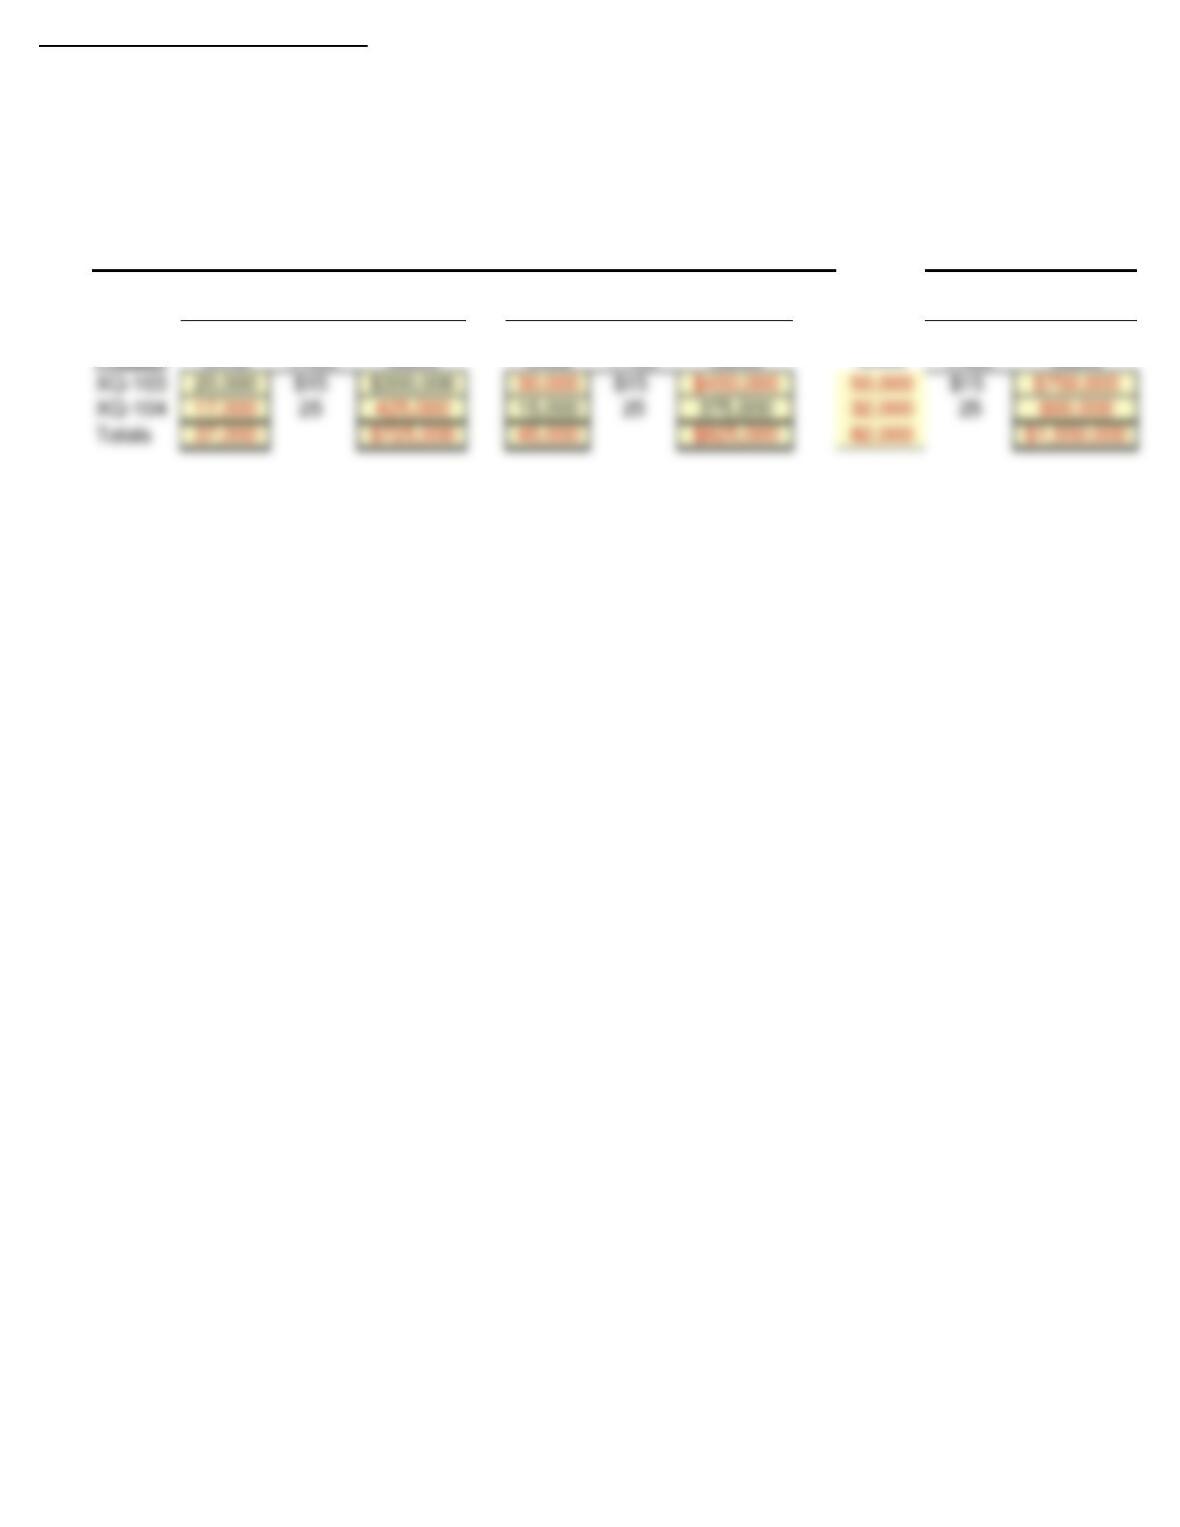
TURNEY COMPANY
Production Budget
For the Year Ending December 31, 2017
Product HD-240
Quarter
E9-4 Solution
1 2 3 4 Year Year
Expected unit sales 5,000 7,000 8,000 10,000
For the Year Ending December 31, 2017
Product HD-240
TURNEY COMPANY
Production Budget
Quarter
E9-4 Solution to additional question
1. Assume that sales for quarter 2, 3, and 4 changed to 7,500, 9,000 and 12,000 units. In addition,
the desired ending inventory each quarter changed to 45% of the next quarter sales. Revise
the quarterly production budgets for each quarter and in total for 2017.
1 2 3 4 Year Year
TURNEY COMPANY
Production Budget
For they ear Ending December 31, 2017
Product HD-240
Quarter
E9-11 prepare a manufacturing overhead budget for the year
Atlanta Company is preparing its manufacturing overhead budget for 2017. Relevant data
consist of the following.
Units to be produced (by quarters): 10,000, 12,000, 14,000, 16,000.
Direct labor: time is 1.5 hour per unit.
Variable overhead costs per direct labor hour: indirect materials $0.80; indirect labor
$1.20; and maintenance $0.50.
Fixed overhead costs per quarter: supervisory salaries $35,000; depreciation $15,000;
and maintenance $12,000.
Instructions
Prepare the manufacturing overhead budget for the year; showing quarterly data.
NOTE: Enter a number in cells requesting a value; enter either a number or a formula in cells with a “?” .
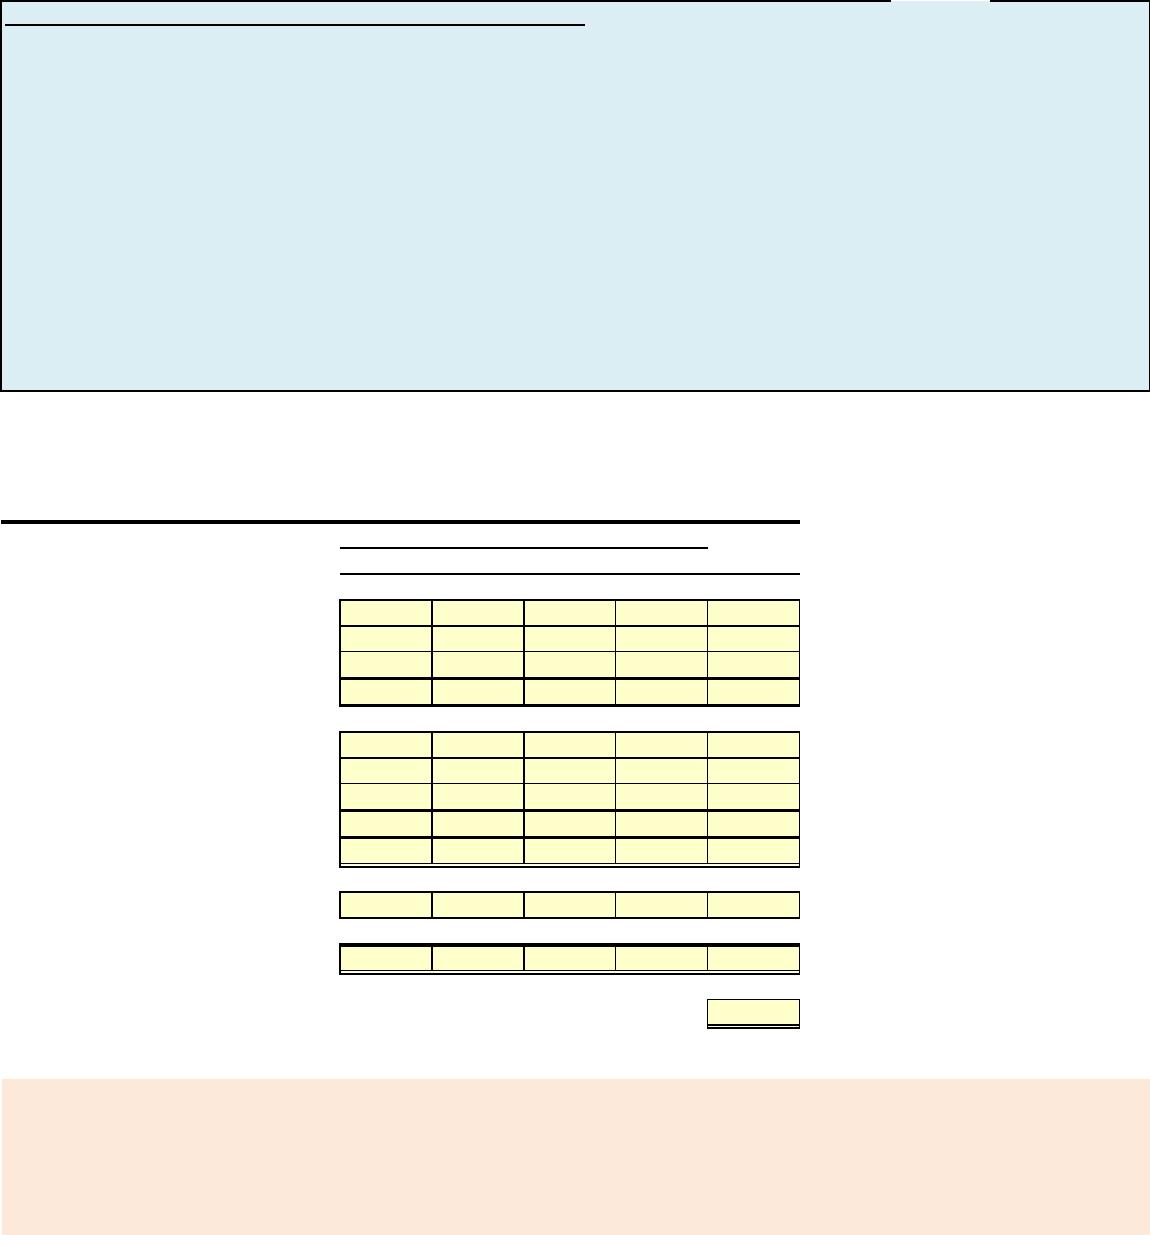
1 2 3 4 Year
Variable costs
Indirect materials ($0.80/hour) ? ? ? ? ?
Indirect labor ($1.20/hour) ? ? ? ? ?
Maintenance ($0.50/hour) ? ? ? ? ?
Total variable ? ? ? ? ?
Fixed costs
Supervisory salaries Value Value Value Value ?
Depreciation Value Value Value Value ?
Maintenance Value Value Value Value ?
Total fixed ? ? ? ? ?
Total manufacturing overhead ? ? ? ? ?
Units to be produced Value Value Value Value ?
Direct labor hours per unit 1.5 1.5 1.5 1.5 1.5
Total direct labor hours ? ? ? ? ?
Manufacturing overhead rate per direct labor hour ?
After you have completed E9-11 consider the following additional question.
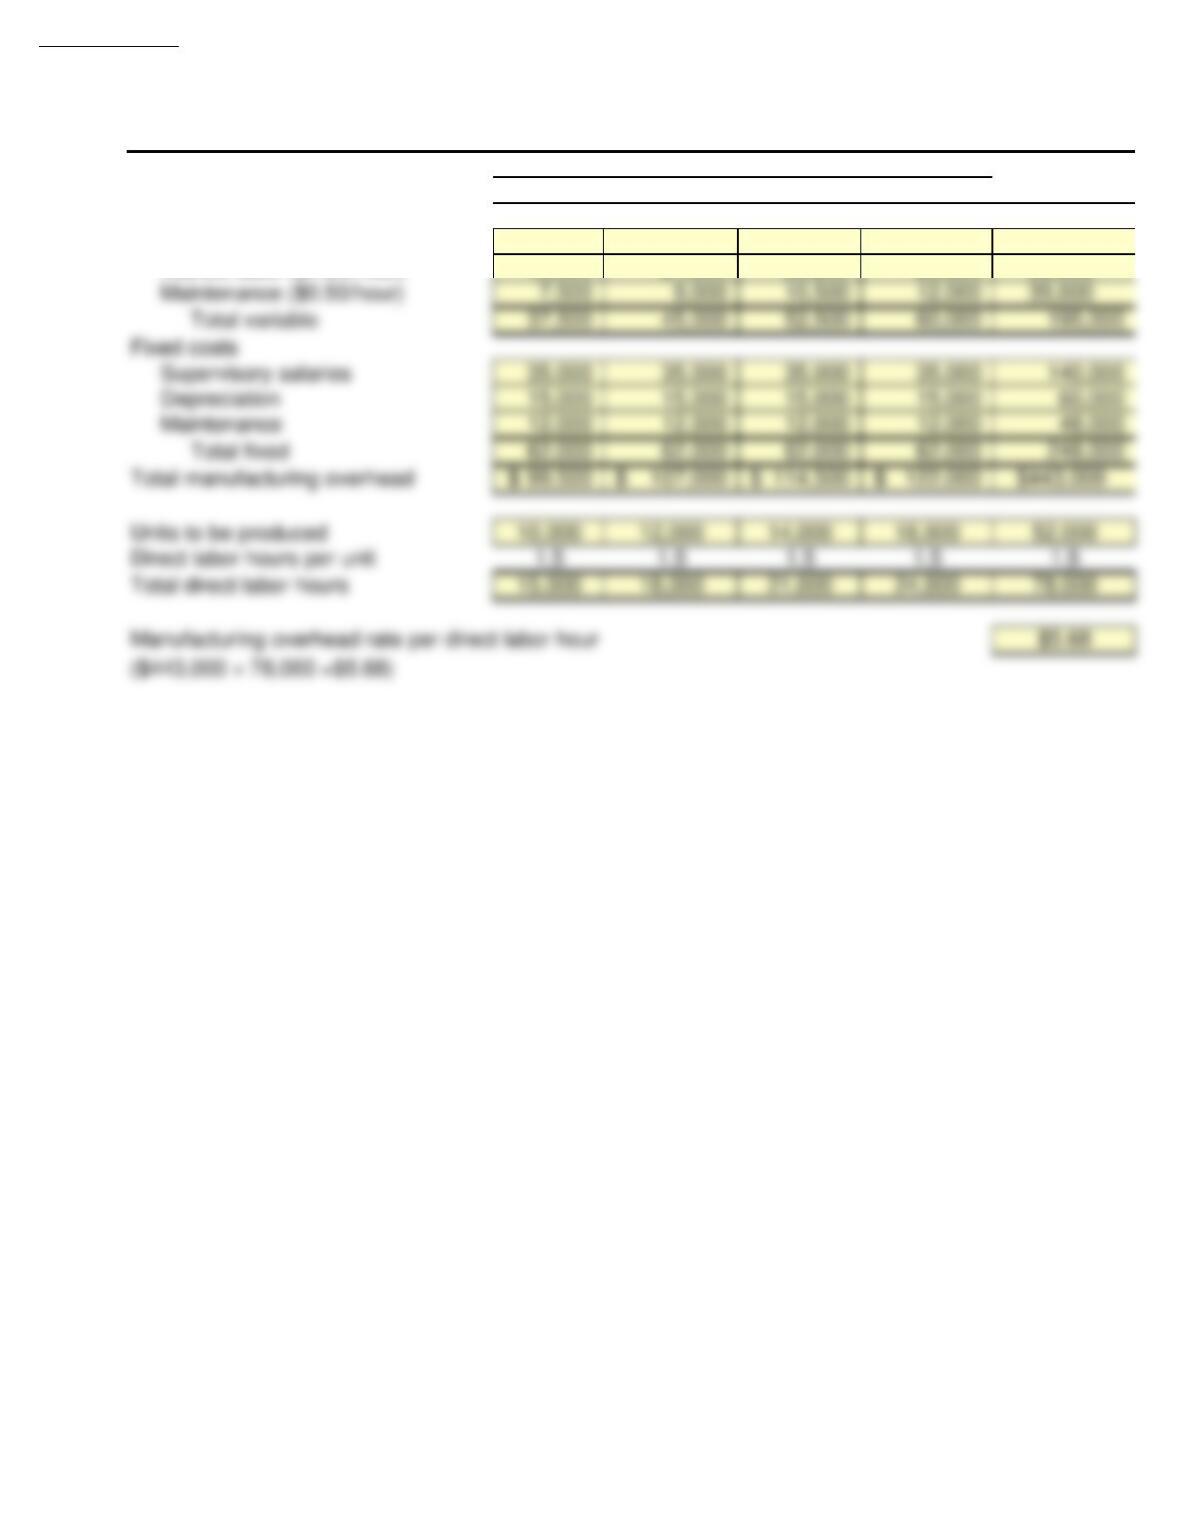
1 Assume that the direct labor required per unit changed to 1.75 hour per unit and the variable
overhead costs for indirect labor changed to $1.10. Revise the Manufacturing Overhead Budget
to reflect these changes.
ATLANTA COMPANY
Manufacturing Overhead Budget
For the Year Ending December 31, 2017
Quarter
E9-11 Solution
1 2 3 4 Year
Variable costs
Indirect materials ($0.80/hour) 12,000$ 14,400$ 16,800$ 19,200$ 62,400$
Indirect labor ($1.20/hour) 18,000 21,600 25,200 28,800 93,600
ATLANTA COMPANY
Manufacturing Overhead Budget
For the Year Ending December 31, 2017
Quarter
E9-11 Solution to additional question
1 Assume that the direct labor required per unit changed to 1.75 hour per unit and the variable
overhead costs for indirect labor changed to $1.10. Revise the Manufacturing Overhead Budget
to reflect these changes.
1 2 3 4 Year
Variable costs
Indirect materials ($0.80/hour) 14,000$ 16,800$ 19,600$ 22,400$ 72,800$
Fixed costs
Supervisory salaries 35,000 35,000 35,000 35,000 140,000
Depreciation 15,000 15,000 15,000 15,000 60,000
ATLANTA COMPANY
Manufacturing Overhead Budget
For the Year Ending December 31, 2017
Quarter
P9-1A Prepare budgeted income statement and supporting budgets.
Cook Farm Supply Company manufactures and sells a pesticide called Snare. The following
data are available for preparing budgets for Snare for the first 2 quarters of 2017.
1. Sales: quarter 1, 40,000 bags; quarter 2, 56,000 bags. Selling price is $60 per bag.
2. Direct materials: each bag of Snare requires 4 pounds of Gumm at a cost of $3.80 per
pound and 6 pounds of Tarr at $1.50 per pound.
3. Desired inventory levels:
Type of Inventory January 1 April 1 July 1
Snare (bags) 8,000 15,000 18,000
Gumm (pounds) 9,000 10,000 13,000
Tarr (pounds) 14,000 20,000 25,000
4. Direct labor: direct labor time is 15 minutes per bag at an hourly rate of $16 per hour.
5. Selling and administrative expenses are expected to be 15% of sales plus $175,000 per quarter.
6. Interest Expense is $100,000.
7. Income taxes are expected to be 30% of income before income taxes.
Your assistant has prepared two budgets: (1) The manufacturing overhead budget shows expected
costs to be 125% of direct labor cost, and (2) The direct materials budget for Tarr shows the cost of Tarr
purchases to be $297,000 in quarter 1 and $439,500 in quarter 2.
Instructions
Prepare the budgeted multi-step income statement for the first 6 months and all required operating budgets by
quarters. (Note: Use variable and fixed in the selling and administrative expense budget.) Do not
prepare the manufacturing overhead budget or the direct materials budget for Tarr.
NOTE: Enter a number in cells requesting a value; enter either a number or a formula in cells with a “?” .
Six
1 2 Months
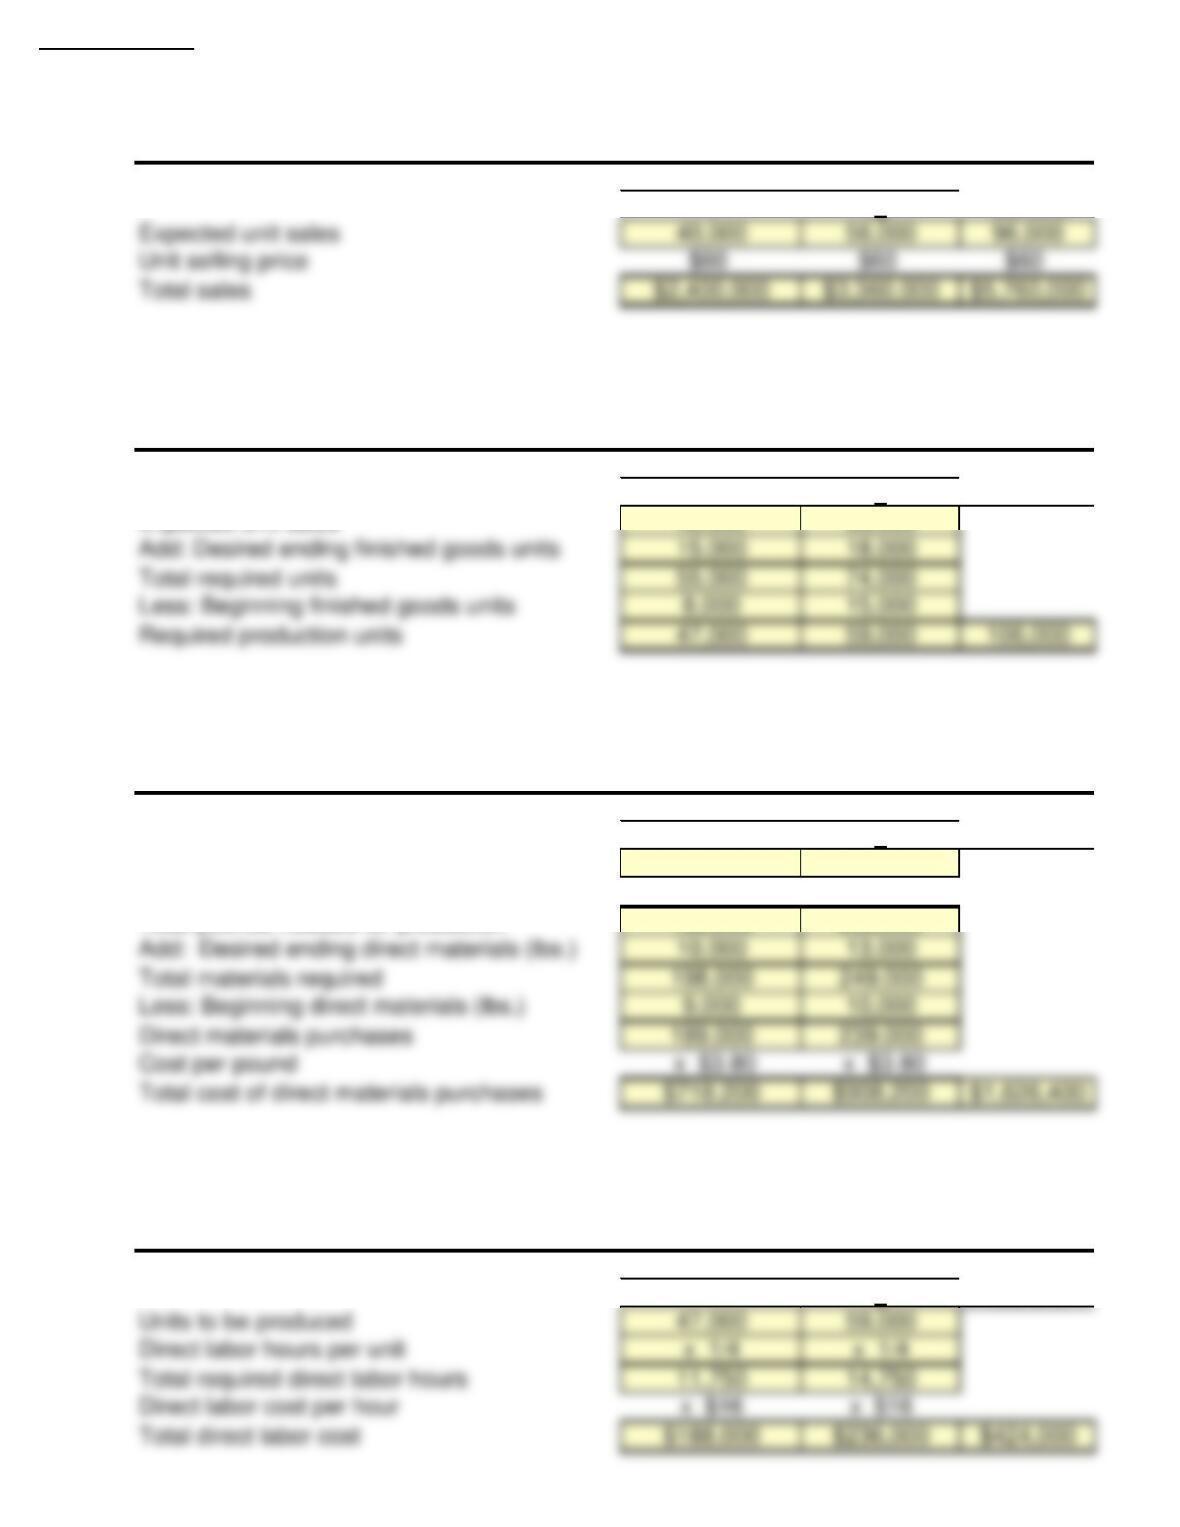
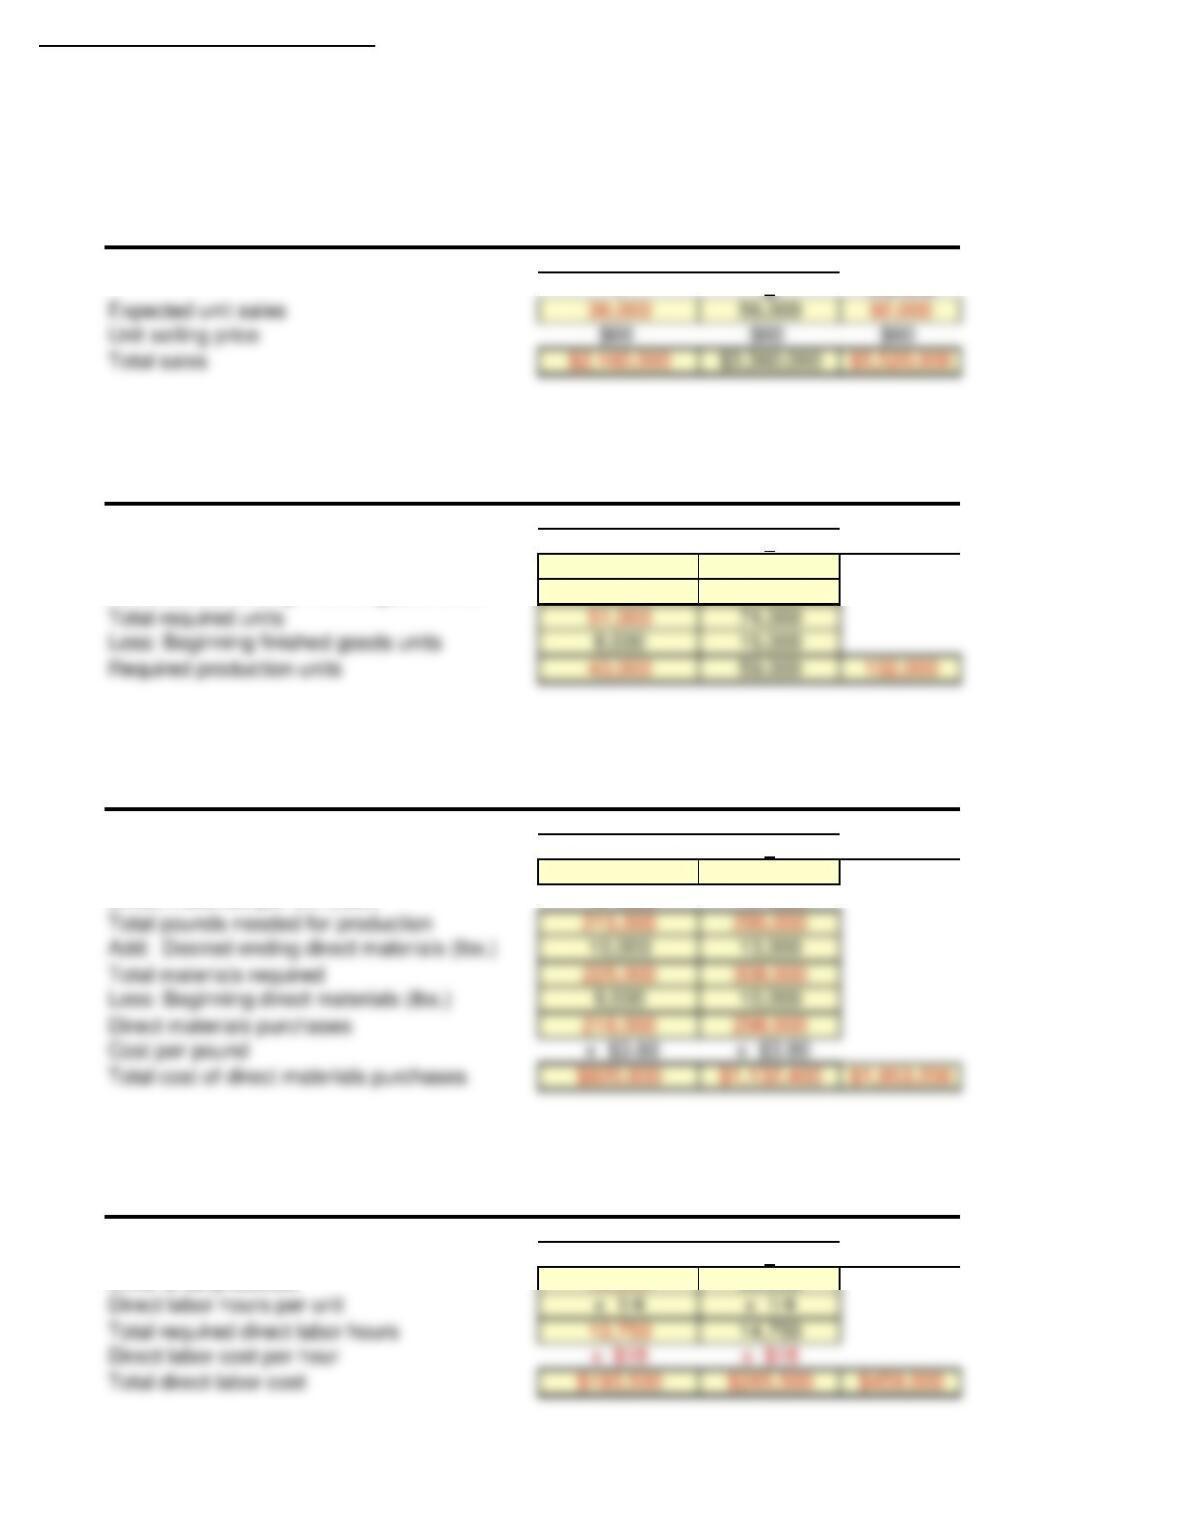
Expected unit sales Value Value ?
Unit selling price $60 $60 $60
Total sales ? ? ?
Six
1 2 Months
Expected unit sales Value Value
Add: Desired ending finished goods units Value Value
Total required units ? ?
Less: Beginning finished goods units Value Value
Required production units ? ? ?
Six
1 2 Months
Units to be produced Value Value
Direct materials per unit (lbs.) X 4lbs X 4lbs
Total pounds needed for production ? ?
Add: Desired ending direct materials (lbs.) Value Value
Total materials required ? ?
Less: Beginning direct materials (lbs.) Value Value
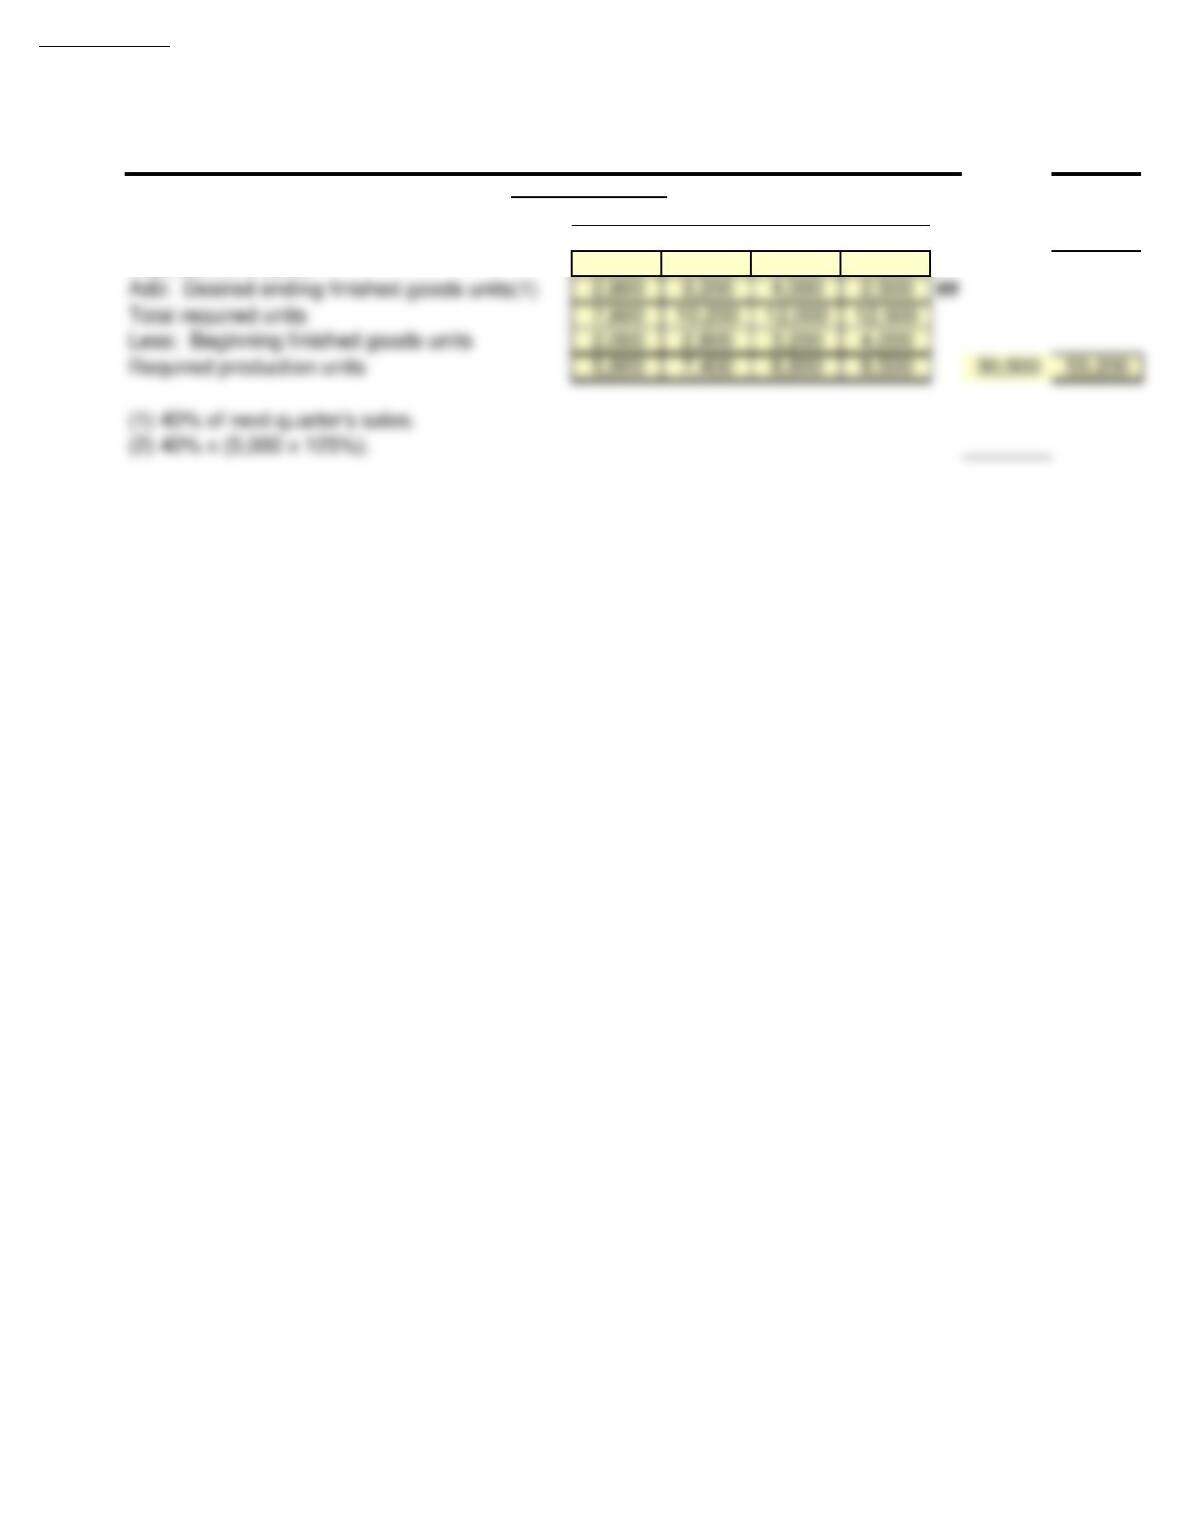
Production Budget
COOK FARM SUPPLY COMPANY
Sales Budget
For the Six Months Ending June 30, 2017
Quarter
COOK FARM SUPPLY COMPANY
For the Six Months Ending June 30, 2017
Quarter
COOK FARM SUPPLY COMPANY
Direct Materials Budget – Gumm
For the Six Months Ending June 30, 2017
Quarter
Direct materials purchases ? ?
Cost per pound X $3.80 X $3.80
Total cost of direct materials purchases ? ? ?
Six
1 2 Months
Units to be produced Value Value
Direct labor hours per unit X 1/4 X 1/4
Total required direct labor hours ? ?
Direct labor cost per hour X $16 X $16
Total direct labor cost ? ? ?
Six
1 2 Months
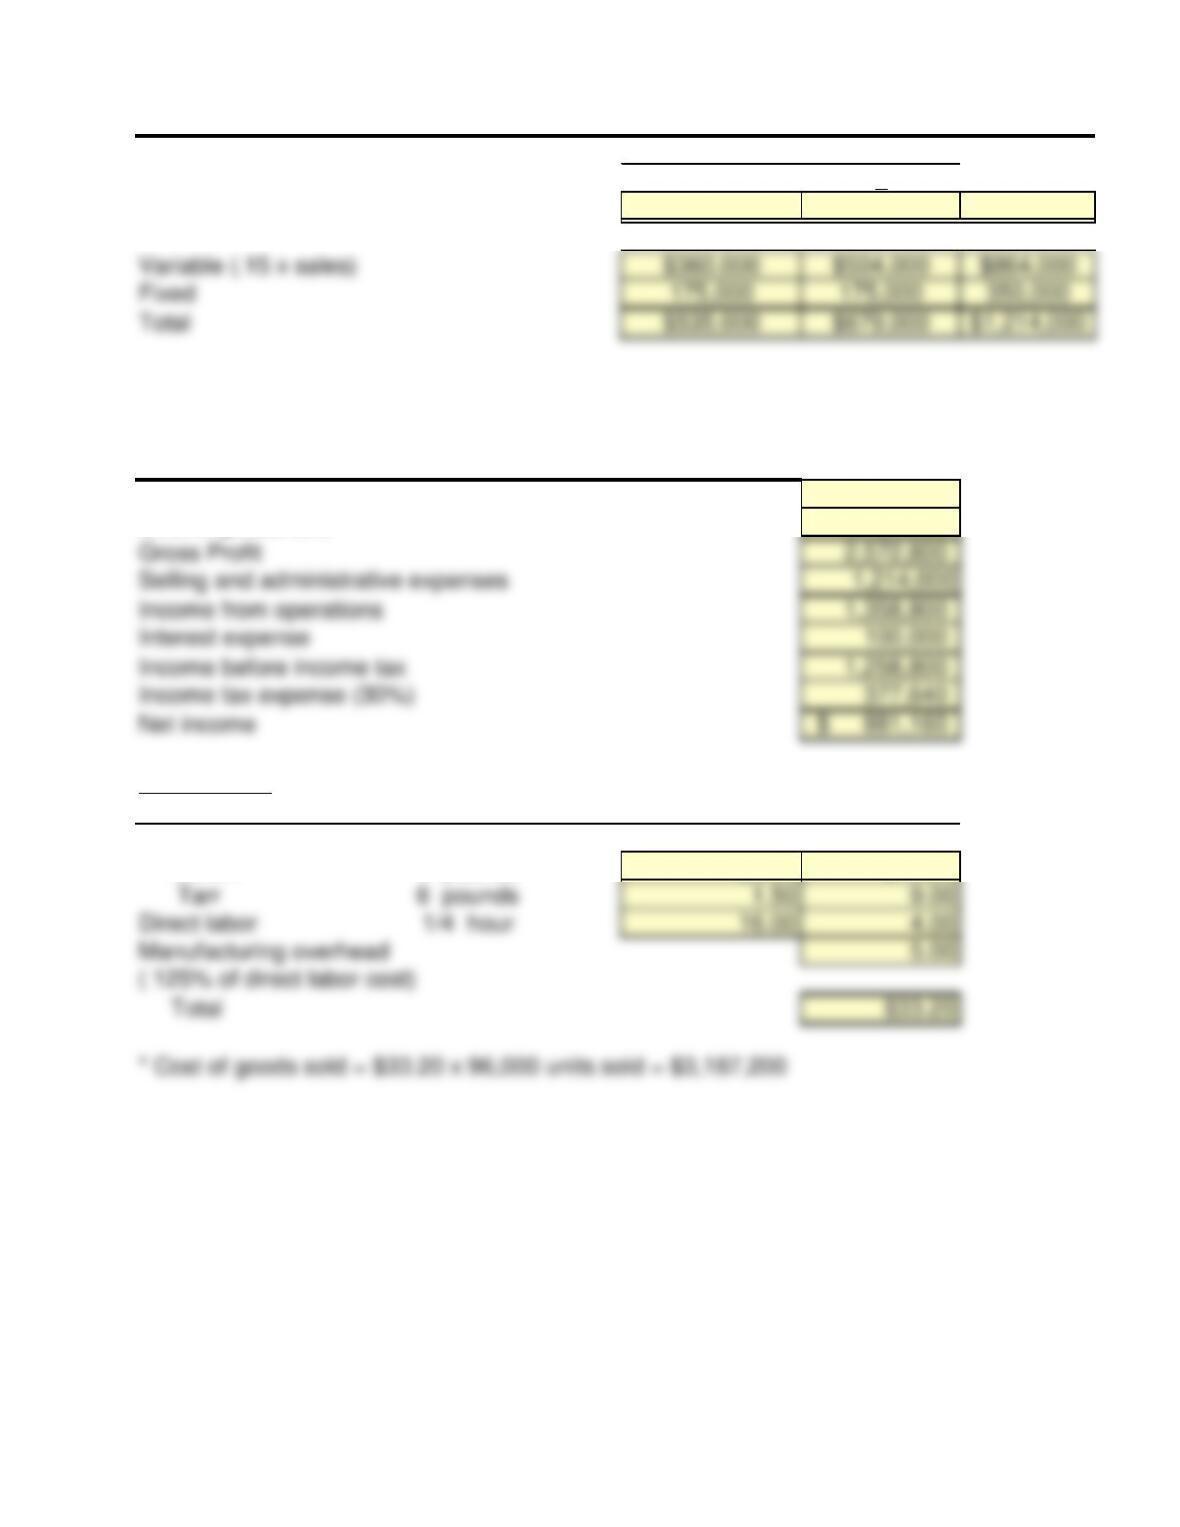
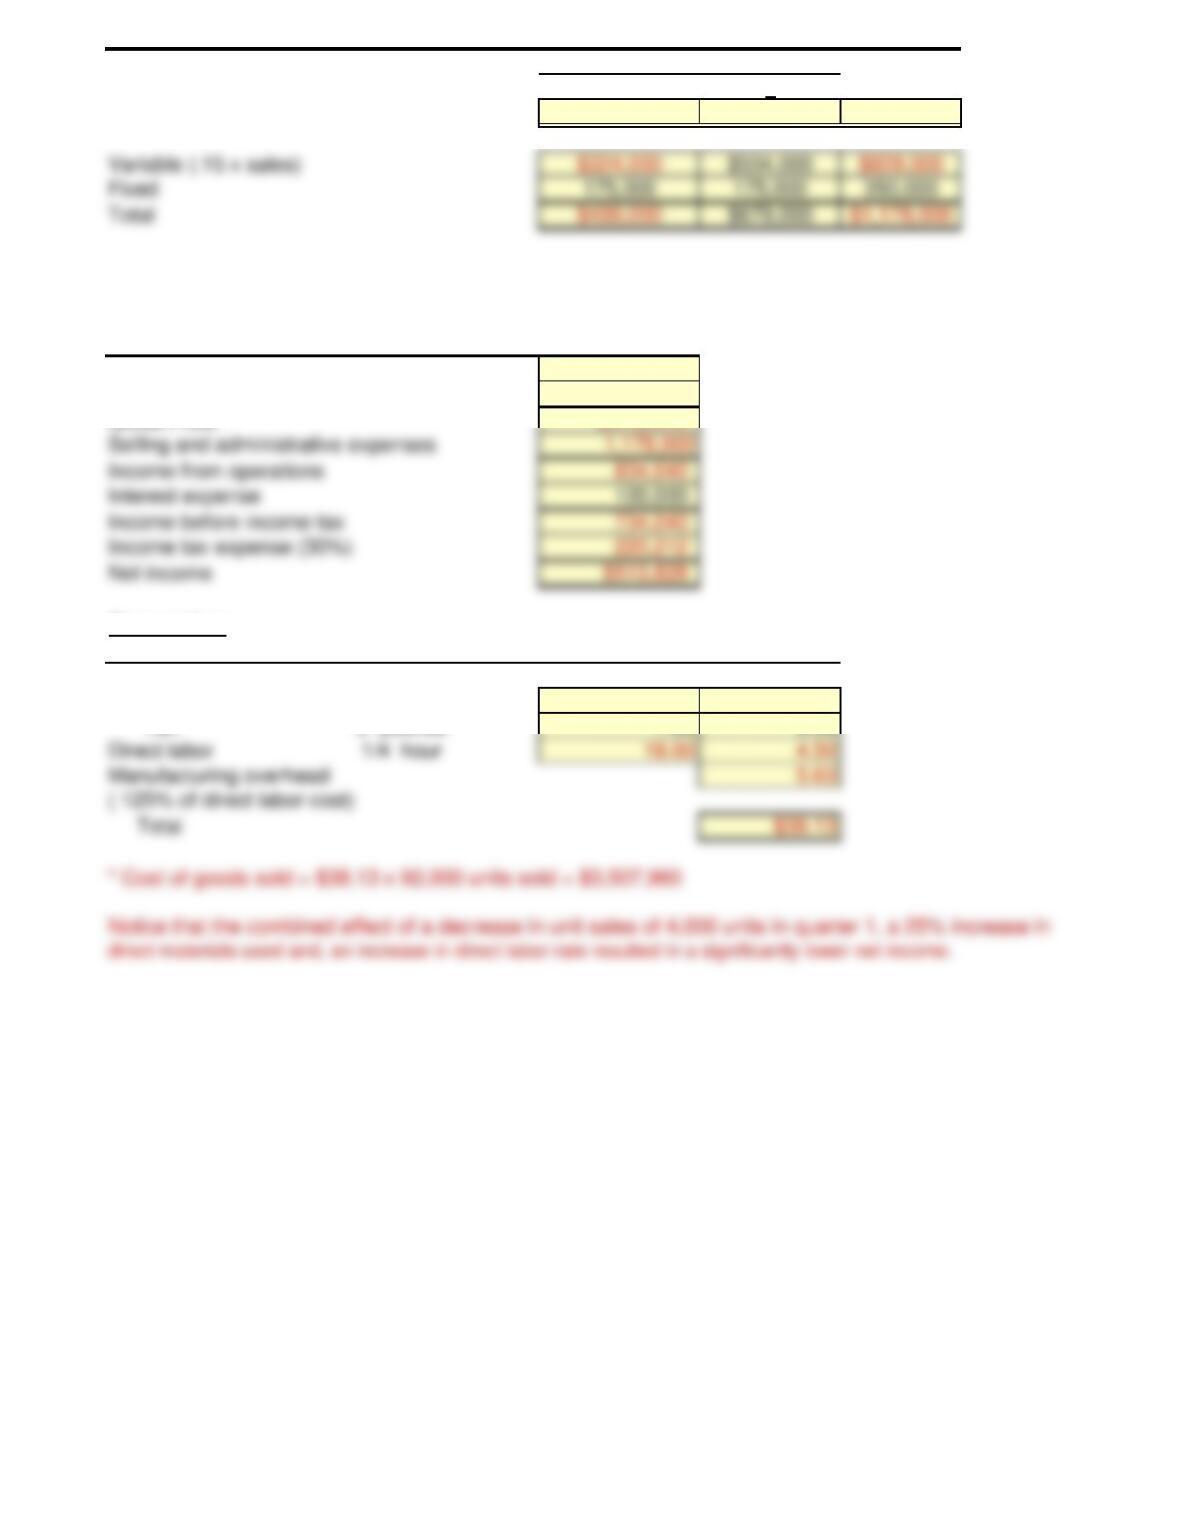
Budgeted sales in units Value Value ?
Variable (.15 x sales) Value Value ?
Fixed Value Value ?
Total ? ? ?
Sales revenue ?
Cost of goods sold ?
Gross Profit ?
Selling and administrative expenses Value
Income from operations ?
Interest expense Value
Income before income tax ?
Income tax expense (30%) ?
Net income ?
Cost per Bag
Cost Element Quantity Unit Cost Total
Direct Materials
Gumm 4 pounds Value ?
Tarr 6 pounds Value ?
Direct Labor 1/4 hour Value ?
Manufacturing overhead ?
(125% of direct labor cost)
Total ?
After you have completed P9-1A consider the following additional question.
1. Assume that the expected unit sales in Quarter 1 changed to 36,000 bags of Snare. Also assume that
the amount of direct material (Gumm) used changed to 5 pounds per bag; and, that the direct labor rate
changed to $18 per hour. Revise the budgets and budgeted income statement to reflect these changes.
Selling and Administrative Budget
COOK FARM SUPPLY COMPANY
Direct Labor Budget
For the Six Months Ending June 30, 2017
Quarter
COOK FARM SUPPLY COMPANY
For the Six Months Ending June 30, 2017
Quarter
COOK FARM SUPPLY COMPANY
Budgeted Income Statement
For the Six Months Ending June 30, 2017
P9-1A Solution
Six
1 2 Months
Six
1 2 Months
Expected unit sales 40,000 56,000
Six
1 2 Months
Units to be produced 47,000 59,000
Direct materials per unit (lbs.) x 4lbs x 4lbs
Total pounds needed for production 188,000 236,000
Six
1 2 Months
Production Budget
COOK FARM SUPPLY COMPANY
Sales Budget
For the Six Months Ending June 30, 2017
Quarter
COOK FARM SUPPLY COMPANY
For the Six Months Ending June 30, 2017
Quarter
COOK FARM SUPPLY COMPANY
Direct Materials Budget – Gumm
For the Six Months Ending June 30, 2017
Quarter
COOK FARM SUPPLY COMPANY
Direct Labor Budget
For the Six Months Ending June 30, 2017
Quarter
Six
1 2 Months
Budgeted sales in units 40,000 56,000 96,000
Sales revenue $5,760,000
Cost of goods sold * 3,187,200
Cost per bag
Cost element Quantity Unit Cost Total
Direct materials
Gumm 4 pounds $3.80 $15.20
Selling and Administrative Budget
COOK FARM SUPPLY COMPANY
For the Six Months Ending June 30, 2017
Quarter
COOK FARM SUPPLY COMPANY
Budgeted Income Statement
For the Six Months Ending June 30, 2017
P9-1A Solution to additional question
1. Assume that the expected unit sales in Quarter 1 changed to 36,000 bags of Snare. Also assume that
the amount of direct material (Gumm) used changed to 5 pounds per bag; and, that the direct labor rate
changed to $18 per hour. Revise the budgets and budgeted income statement to reflect these changes.
Six
1 2 Months
Six
1 2 Months
Expected unit sales 36,000 56,000
Add: Desired ending finished goods units 15,000 18,000
Six
1 2 Months
Units to be produced 43,000 59,000
Direct materials per unit (lbs.) x 5lbs x 5lbs
Six
1 2 Months
Units to be produced 43,000 59,000
Production Budget
COOK FARM SUPPLY COMPANY
Sales Budget
For the Six Months Ending June 30, 2017
Quarter
COOK FARM SUPPLY COMPANY
Selling and Administrative Budget
For the Six Months Ending June 30, 2017
Quarter
COOK FARM SUPPLY COMPANY
Direct Materials Budget – Gumm
For the Six Months Ending June 30, 2017
Quarter
COOK FARM SUPPLY COMPANY
Direct Labor Budget
For the Six Months Ending June 30, 2017
Quarter
COOK FARM SUPPLY COMPANY
Six
1 2 Months
Budgeted sales in units 36,000 56,000 92,000
Sales revenue $5,520,000
Cost of goods sold * 3,507,960
Cost per bag
Cost element Quantity Unit Cost Total
Direct materials
Gumm 5 pounds $3.80 $19.00
Tarr 6 pounds 1.50 9.00
For the Six Months Ending June 30, 2017
Quarter
COOK FARM SUPPLY COMPANY
Budgeted Income Statement
For the Six Months Ending June 30, 2017
P9-5A Prepare purchases and income statement budgets for a merchandiser
The budget committee of Suppar Company collects the following data for its San Miguel Store in
preparing budgeted income statements for May and June 2017.
1. Sales for May are expected to be $800,000. Sales in June and July are expected to be 5%
higher than the preceding month.
2. Cost of goods sold is expected to be 75% of sales.
3. Company policy is to maintain ending merchandise inventory at 10% of the following
month’s cost of goods sold.
4. Operating expenses are estimated to be:
$35,000 per month
Advertising 6% of monthly sales
2% of monthly sales
5% of monthly sales
$5,000 per month
$800 per month
$600 per month
$500 per month
5. Interest expense is $2,000 per month. Income taxes are estimated to be 30% of income before income
taxes.
Instructions
(a) Prepare the merchandise purchases budget for each month in columnar form.
(b) Prepare budgeted income statements for each month in columnar form. Show in the
statements the details of cost of goods sold.
NOTE: Enter a number in cells requesting a value; enter either a number or a formula in cells with a “?” .
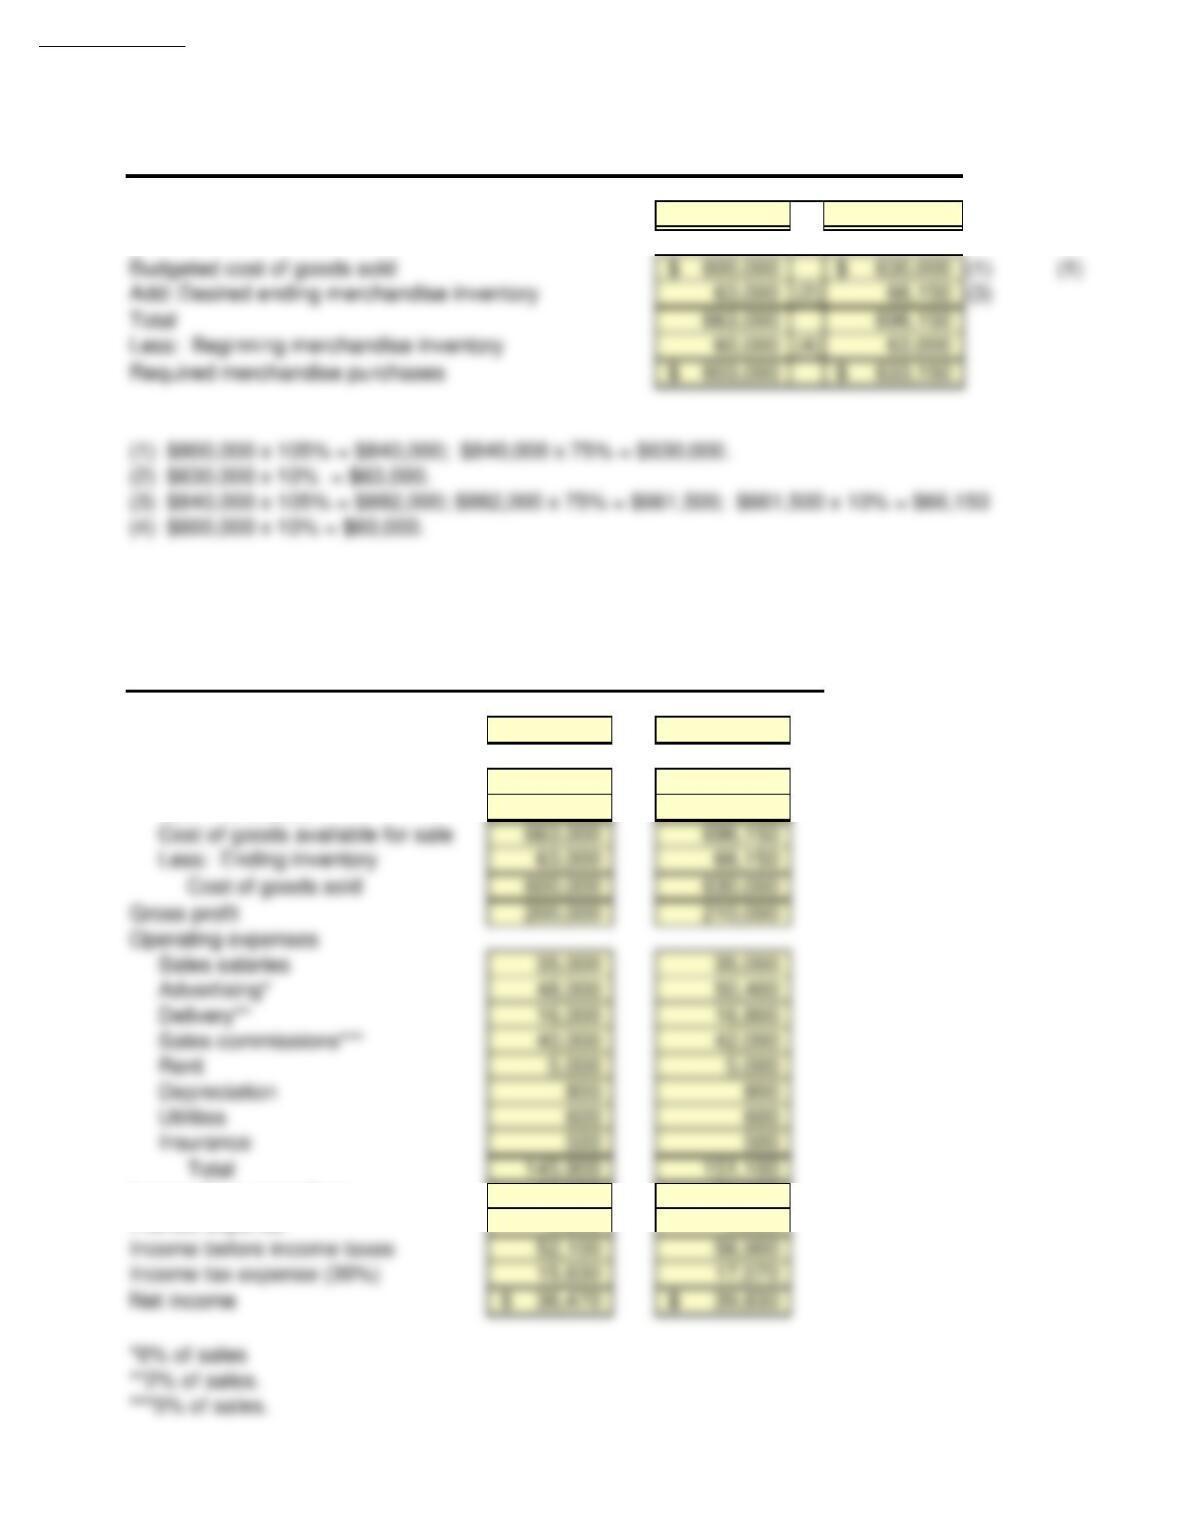
May June
Budgeted Sales
Value ?
Budgeted cost of goods sold Value ?
Add: Desired ending merchandise inventory ? ?
Total ? ?
Less: Beginning merchandise inventory ? Value
Required merchandise purchases ? ?
May June
Sales Revenue Value Value
Cost of goods sold
Beginning inventory Value Value
Add: Purchases Value Value
Cost of goods available for sale ? ?
Less: Ending inventory Value Value
Cost of goods sold ? ?
Gross profit ? ?
Operating expenses
Sales salaries Value Value
Advertising* ? ?
Delivery** ? ?
Sales commissions*** ? ?
Rent Value Value
Utilities
Sales salaries
Delivery expense
Sales commissions
Rent expense
Depreciation
San Miguel Store
Budgeted Income Statement
For the Months of May and June, 2017
Insurance
SUPPAR COMPANY
San Miguel Store
Merchandise Purchases Budget
For the Months of May and June, 2017
SUPPAR COMPANY
Depreciation Value Value
Utilities Value Value
Insurance Value Value
Total ? ?
Income from operations ? ?
Interest expense Value Value
Income before income taxes ? ?
Income tax expense (30%) ? ?
Net income ? ?
*6% of sales
**2% of sales.
***5% of sales.
After you have completed P9-5A consider the following additional question.
1. Assume that expected sales in May changed to $875,000 and cost of goods
sold changed to 70% of sales. Revise the merchandising purchases budget
and the budgeted income statement to reflect these changes.
P9-5A Solution
May June
Budgeted Sales 800,000$ 840,000$
May June
Sales Revenue 800,000$ 840,000$
Cost of goods sold
Beginning inventory 60,000 63,000
Add: Purchases 603,000 633,150
Income from operations 54,100 58,900
Interest expense 2,000 2,000
Income before income taxes
Budgeted Income Statement
For the Months of May and June, 2017
SUPPAR COMPANY
San Miguel Store
Merchandise Purchases Budget
For the Months of May and June, 2017
SUPPAR COMPANY
San Miguel Store
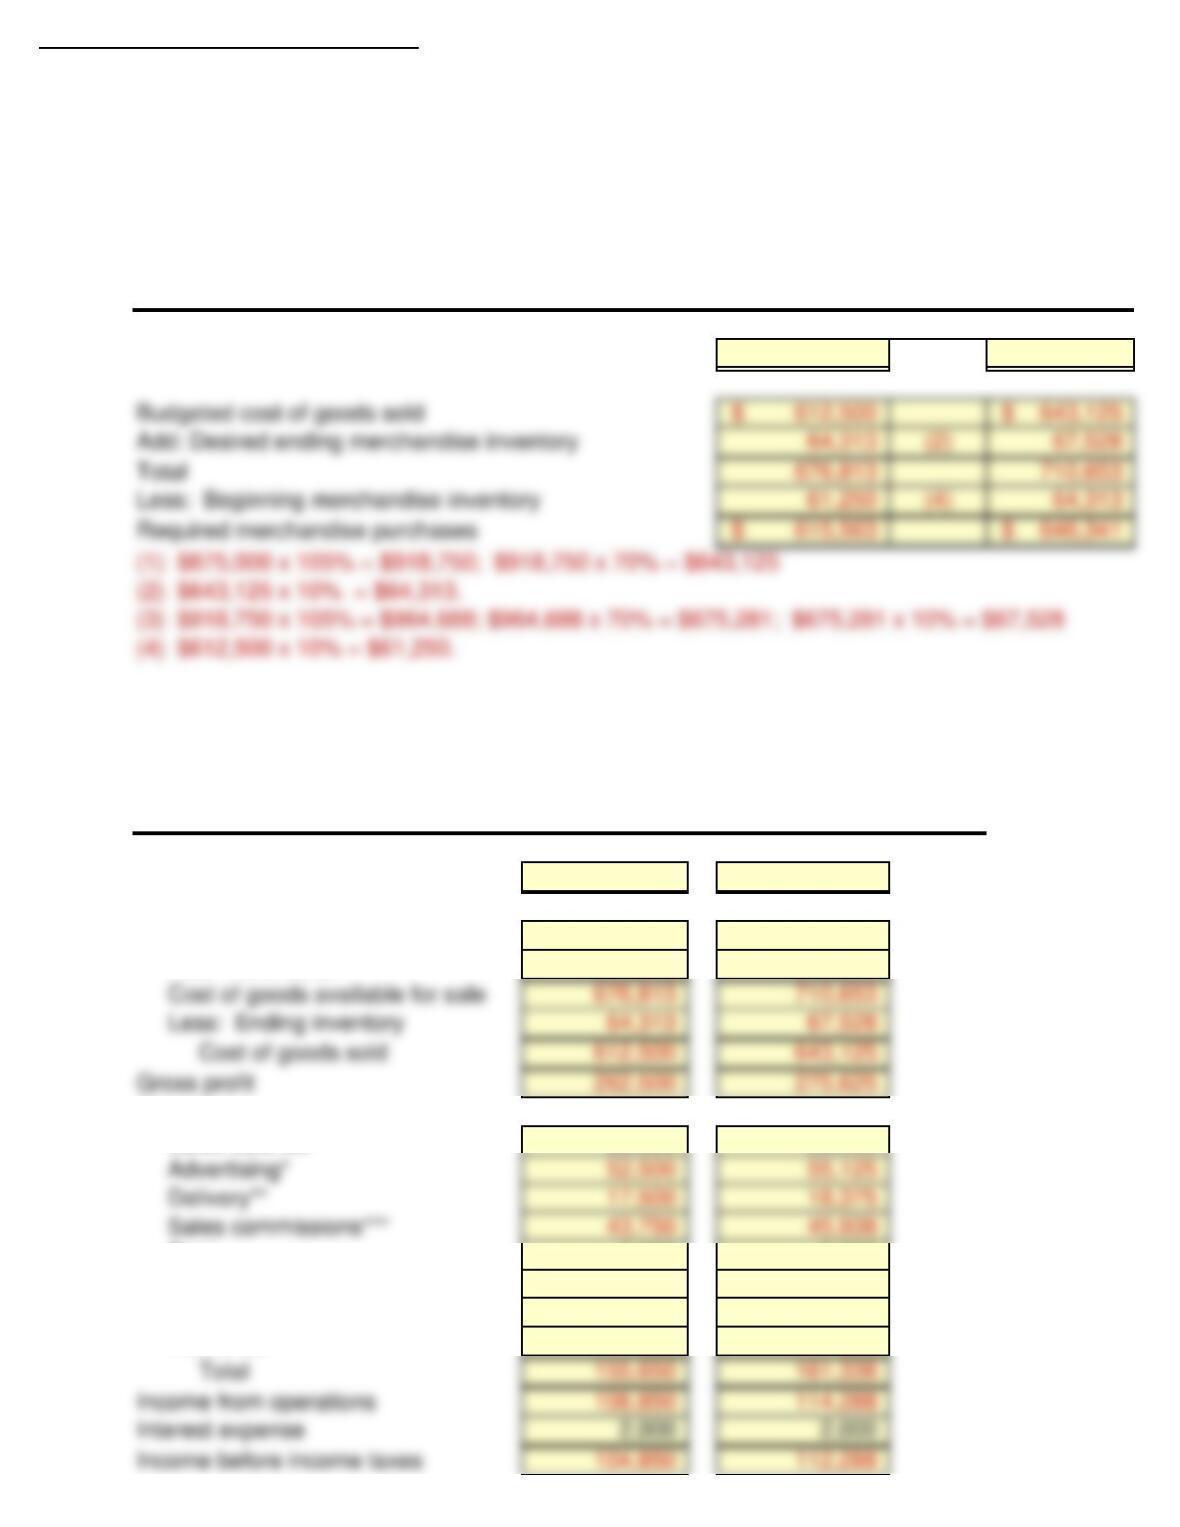
P9-5A Solution to additional question
1. Assume that expected sales in May changed to $875,000 and cost of goods
sold changed to 70% of sales. Revise the merchandising purchases budget
and the budgeted income statement to reflect these changes.
May June
Budgeted Sales 875,000$ 918,750$
May June
Sales Revenue 875,000$ 918,750$
Cost of goods sold
Income before income taxes
Beginning inventory 61,250 64,313
Add: Purchases 615,563 646,341
Operating expenses
Sales salaries 35,000 35,000
Rent 5,000 5,000
Depreciation 800 800
Utilities 600 600
Insurance 500 500
Budgeted Income Statement
For the Months of May and June, 2017
SUPPAR COMPANY
San Miguel Store
Merchandise Purchases Budget
For the Months of May and June, 2017
SUPPAR COMPANY
San Miguel Store

CD9 Current Designs
Diane Buswell is preparing the 2017 budget for one of Current Design‘s rotomolded kayaks. Extensive meetings with
members of the sales department and executive team have resulted in the following unit sales projections for 2017.
Quarter 1 1,000 kayaks
Quarter 2 1,500 kayaks
Quarter 3 750 kayaks
Quarter 4 750 kayaks
Current Designs’ policy is to have finished goods ending inventory in a quarter equal to 20% of the next quarter‘s anticipated
sales. Preliminary sales projections for 2018 are 1,100 units for the first quarter and 1,500 units for the second quarter. Ending
inventory of finished goods at December 31, 2016, will be 200 rotomolded kayaks.
Production of each kayak requires 54 pounds of polyethylene powder and a finishing kit (rope, seat, hardware, etc.). Company
policy is that the ending inventory of polyethylene powder should be 25% of the amount needed for production in the next
quarter. Assume that the ending inventory of polyethylene powder on December 31, 2016 is 19,400 pounds. The finishing kits
can be assembled as they are needed. As a result, Current Designs does not maintain a significant inventory of the finished kits.
The polyethylene powder used in these kayaks cost $1.50 per pound, and the finishing kits cost $170 each. Production of a
single kayak requires 2 hours of time by more experienced, type I employees and 3 hours of finishing time by type II employees.
The type I employees are paid $15 per hour, and the type II employees are paid $12 per hour.
Selling and administrative expenses for this line are expected to be $45 per unit sold plus $7,500 per quarter. Manufacturing
overhead is assigned at 150% of labor costs.
Instructions
Prepare the production budget, direct materials budget, direct labor budget, manufacturing overhead budget, and selling and
administrative budget for this product line by quarter and in total for 2017.
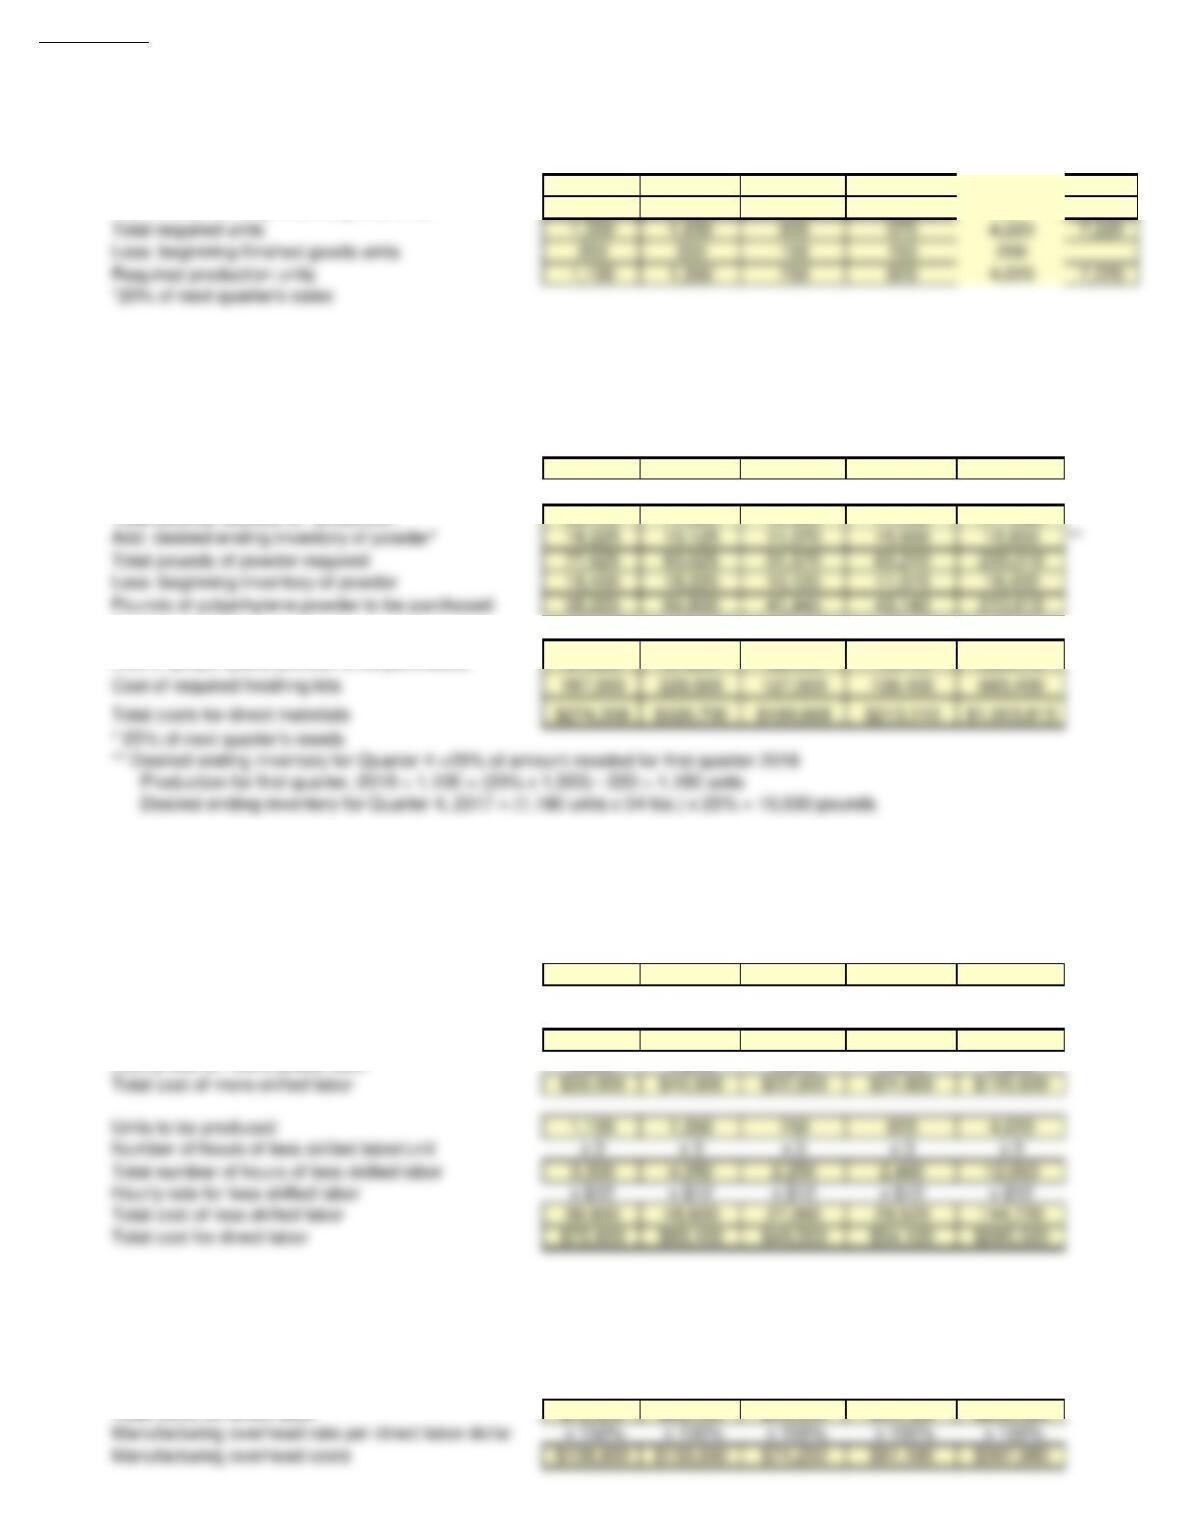
NOTE: Enter a number in cells requesting a value; enter either a number or a formula in cells with a “?” .
Quarter 1 Quarter 2 Quarter 3 Quarter 4 Total
Expected unit sales Value Value Value Value ?
Add: desired ending finished goods units ? ? ? ? ?
Total required units ? ? ? ? ?
Less: beginning finished goods units ? Value Value Value ?
Required production units ? ? ? ? ?
Quarter 1 Quarter 2 Quarter 3 Quarter 4 Total
Units to be produced Value Value Value Value ?
Pounds of polyethylene powder per unit x 54 lbs. x 54 lbs. x 54 lbs. x 54 lbs. x 54 lbs.
Total pounds needed for production ? ? ? ? ?
Add: desired ending inventory of powder Value Value Value Value ?
Total pounds of powder required ? ? ? ? ?
Less: beginning inventory of powder Value Value Value Value ?
Pounds of polyethylene powder to be purchased ? ? ? ? ?
Cost per pound x $1.50 x $1.50 x $1.50 x $1.50 x $1.50
Cost of polyethylene powder to be purchased ? ? ? ? ?
Cost of required finishing kits ? ? ? ? ?
Total costs for direct materials ? ? ? ? ?
Quarter 1 Quarter 2 Quarter 3 Quarter 4 Total
Units to be produced Value Value Value Value ?
Number of hours of more skilled labor/unit x 2 x 2 x 2 x 2 x 2
Total number of hours of more skilled labor ? ? ? ? ?
For the Year Ending December 31, 2017
CURRENT DESIGNS
Production Budget
For the Year Ending December 31, 2017
CURRENT DESIGNS
Direct Materials Budget
CURRENT DESIGNS
Direct Labor Budget
For the Year Ending December 31, 2017
Hourly rate for more skilled labor x $15 x $15 x $15 x $15 x $15
Total cost of more skilled labor ? ? ? ? ?
Units to be produced Value Value Value Value ?
Number of hours of less skilled labor/unit x 3 x 3 x 3 x 3 x 3
Total number of hours of less skilled labor ? ? ? ? ?
Hourly rate for less skilled labor x $12 x $12 x $12 x $12 x $12
Total cost of less skilled labor ? ? ? ? ?
Total cost for direct labor ? ? ? ? ?
Quarter 1 Quarter 2 Quarter 3 Quarter 4 Total
Total costs for direct labor Value Value Value Value ?
Manufacturing overhead rate per direct labor dollar x 150% x 150% x 150% x 150% x 150%
Manufacturing overhead costs ? ? ? ? ?
Quarter 1 Quarter 2 Quarter 3 Quarter 4 Total
Expected unit sales Value Value Value Value ?
Variable selling and administrative costs @ $45/unit ? ? ? ? ?
Fixed selling and administrative costs Value Value Value Value ?
Total selling and administrative costs ? ? ? ? ?
After you have completed CD9 consider the following additional question.
1. Assume that each kayak requires 55 pounds of polyethylene powder and that ending inventory of polyethylene
powder changed to 20% of the amount needed for production in the next quarter. Show the impact of these
changes on the budgets.
CURRENT DESIGNS
Selling and Administrative Budget
For the Year Ending December 31, 2017
CURRENT DESIGNS
Manufacturing Overhead Budget
For the Year Ending December 31, 2017
CD9 Solution
Quarter 1 Quarter 2 Quarter 3 Quarter 4 Total Total
Expected unit sales 1,000 1,500 750 750 4,000 7,000
Add: desired ending finished goods units* 300 150 150 220 220 220
Quarter 1 Quarter 2 Quarter 3 Quarter 4 Total
Units to be produced 1,100 1,350 750 820 4,020
Pounds of polyethylene powder per unit x 54 lbs. x 54 lbs. x 54 lbs. x 54 lbs. x 54 lbs.
Total pounds needed for production 59,400 72,900 40,500 44,280 217,080
Cost per pound x $1.50 x $1.50 x $1.50 x $1.50 x $1.50
Cost of polyethylene powder to be purchased 87,338 97,200 62,168 73,710 320,415
Quarter 1 Quarter 2 Quarter 3 Quarter 4 Total
Units to be produced 1,100 1,350 750 820 4,020
Number of hours of more skilled labor/unit x 2 x 2 x 2 x 2 x 2
Total number of hours of more skilled labor 2,200 2,700 1,500 1,640 8,040
Hourly rate for more skilled labor x $15 x $15 x $15 x $15 x $15
Quarter 1 Quarter 2 Quarter 3 Quarter 4 Total
Total costs for direct labor $72,600 $89,100 $49,500 $54,120 $265,320
For the Year Ending December 31, 2017
CURRENT DESIGNS
Production Budget
For the Year Ending December 31, 2017
CURRENT DESIGNS
Direct Materials Budget
CURRENT DESIGNS
Direct Labor Budget
For the Year Ending December 31, 2017
CURRENT DESIGNS
Manufacturing Overhead Budget
For the Year Ending December 31, 2017
Quarter 1 Quarter 2 Quarter 3 Quarter 4 Total
CURRENT DESIGNS
Selling and Administrative Budget
For the Year Ending December 31, 2017
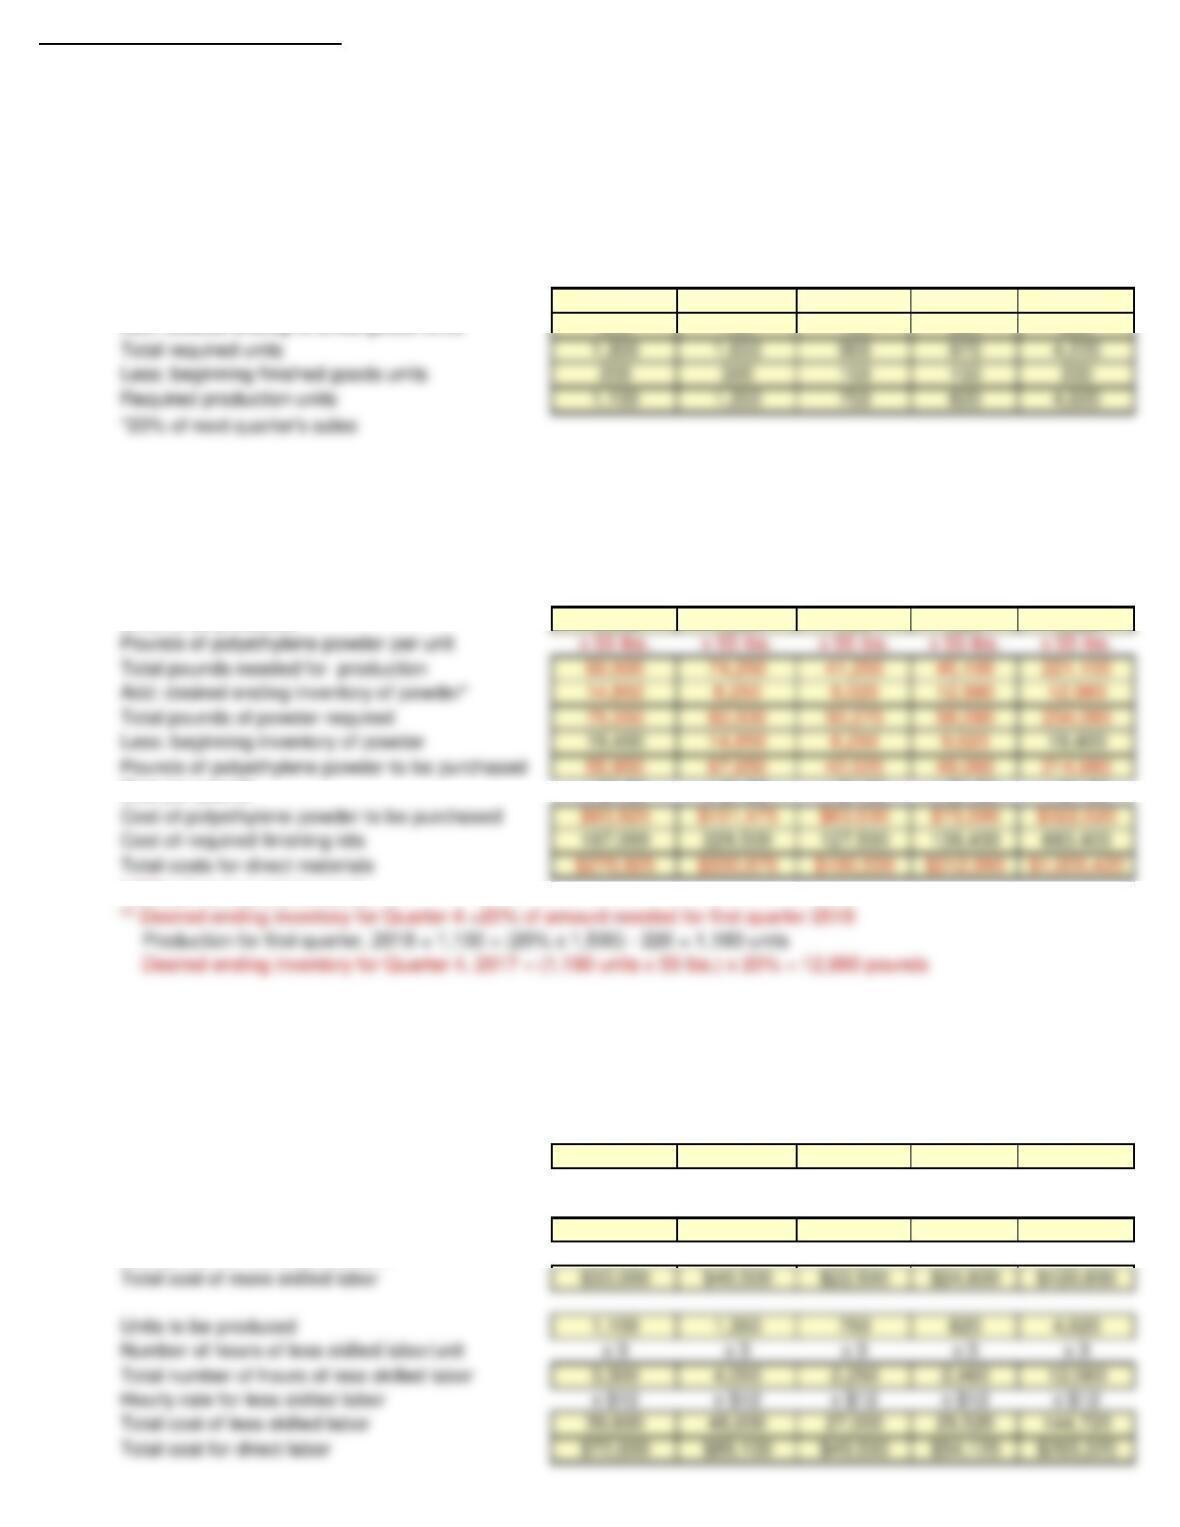
CD9 Solution to additional question
1. Assume that each kayak requires 55 pounds of polyethylene powder and that ending inventory of polyethylene
powder changed to 20% of the amount needed for production in the next quarter. Show the impact of these
changes on the budgets.
Quarter 1 Quarter 2 Quarter 3 Quarter 4 Total
Expected unit sales 1,000 1,500 750 750 4,000
Add: desired ending finished goods units* 300 150 150 220 220
Quarter 1 Quarter 2 Quarter 3 Quarter 4 Total
Units to be produced 1,100 1,350 750 820 4,020
Cost per pound x $1.50 x $1.50 x $1.50 x $1.50 x $1.50
* 20% of next quarter’s needs
Quarter 1 Quarter 2 Quarter 3 Quarter 4 Total
Units to be produced 1,100 1,350 750 820 4,020
Number of hours of more skilled labor/unit x 2 x 2 x 2 x 2 x 2
Total number of hours of more skilled labor 2,200 2,700 1,500 1,640 8,040
Hourly rate for more skilled labor x $15 x $15 x $15 x $15 x $15
For the Year Ending December 31, 2017
CURRENT DESIGNS
Production Budget
For the Year Ending December 31, 2017
CURRENT DESIGNS
Direct Materials Budget
CURRENT DESIGNS
Direct Labor Budget
For the Year Ending December 31, 2017
Quarter 1 Quarter 2 Quarter 3 Quarter 4 Total
Total costs for direct labor $72,600 $89,100 $49,500 $54,120 $265,320
Quarter 1 Quarter 2 Quarter 3 Quarter 4 Total
Expected unit sales 1,000 1,500 750 750 4,000
Variable selling and administrative costs $45,000 $67,500 $33,750 $33,750 $180,000
CURRENT DESIGNS
Selling and Administrative Budget
For the Year Ending December 31, 2017
CURRENT DESIGNS
Manufacturing Overhead Budget
For the Year Ending December 31, 2017