255
CHAPTER 9
METRIC ANALYSIS OF FINANCIAL STATEMENTS
CLASS DISCUSSION QUESTIONS
1. Horizontal analysis is the percentage analy-
sis of increases and decreases in compara-
tive financial statements. Each item on the
most recent statement is compared with the
related item on one or more earlier state-
ments in terms of the following:
a. Amount of increase or decrease.
b. Percent of increase or decrease.
The percent change in the cash balances at
the end of the preceding year from the end
2. Comparative statements provide information
as to changes between dates or periods.
Trends indicated by comparisons may be far
more significant than the data for a single
date or period.
3. Before this question can be answered, the
increase in net income should be compared
with changes in sales, expenses, and assets
4. You should first determine if the expense
amount in the base year (denominator) is
significant. A 70% or more increase of a
small expense item may be of little concern.
However, if the expense amount in the base
year is significant, then over a 70% increase
may require further investigation.
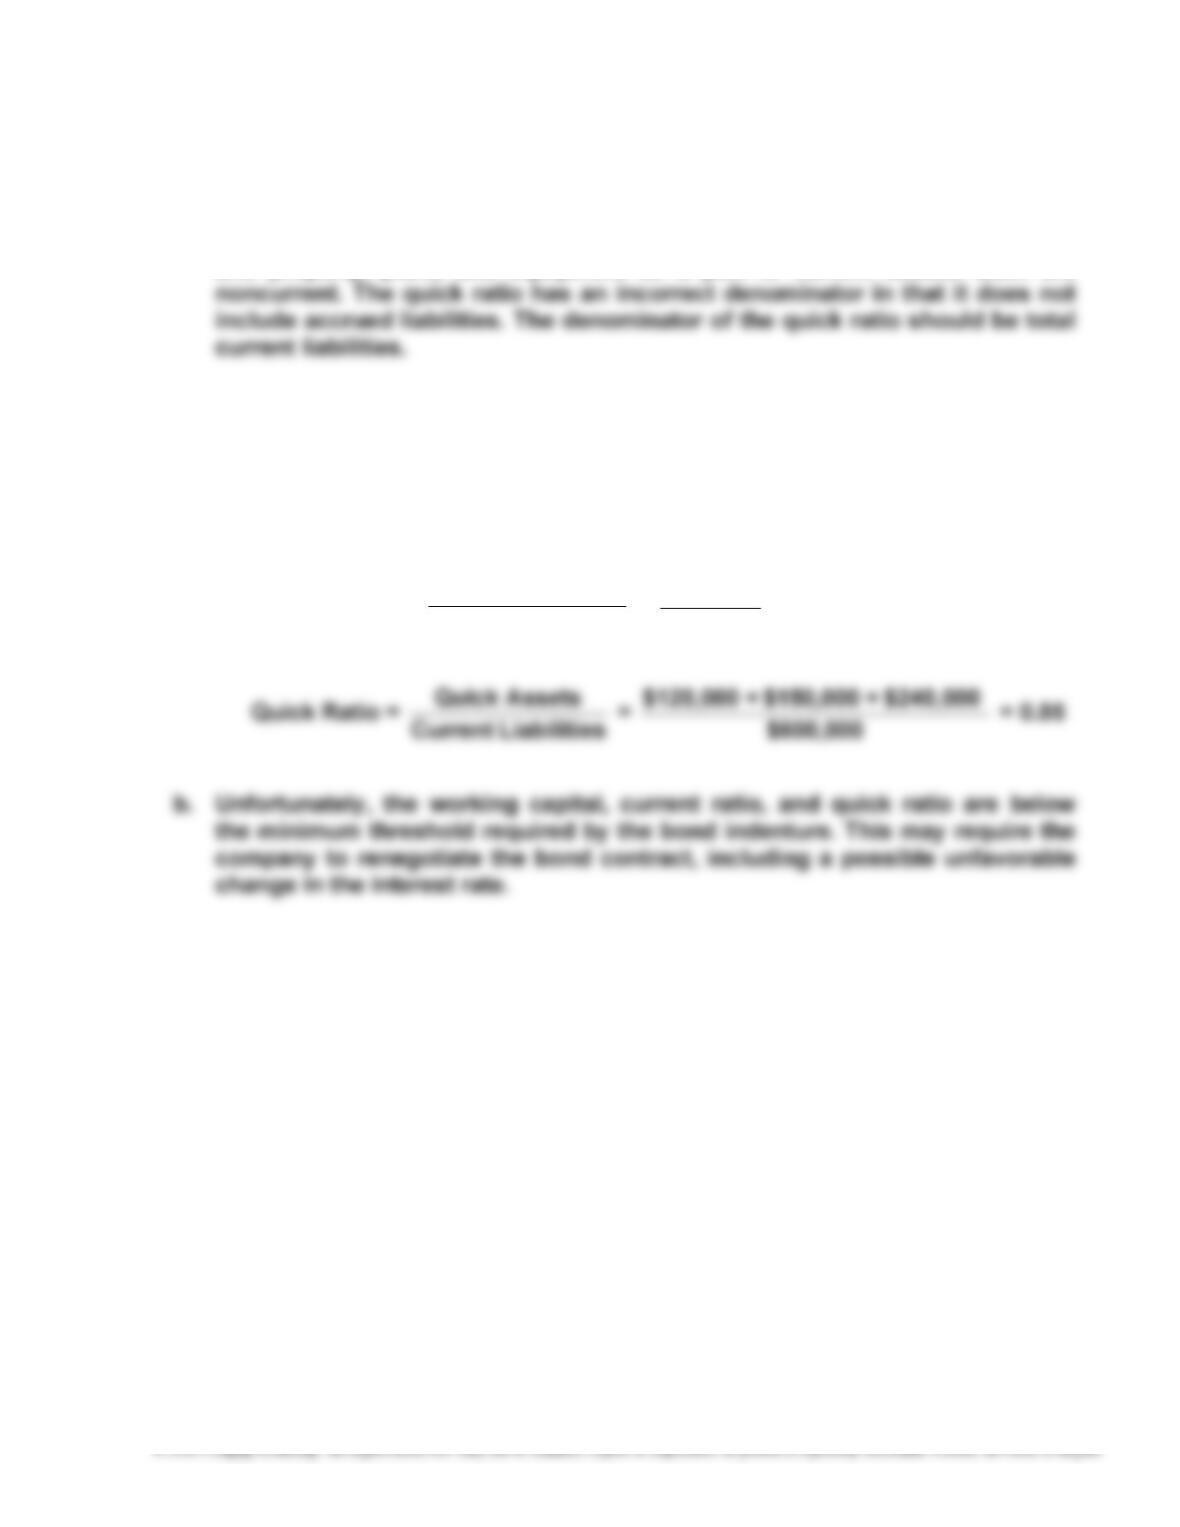
quick ratio, along with the amount of working
capital, gives a better analysis of the current
position. Such a comparison shows the
following:
Current Preceding
Year Year
Working capital ……. $162,000 $138,000
Current ratio ………… 2.8 3.3
Quick ratio …………… 0.9 1.2
Procter & Gamble, in contrast, sells almost
exclusively to other businesses, such as
Walmart. Such sales are “on account,” and
thus create accounts receivable that must
be collected. A recent financial statement
showed Walmart’s accounts receivable turn-
ing 64 times, while Procter & Gamble’s
turned only 6 times.
8. No, an accounts receivable turnover of 9
are running beyond 40 days. A substantial
amount of past-due accounts of doubtful
collectibility may be on the books.
9. a. A high inventory turnover minimizes the
amount invested in inventories, thus
freeing funds for more advantageous
use. Storage costs, administrative ex-
256
10. The ratio of fixed assets to long-term liabilities
increased from 3.6 ($1,260,000 ÷ $350,000)
for the preceding year to 4.0 ($1,800,000 ÷
$450,000) for the current year, indicating that
the company is in a stronger position now than
in the preceding year to borrow additional
funds on a long-term basis.
11. a. The return on total assets adds interest
expense to the net income, which is
divided by average total assets. It
measures the profitability of total assets
b. The return on stockholders’ equity is
normally higher than the return on total
assets. This is because of leverage,
which compensates stockholders for the
higher risk of their investments.
12. a. Due to leverage, the return on stock-
holders’ equity will often be greater than
dends paid to preferred stockholders.
13. The earnings per share in the preceding
year were $3.75 per share ($7.50 ÷ 2),
adjusted for the stock split in the latest year.
14. A share of common stock is currently selling
at 15 times current annual earnings per share.
15. The dividend yield on common stock is a
measure of the rate of return to common
stockholders in terms of cash dividend dis-
tributions. Companies in growth industries
typically reinvest a significant portion of the
is likely a company will increase its inventories
and expand its operations. Such situations
frequently result in an increase in current
liabilities out of proportion to the increase in
current assets and thus lower the current
ratio.
17. One report is the Report on Internal Control,
which verifies management’s conclusions on
257
EXERCISES
E9–1
a.
TRIBAL TECHNOLOGIES CO.
Comparative Income Statement
For the Years Ended December 31, 20Y8 and 20Y7
20Y8 20Y7
Amount Percent Amount Percent
Sales …………………………………….. $ 450,000 100.0% $ 362,500 100.0%
Cost of goods sold ………………… (279,000) (62.0) (217,500) (60.0)
Gross profit …………………………… $ 171,000 38.0% $ 145,000 40.0%
b. The vertical analysis indicates the cost of goods sold as a percent of sales
increased by 2 percentage points (62.0% – 60.0%), selling expenses decreased
by 3 percentage points (16.0% – 13.0%), administrative expenses decreased
258
E9–2
a.
SPEEDWAY MOTORSPORTS, INC.
Comparative Income Statement (in thousands of dollars)
Year 2 Year 1
Amount Percent Amount Percent
Revenues:
Admissions ……………………………….. $ 100,694 20.3% $ 100,798 20.8%
Event-related revenue ………………… 146,980 29.6 146,849 30.3
NASCAR® broadcasting revenue … 217,469 43.8 207,369 42.8
Other operating revenue …………….. 31,320 6.3 29,293 6.1
Total revenue ……………………….. $ 496,463 100.0% $ 484,309 100.0%
Expenses and other:
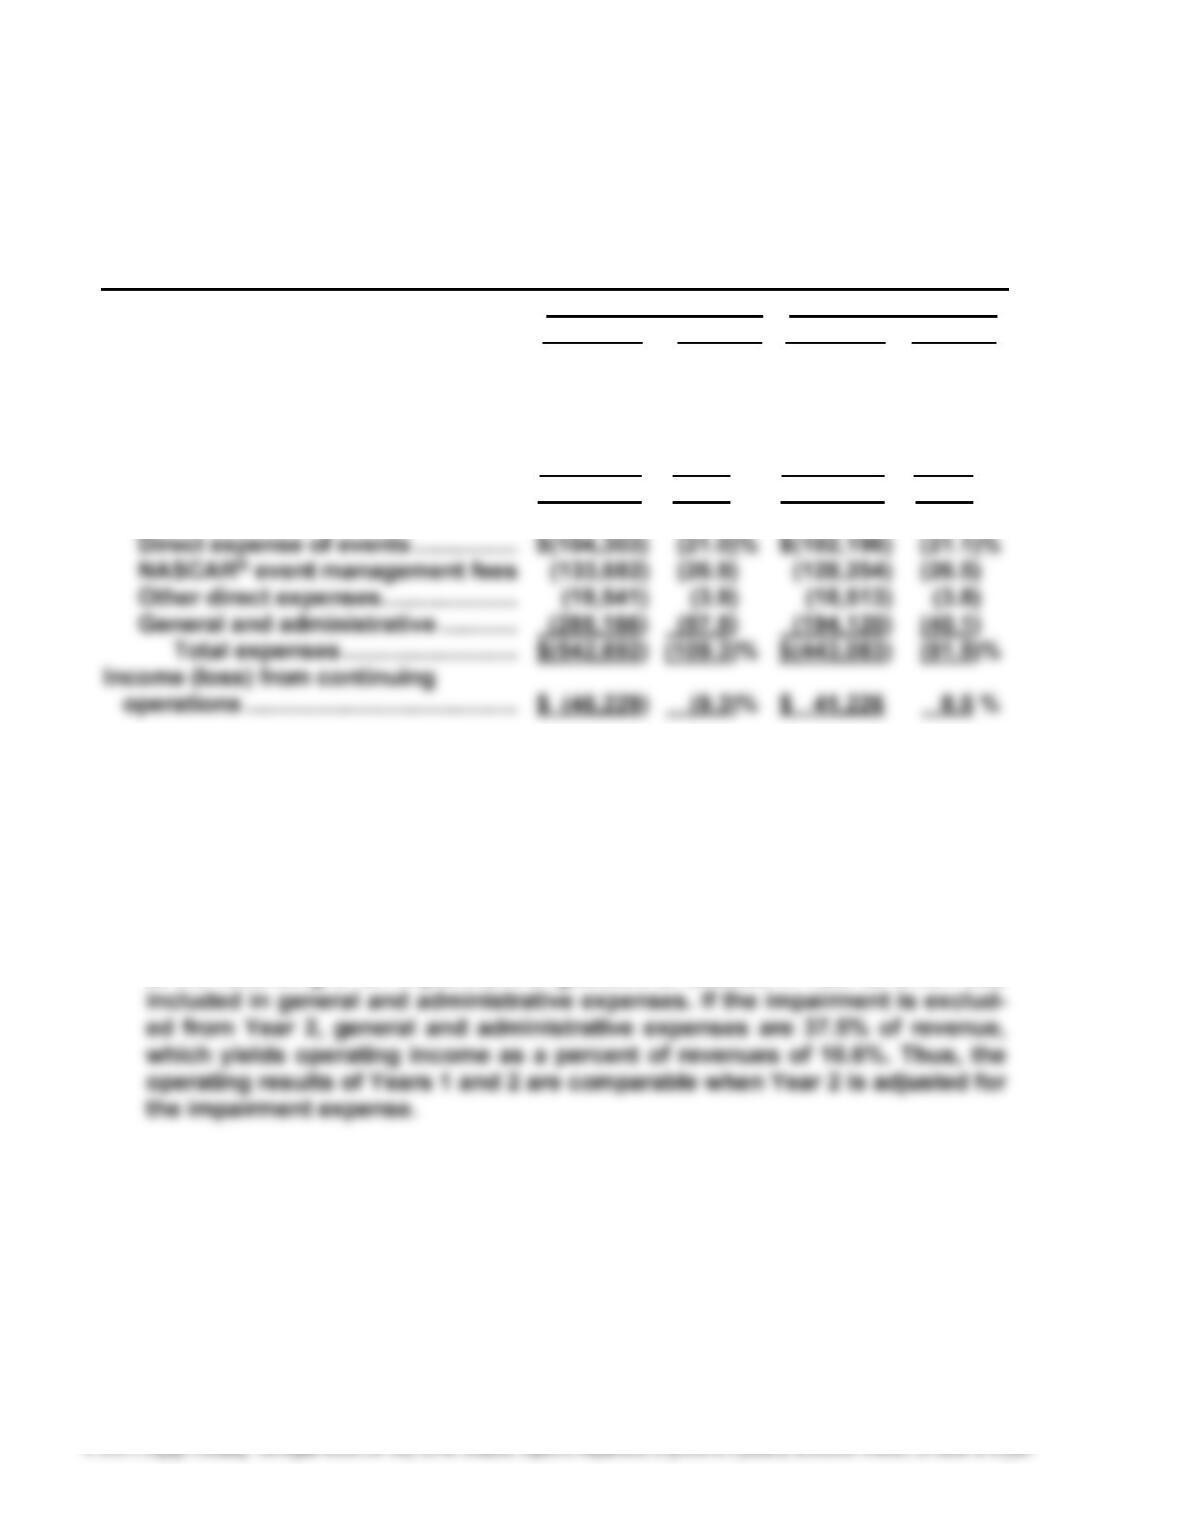
b. Overall revenue increased in Year 2 primarily due to the increase in NASCAR
broadcasting revenue of 1.0% (43.8% – 42.8%). The total expenses as a percent
of total revenue increased in Year 2 by 17.8% (109.3% – 91.5%), which resulted
in operating income before taxes as a percent of revenue decreasing by
17.8% [8.5% – (9.3%)].
The major increase in expenses in Year 2 was in general and administrative
expenses, which increased 17.3% (57.4% – 40.1%). This increase was related
to the recording of an impairment of goodwill of $98,868 in Year 2, which was
259
E9–3
a.
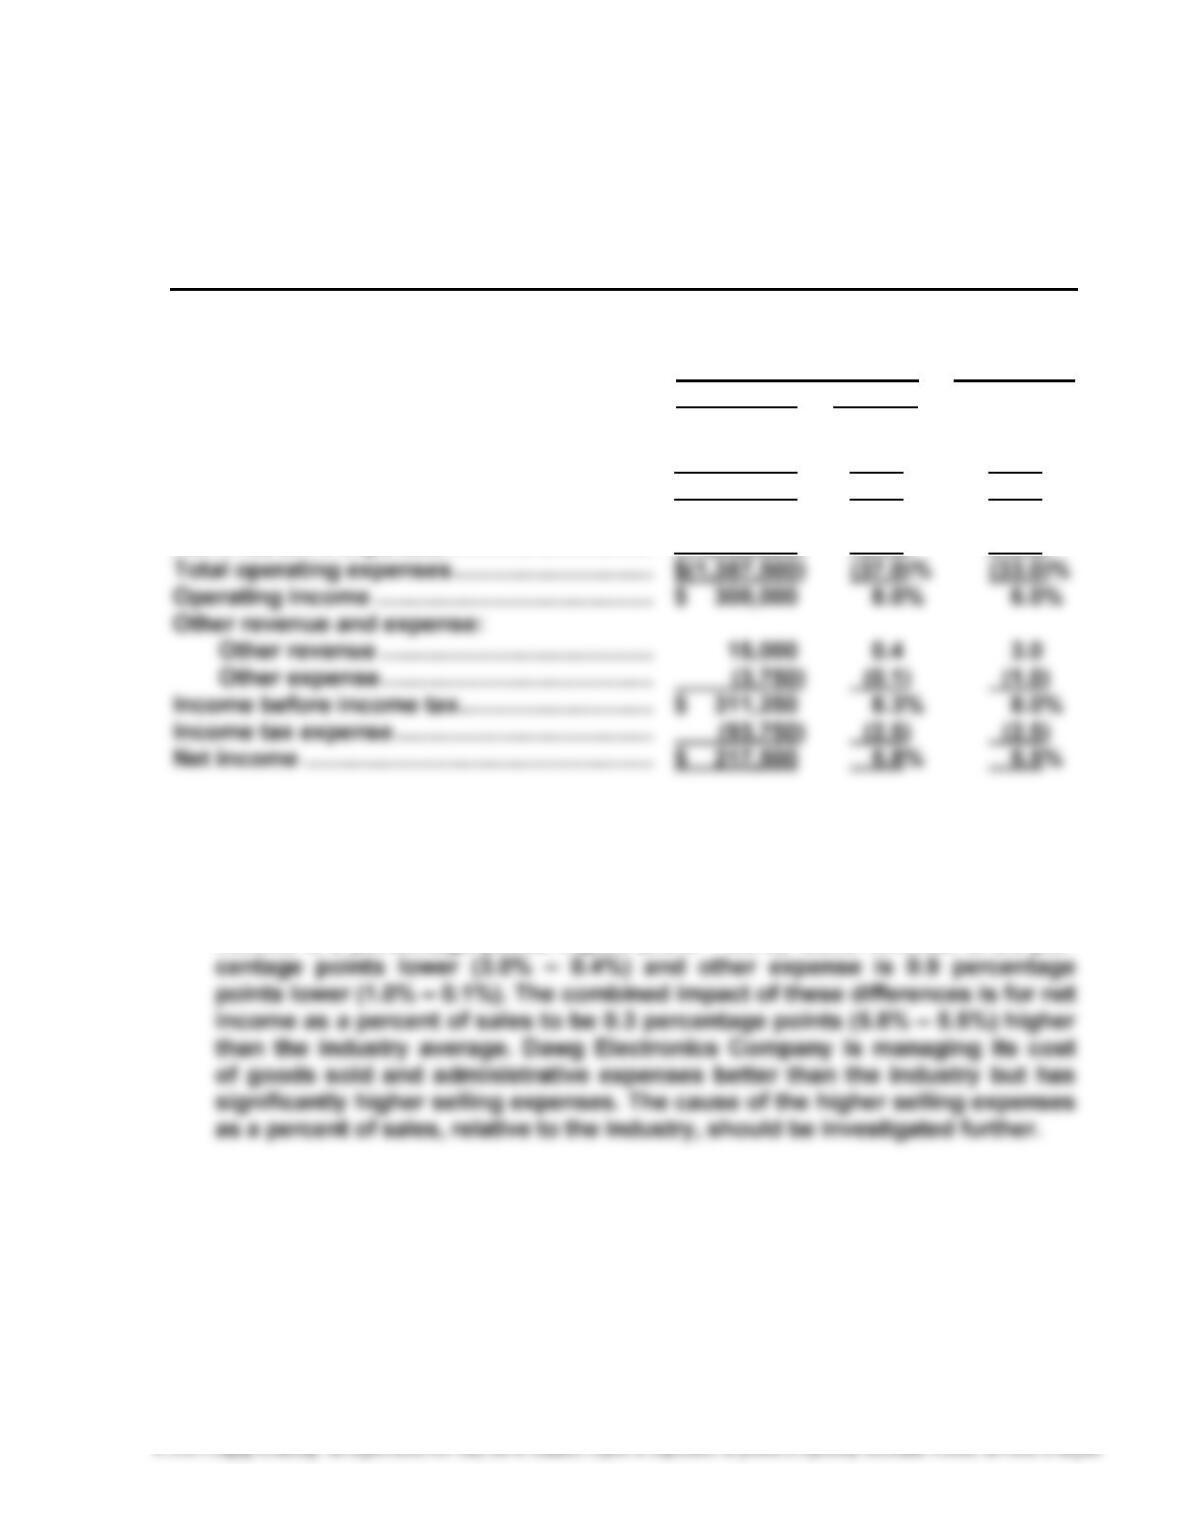
DAWG ELECTRONICS COMPANY
Common-Sized Income Statement
Dawg Electronics
Electronics Industry
Company Average
Amount Percent
Sales ………………………………………………………. $ 3,750,000 100.0% 100.0%
Cost of goods sold ………………………………….. (2,062,500) (55.0) (61.0)
Gross profit …………………………………………….. $ 1,687,500 45.0% 39.0%
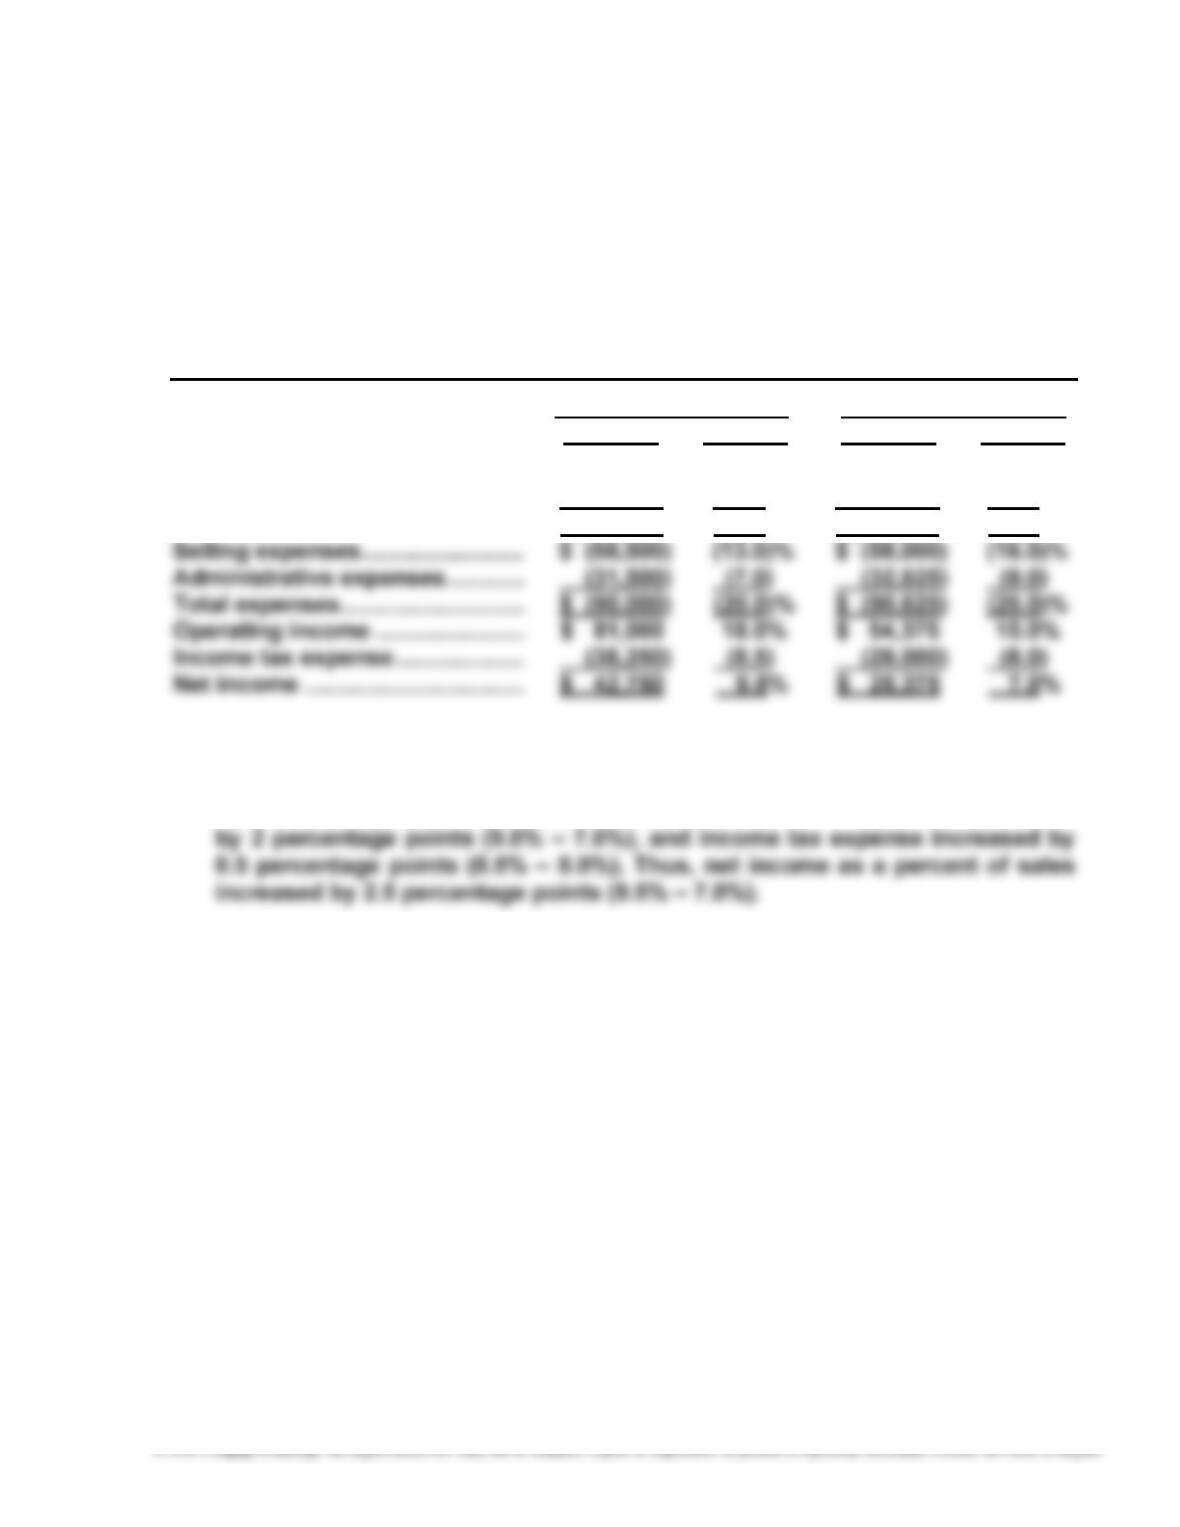
Selling expenses ……………………………………… $(1,125,000) (30.0)% (23.0)%
Administrative expenses ………………………….. (262,500) (7.0) (10.0)
b. The cost of goods sold is 6 percentage points (61.0% – 55.0%) lower than the
industry average, but the selling expenses are 7 percentage points (30.0% –
23.0%) higher than the industry average. Administrative expenses are 3
percentage points (10.0% – 7.0%) lower than the industry average. Operating
income is 2 percentage points higher (8.0% – 6.0%). Other revenue is 2.6 per-
260
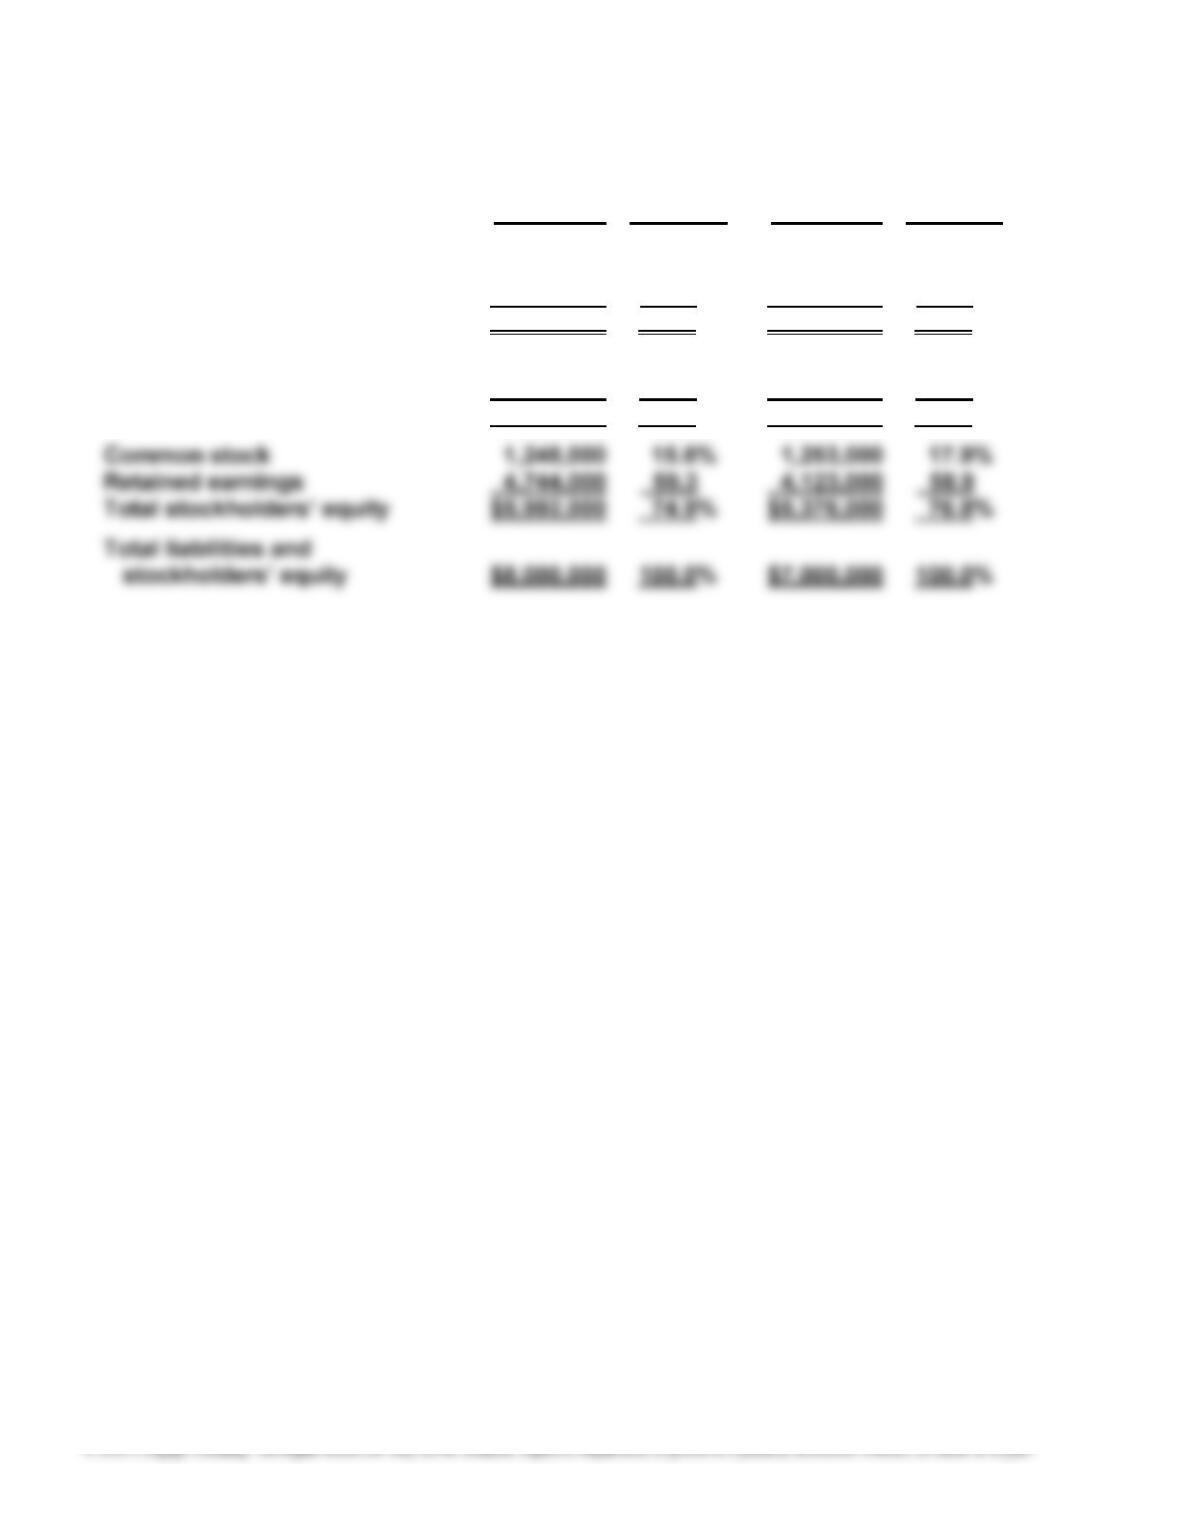
E9–4
20Y2 Percent 20Y1 Percent
Current assets $ 752,000 9.4% $ 602,000 8.6%
Propert
y
, plant, and equipment 6,248,000 78.1 5,397,000 77.1
Intan
g
ible assets 1,000,000 12.5 1,001,000 14.3
Total assets $8,000,000 100.0% $7,000,000 100.0%
Current liabilities $ 504,000 6.3% $ 427,000 6.1%
Lon
g
-term liabilities 1,504,000 18.8 1,197,000 17.1
Total liabilities $2,008,000 25.1% $1,624,000 23.2%
261
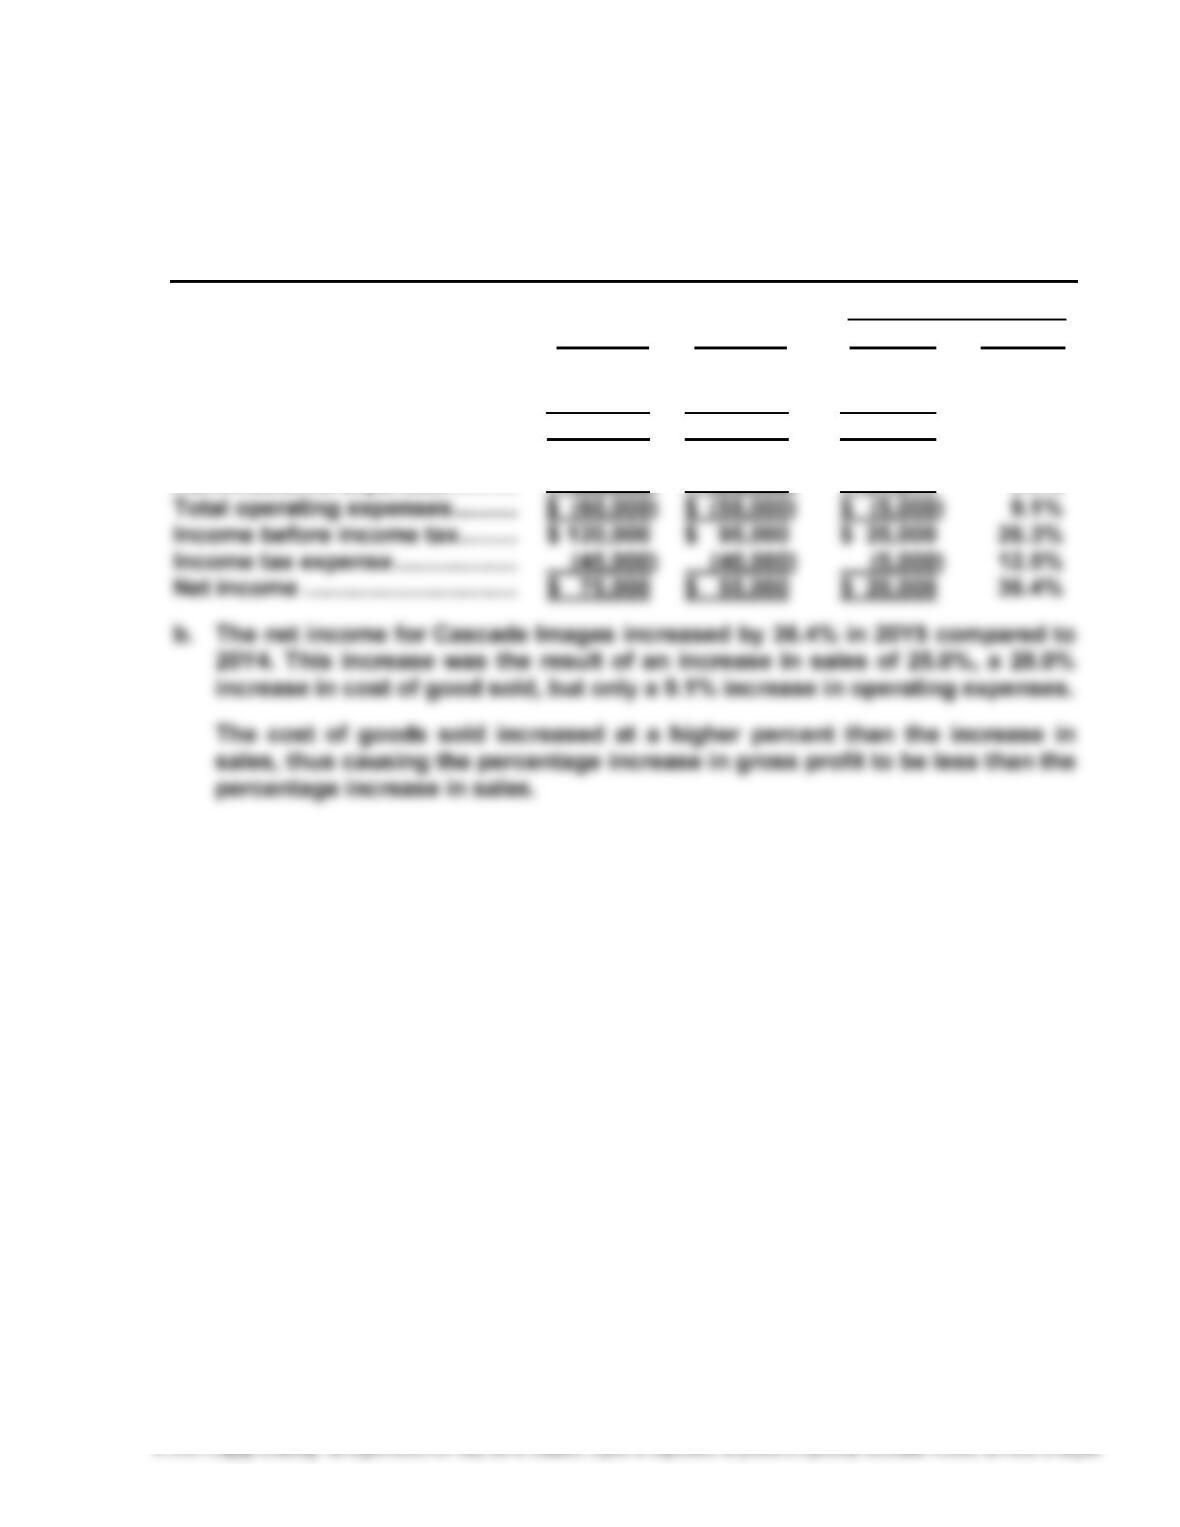
E9–5
a. CASCADE IMAGES INC.
Comparative Income Statement
For the Years Ended December 31, 20Y5 and 20Y4
Increase (Decrease)
20Y5 20Y4 Amount Percent
Sales ……………………………………. $ 500,000 $ 400,000 $100,000 25.0%
Cost of goods sold ……………….. (320,000) (250,000) (70,000) 28.0%
Gross profit ………………………….. $ 180,000 $ 150,000 $ 30,000 20.0%
Selling expenses …………………… $ (35,000) $ (30,000) $ (5,000) 16.7%
262
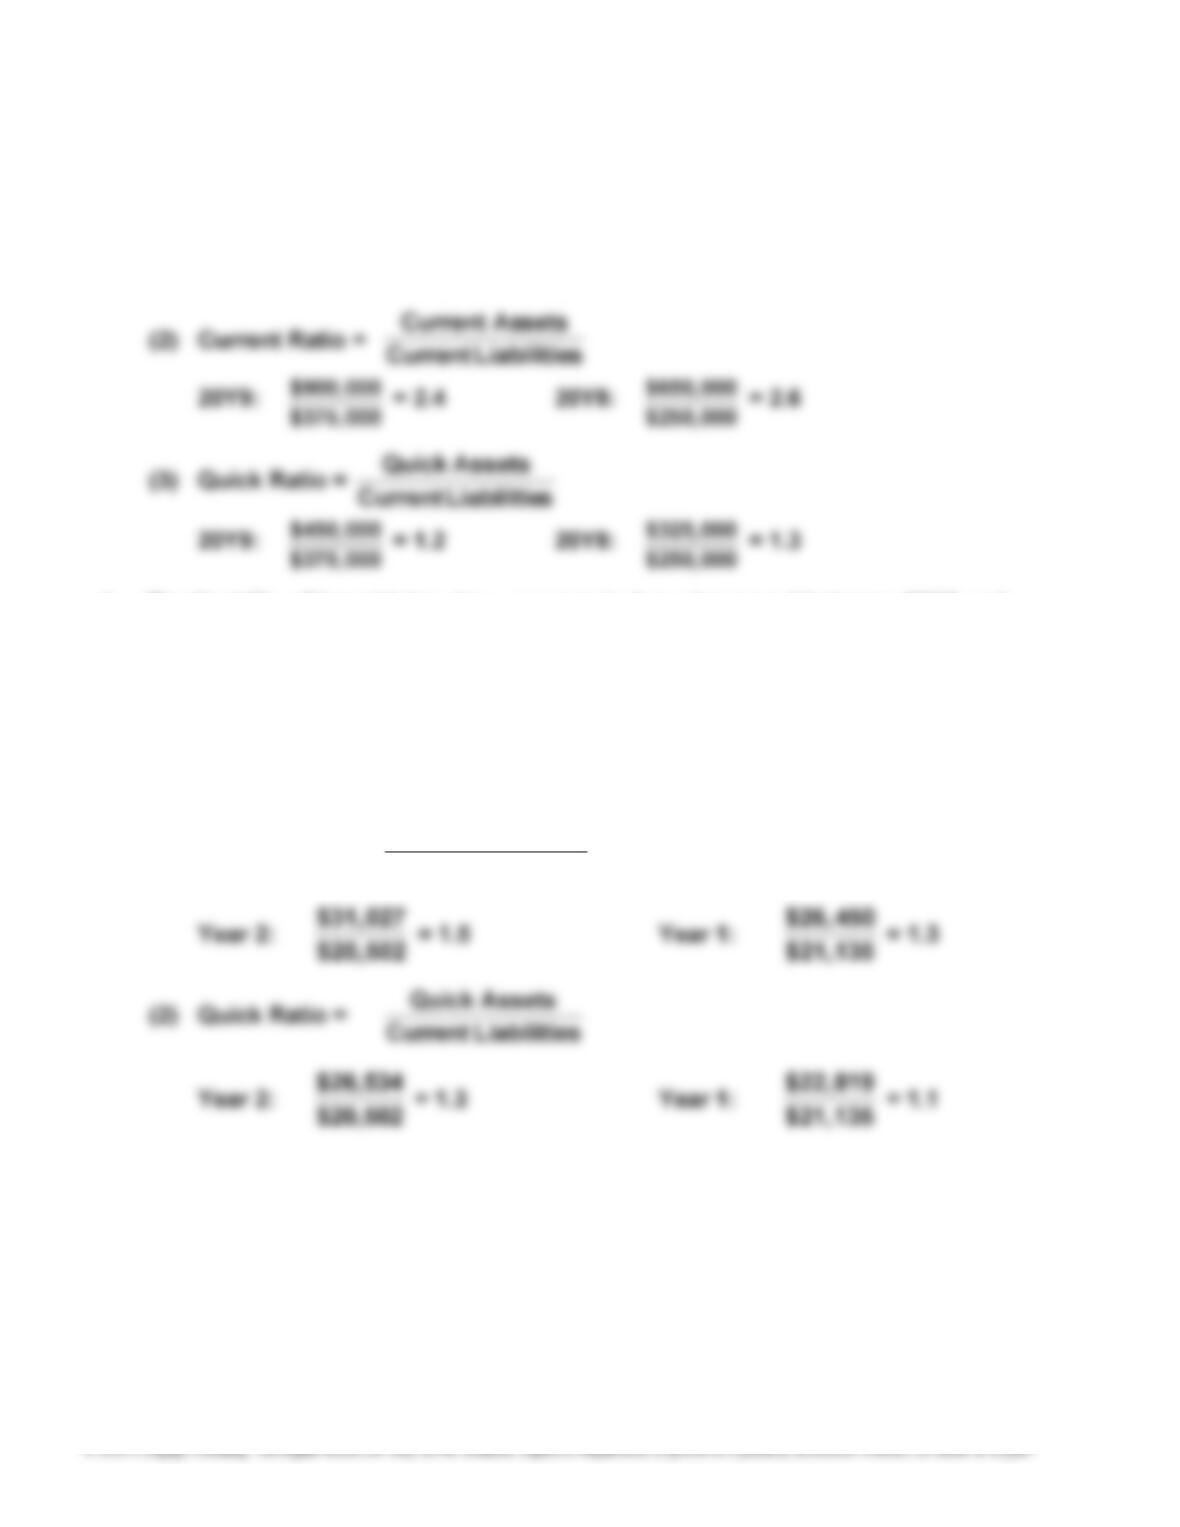
E9–6
a. (1) Working Capital = Current Assets – Current Liabilities
20Y9: $525,000 = $900,000 – $375,000
20Y8: $400,000 = $650,000 – $250,000
b. The liquidity of Icon Living, Inc., appears to have improved between 20Y8 and
20Y9 since the company’s working capital increased. However, given that the
current ratio and quick ratio decreased, it should be concluded that the
company’s liquidity declined from 20Y8 to 20Y9. These changes are the result
of an increase in current liabilities and change in the mix of current assets.
E9–7
a. (1) Current Ratio = sLiabilitieCurrent
setsCurrent As
b. The liquidity of PepsiCo has increased some over this time period. Both the
current and quick ratios have increased. The current ratio increased from 1.3
to 1.5, and the quick ratio increased from 1.1 to 1.3. PepsiCo is a strong
company with ample resources for meeting its short-term obligations.
263
E9–8
a. The working capital, current ratio, and quick ratio are calculated incorrectly.
The working capital and current ratio incorrectly include intangible assets
and property, plant, and equipment as a part of current assets. Both are
The correct calculations are as follows:
Working Capital = Current Assets – Current Liabilities
$150,000 = $750,000 – $600,000
Current Ratio = sLiabilitieCurrent
setsCurrent As = $600,000
$750,000 = 1.25
264
E9–9
a. (1) Accounts Receivable Turnover = Sales
Average Accounts Receivable
Year 3: 1
$2,640,000
$412,500 = 6.4 Year 2: 3
$1,957,500
$337,500 = 5.8
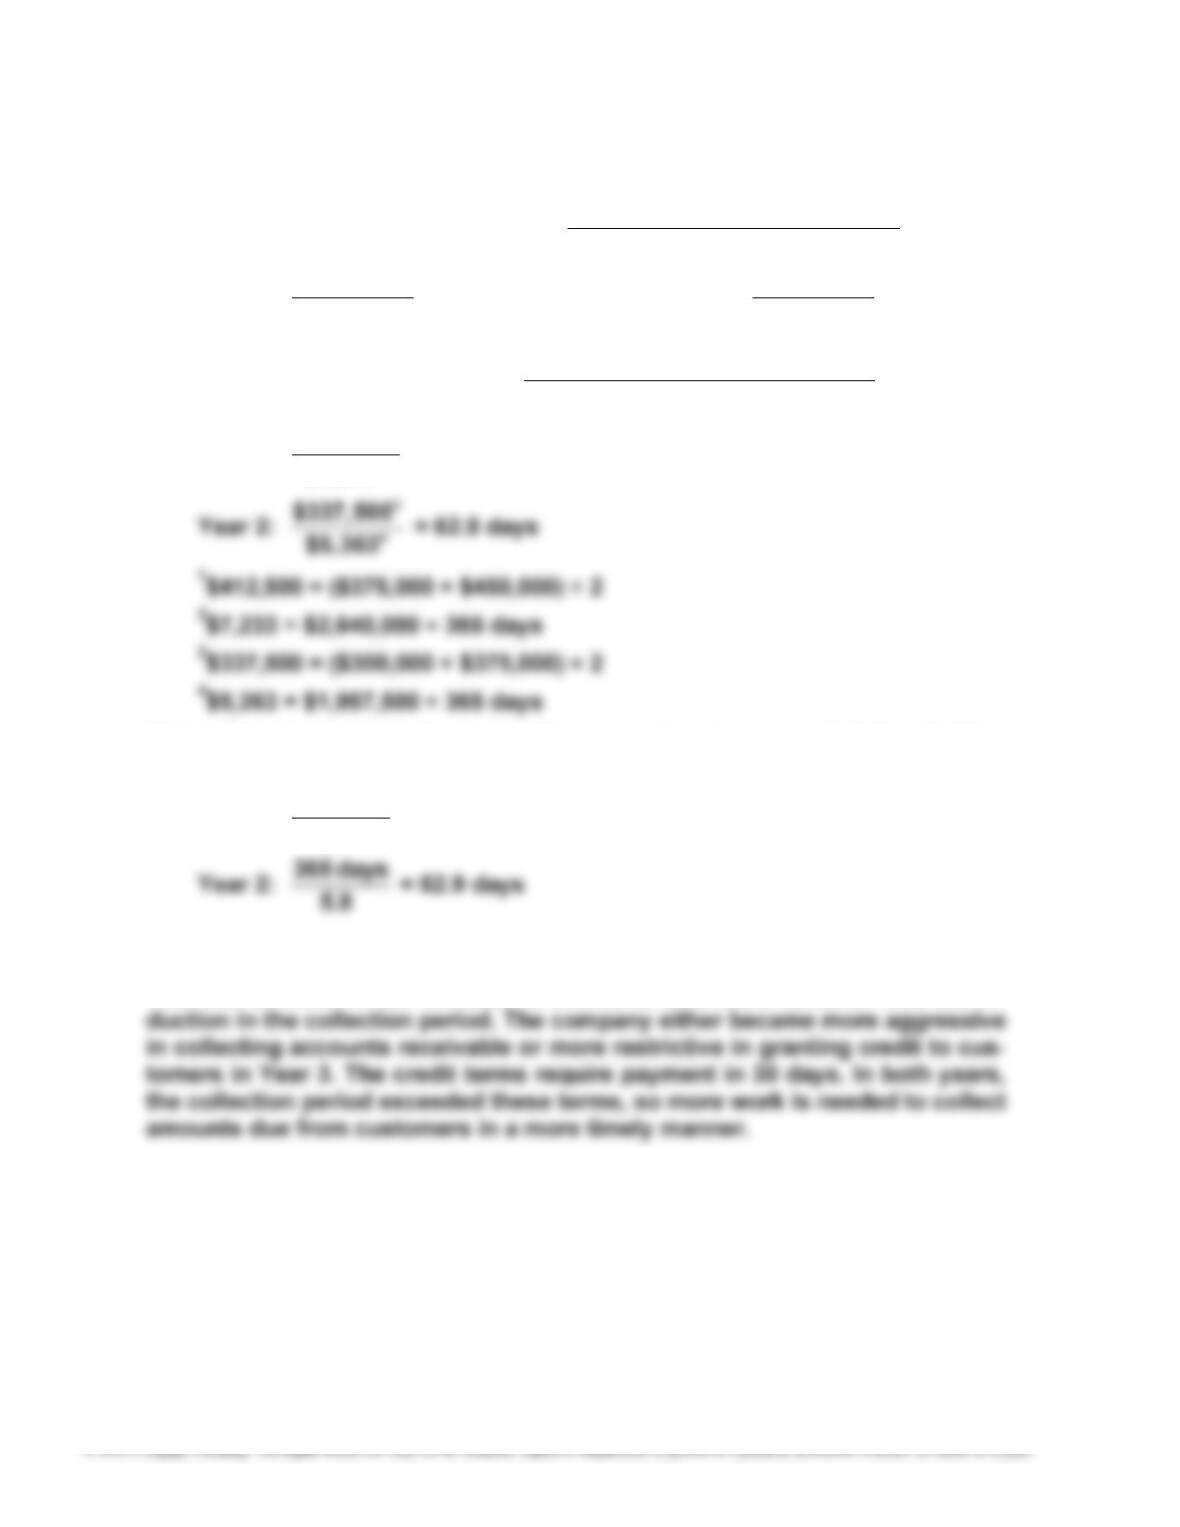
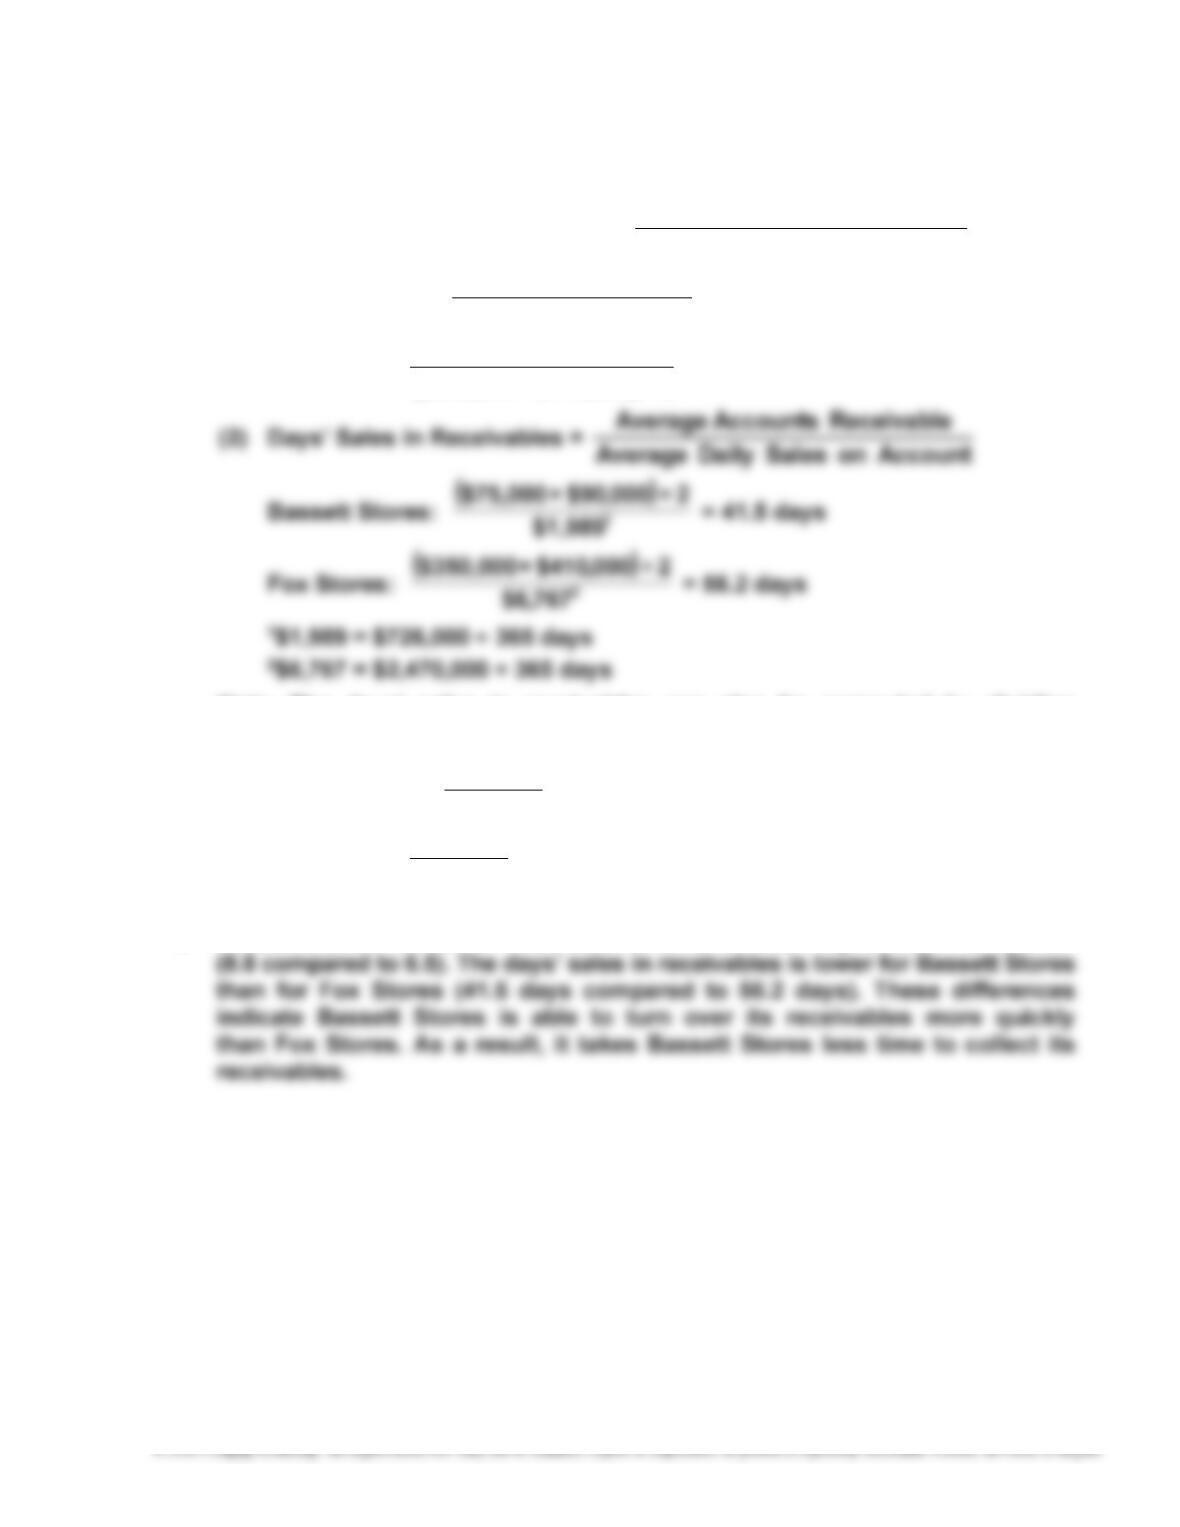
(2) Days’ Sales in Receivables = Accounton Sales Daily Average
Receivable AccountsAverage
Year 3:
1
2
$412,500
$7,233 = 57.0 days
Note: The days’ sales in receivables can also be computed by dividing
365 days by the accounts receivable turnover as shown below.
Year 3: 365 days
6.4 = 57.0 days
b. The collection of accounts receivable has improved from Year 2 to Year 3.
This can be seen in the increase in accounts receivable turnover and the re-
265
E9–10
a. (1) Accounts Receivable Turnover = Sales
Avera
g
e Accounts Receivable
Bassett Stores: 2÷)000,90$+000,75($
000,726$ = 8.8
Fox Stores: 2÷)000,410$+000,350($
000,470,2$ = 6.5
Note: The days’ sales in receivables can also be computed by dividing
365 days by the accounts receivable turnover as shown below.
Basset Stores: 8.8
days 365 = 41.5 days
Fox Stores: 6.5
days 365 = 56.2 days
b. Bassett Stores’ accounts receivable turnover is much higher than Fox Stores’
266
E9–11
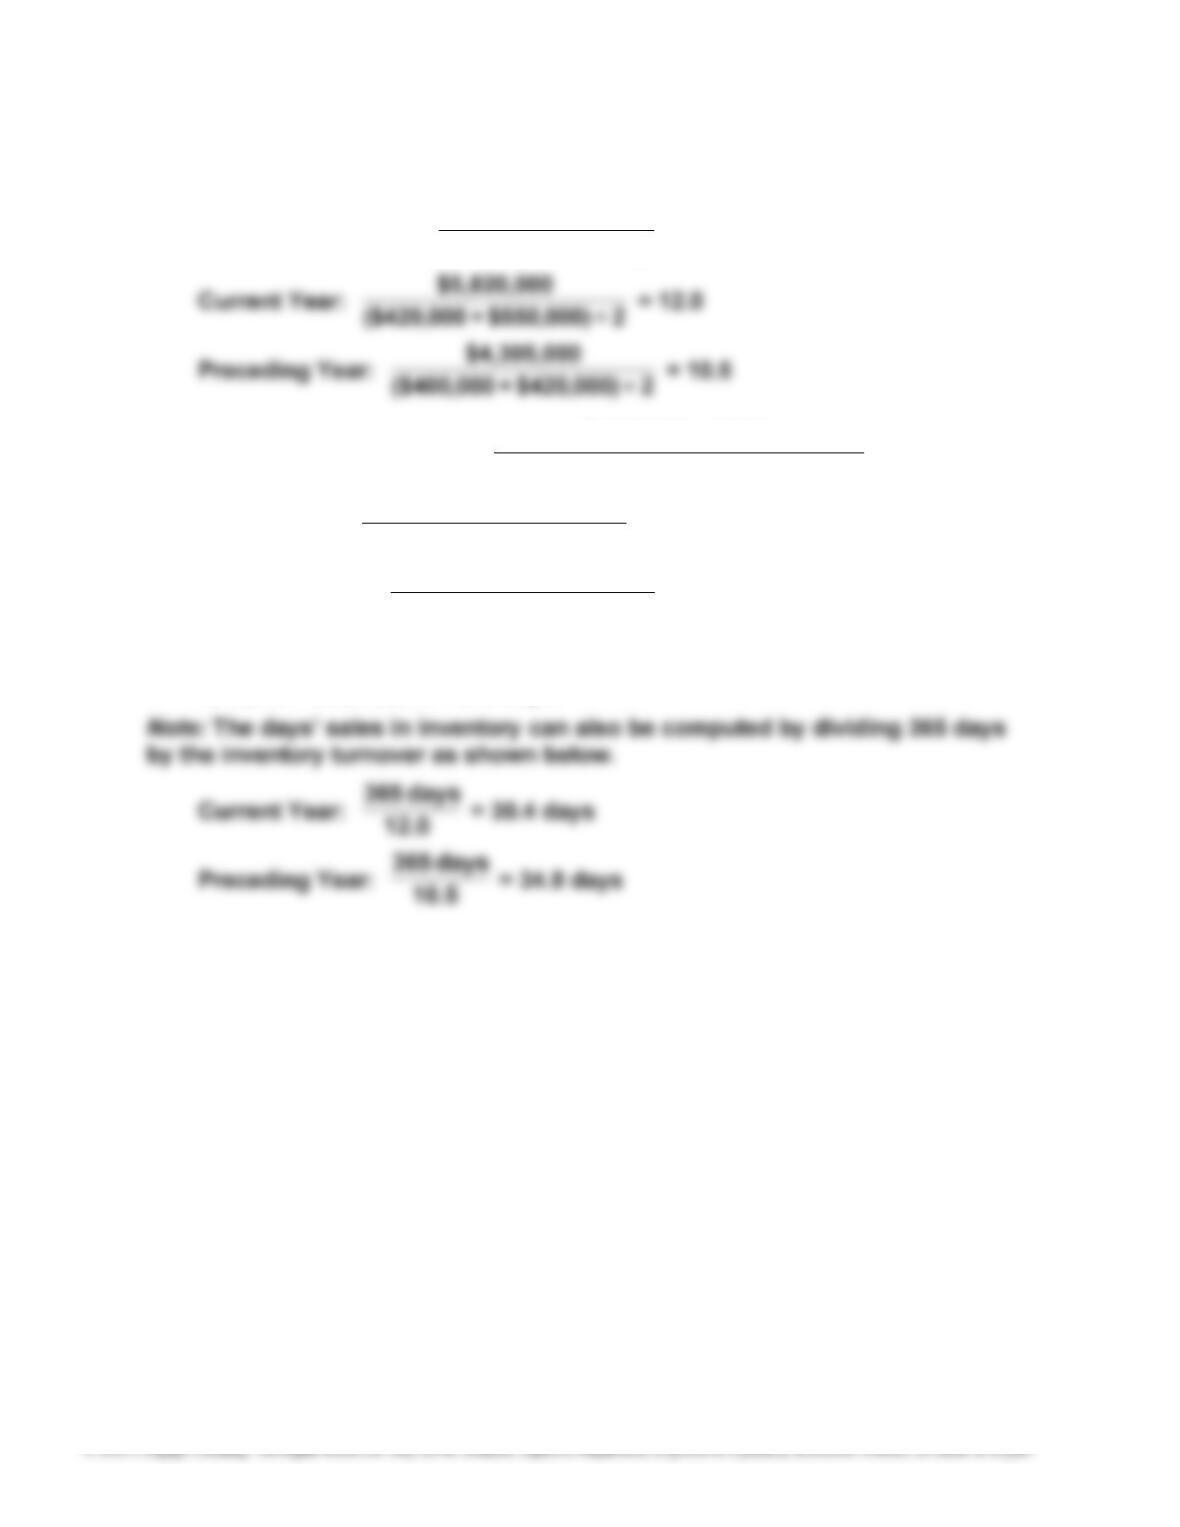
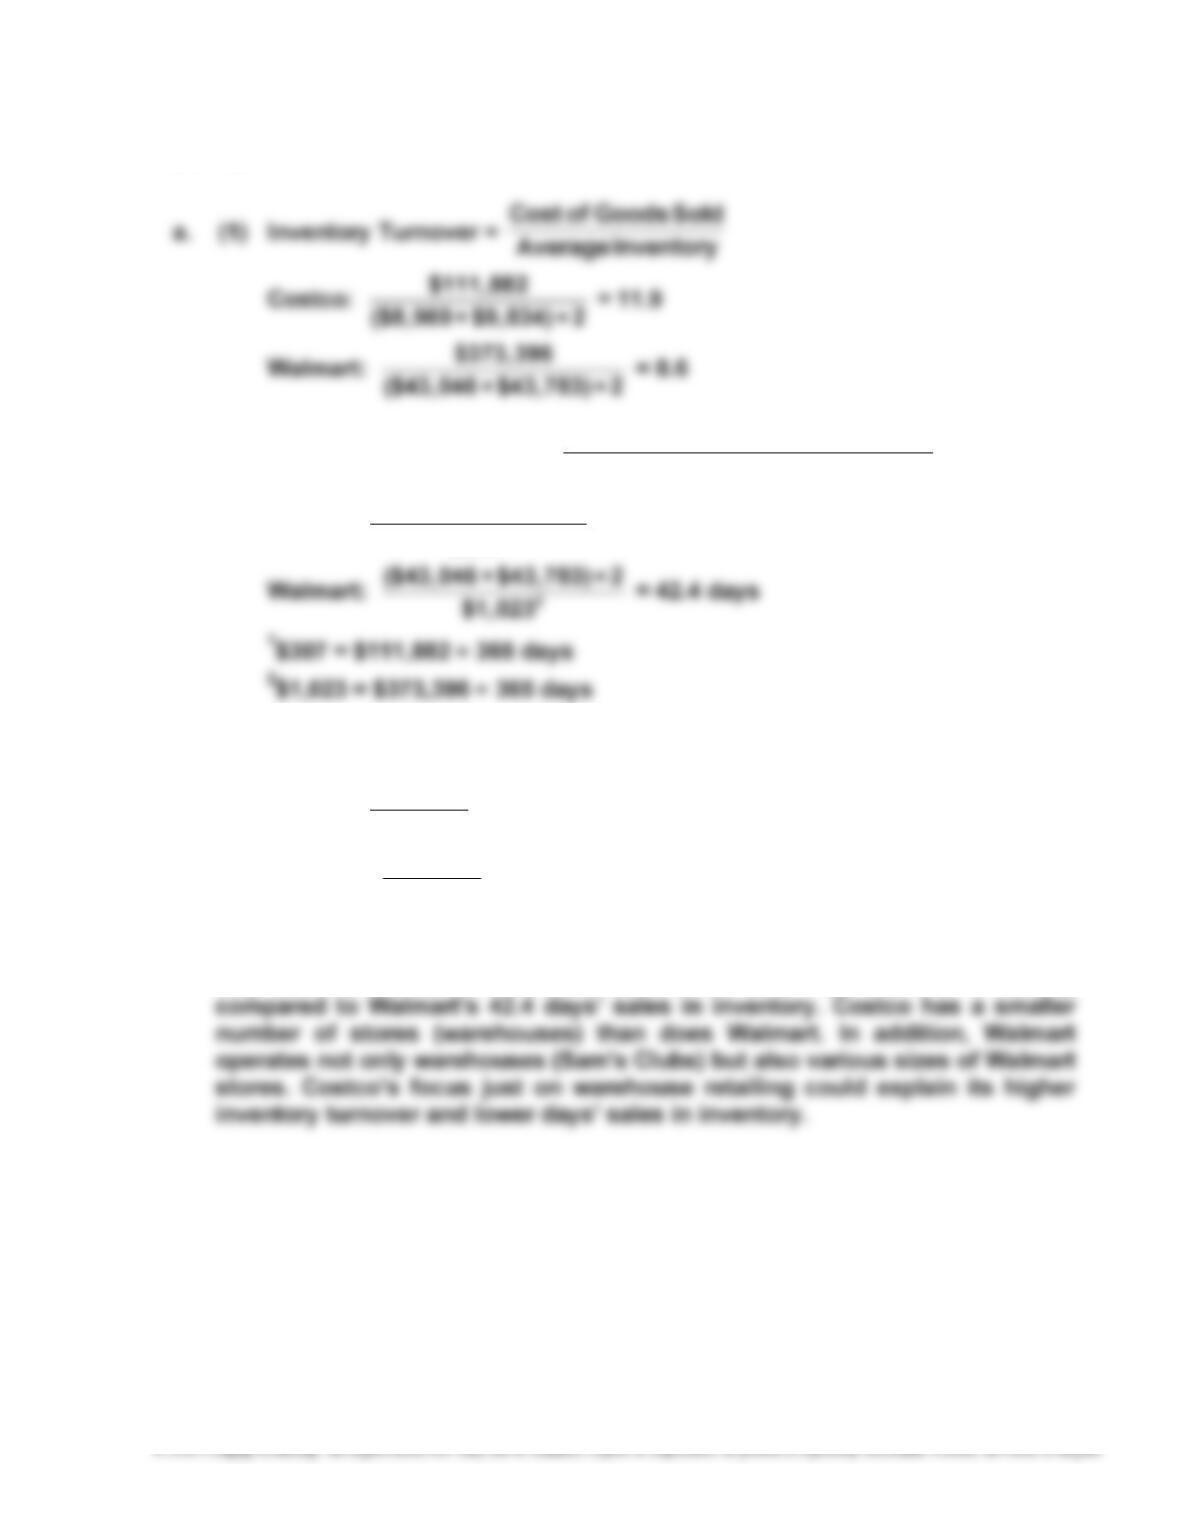
a. (1) Inventory Turnover = Inventory Average
Sold Goods ofCost
(2) Days’ Sales in Inventory = Sold Goods ofCost Daily Average
Inventory Average
Current Year: 1
$15,945
2÷)000,550$+000,420($ = 30.4 days
Preceding Year: 2
$11,795
2÷)000,420$+000,400($ = 34.8 days
1$15,945 = $5,820,000 ÷ 365 days
2$11,795 = $4,305,000 ÷ 365 days
b. The inventory position of the business has improved. The inventory turnover
has increased even as the days’ sales in inventory has decreased. The sales
volume has increased faster than the inventory has increased, thus resulting
in an improved inventory position.
267
E9–12
(2) Days’ Sales in Inventory = Sold Goods ofCost Daily Average
Inventory Average
Costco: 1
($8,969 + $9,834) ÷ 2
$307 = 30.6 days
Note: The days’ sales in inventory can also be computed by dividing 365 days
by the inventory turnover as shown below.
Costco:
365 days
11.9 = 30.7 days (difference due to rounding)
Walmart:
365 days
8.6 = 42.4 days
b. Costco has a higher inventory turnover of 11.9 compared to Walmart’s inven-
tory turnover of 8.6. As a result, Costco has 30.6 days’ sales in inventory
268
E9–13
a. Ratio of Liabilities to Stockholders’ Equity =
Total Liabilities
Total Stockholders’ Equity
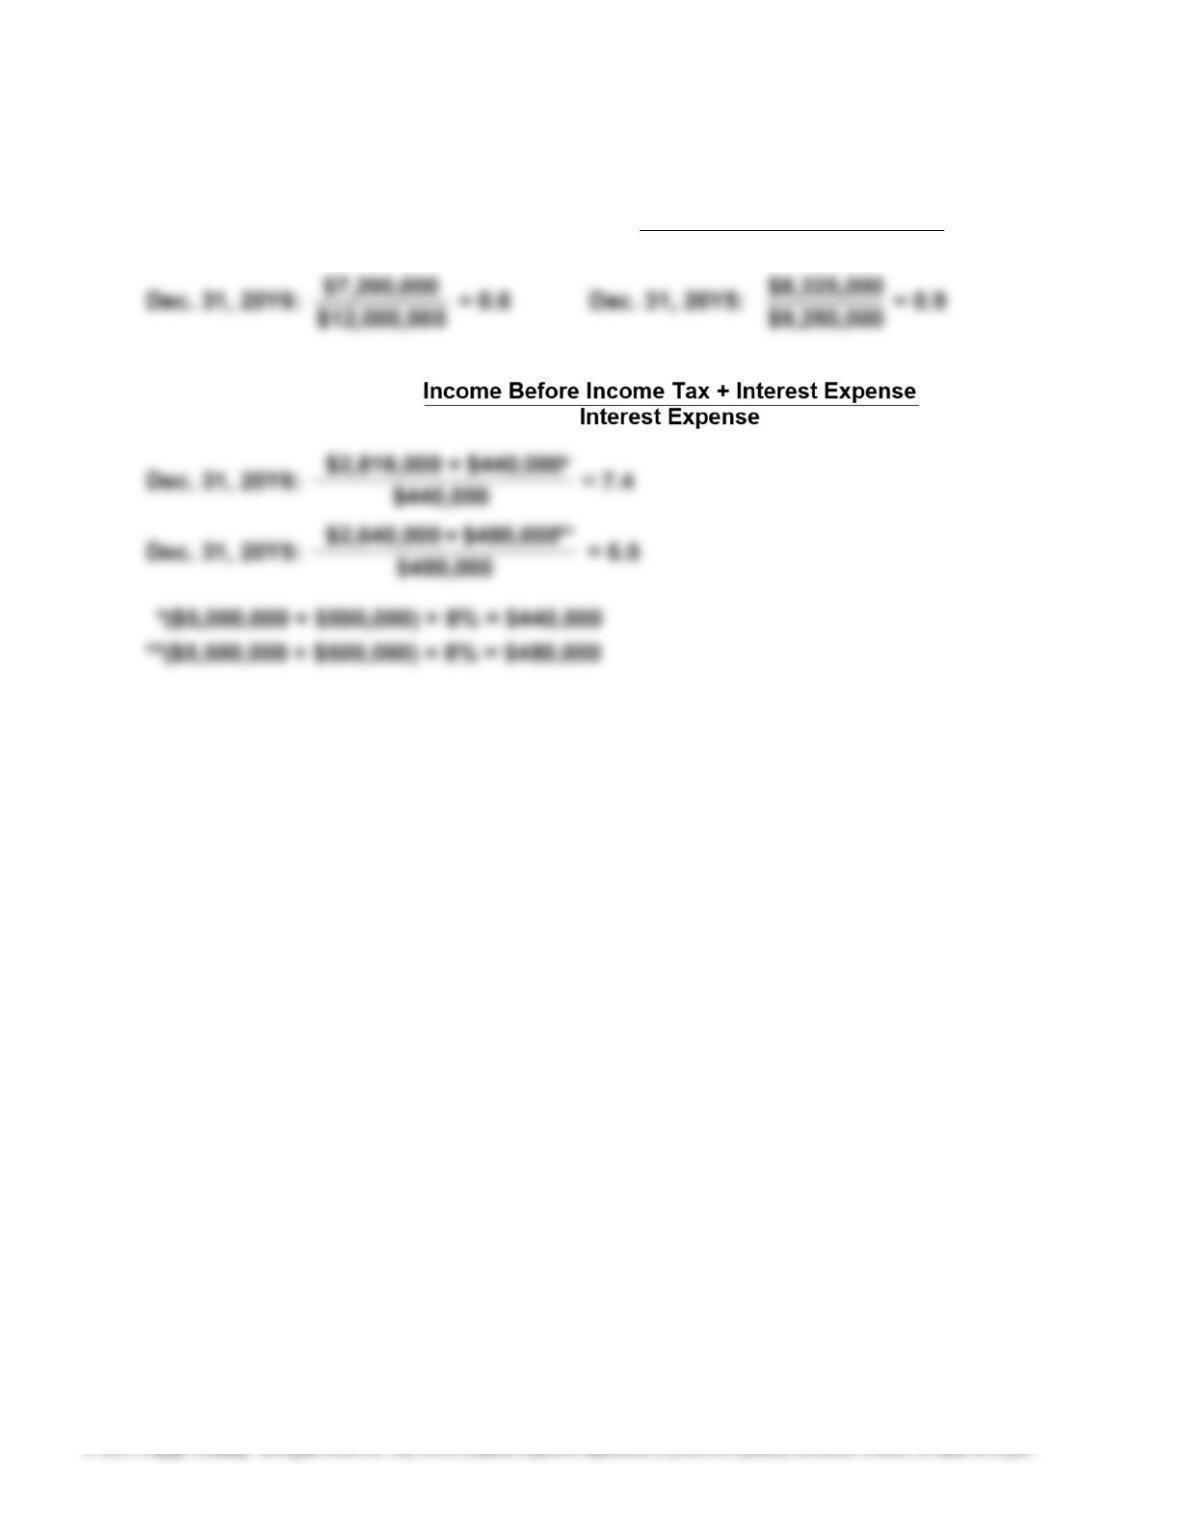
b.
Times Interest Earned
=
c. Both the ratio of liabilities to stockholders’ equity and that of the times interest
earned have improved from 20Y5 to 20Y6. These results are the combined re-
sult of a larger income before taxes and lower bonds payable in the year 20Y6
compared to 20Y5 and indicate an improvement in the company’s ability to
meet its currently maturing debt.
269
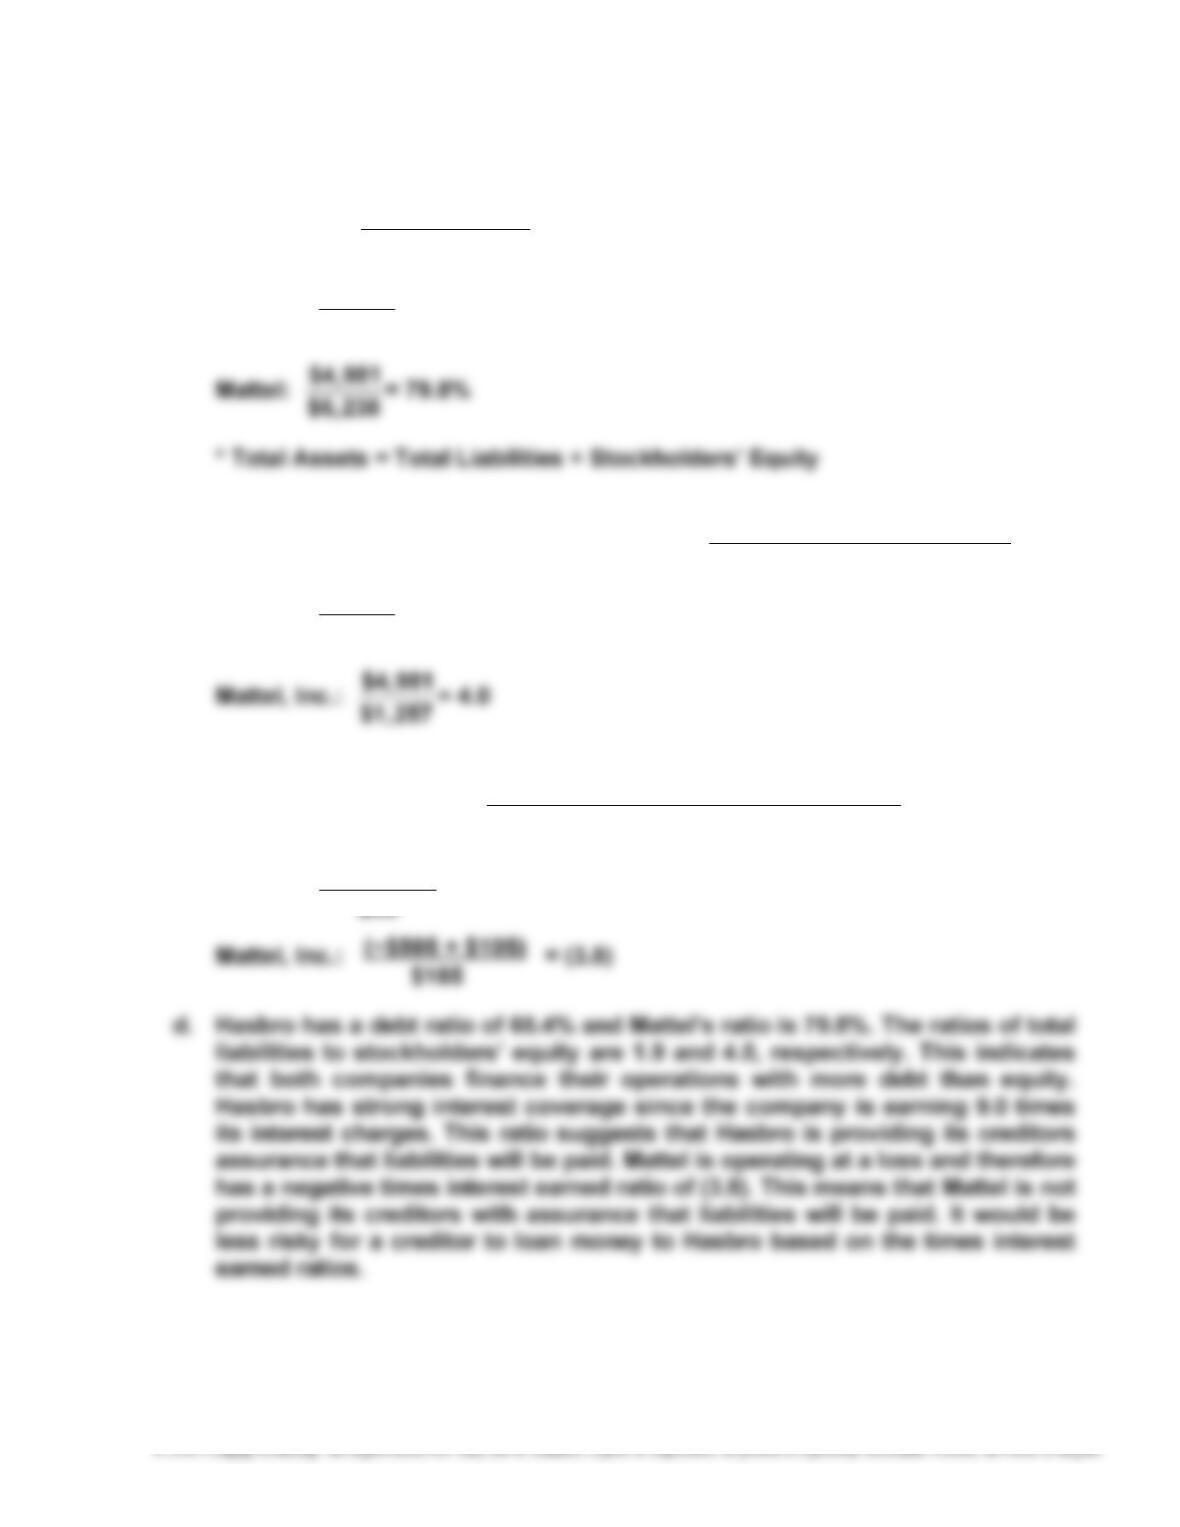
E9–14
a. Debt Ratio = Total Liabilities
Total Assets *
Hasbro:
$3,460
$5,290 = 65.4%
b. Ratio of Liabilities to Stockholders’ Equity = Equity rs’Stockholde Total
sLiabilitie Total
Hasbro:
$3,460
$1,830 = 1.9
c. Times Interest Earned = ExpenseInterest
ExpenseInterest + Tax Before Income
Hasbro:
$786 + $98
270
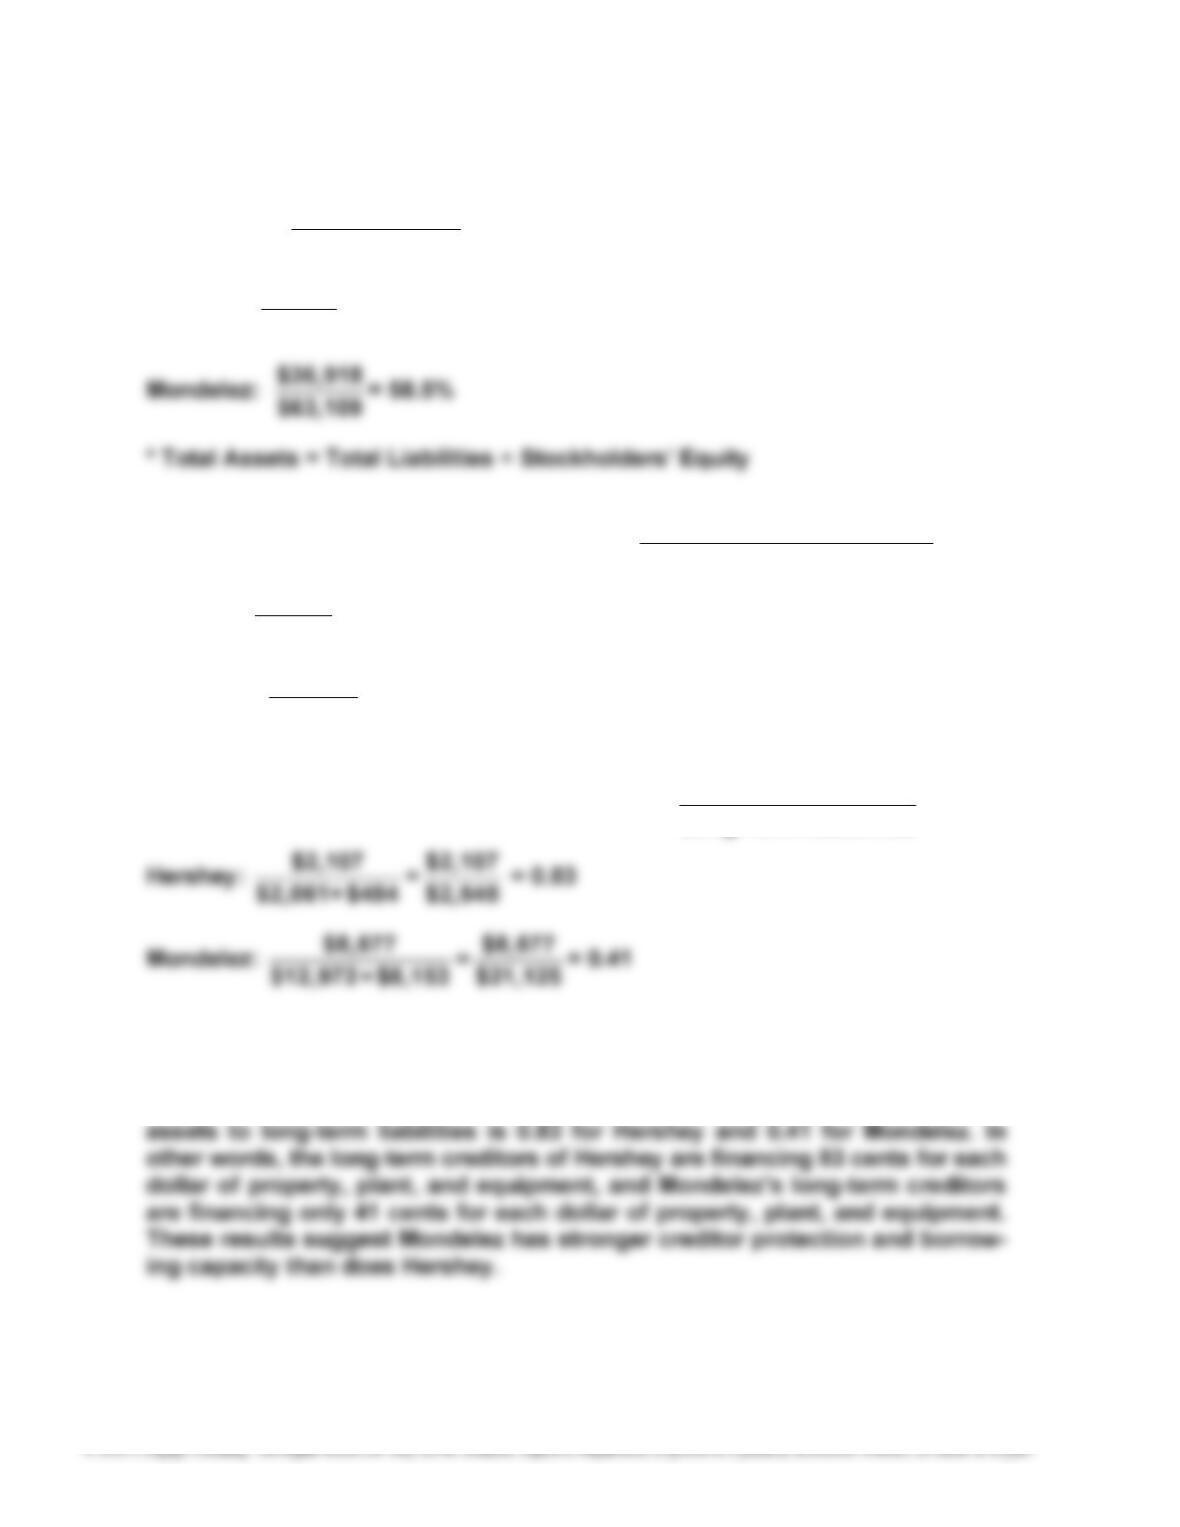
E9–15
a. Debt Ratio = Total Liabilities
Total Assets *
Hershey:
$4,622
$5,554 = 83.2%
b. Ratio of Liabilities to Stockholders’ Equity = Equity rs’Stockholde Total
sLiabilitie Total
Hershey:
$4,622
$932 = 5.0
Mondelez:
$36,918
$26,191 = 1.4
c. Ratio of Fixed Assets to Long-Term Liabilities = Fixed Assets (net)
Long-Term Liabilities
d. Hershey uses more debt than Mondelez given a debt ratio of 83.2% for Hershey
and a debt ratio of 58.5% for Mondelez. The ratio of total liabilities to stock-
holders’ equity ratio is 5.0 for Hershey and 1.4 for Mondelez. The ratio of fixed
271
E9–16
a. Asset Turnover = Sales
Average Long–Term Operating Assets
YRC Worldwide:
$4,891
$842 = 5.81
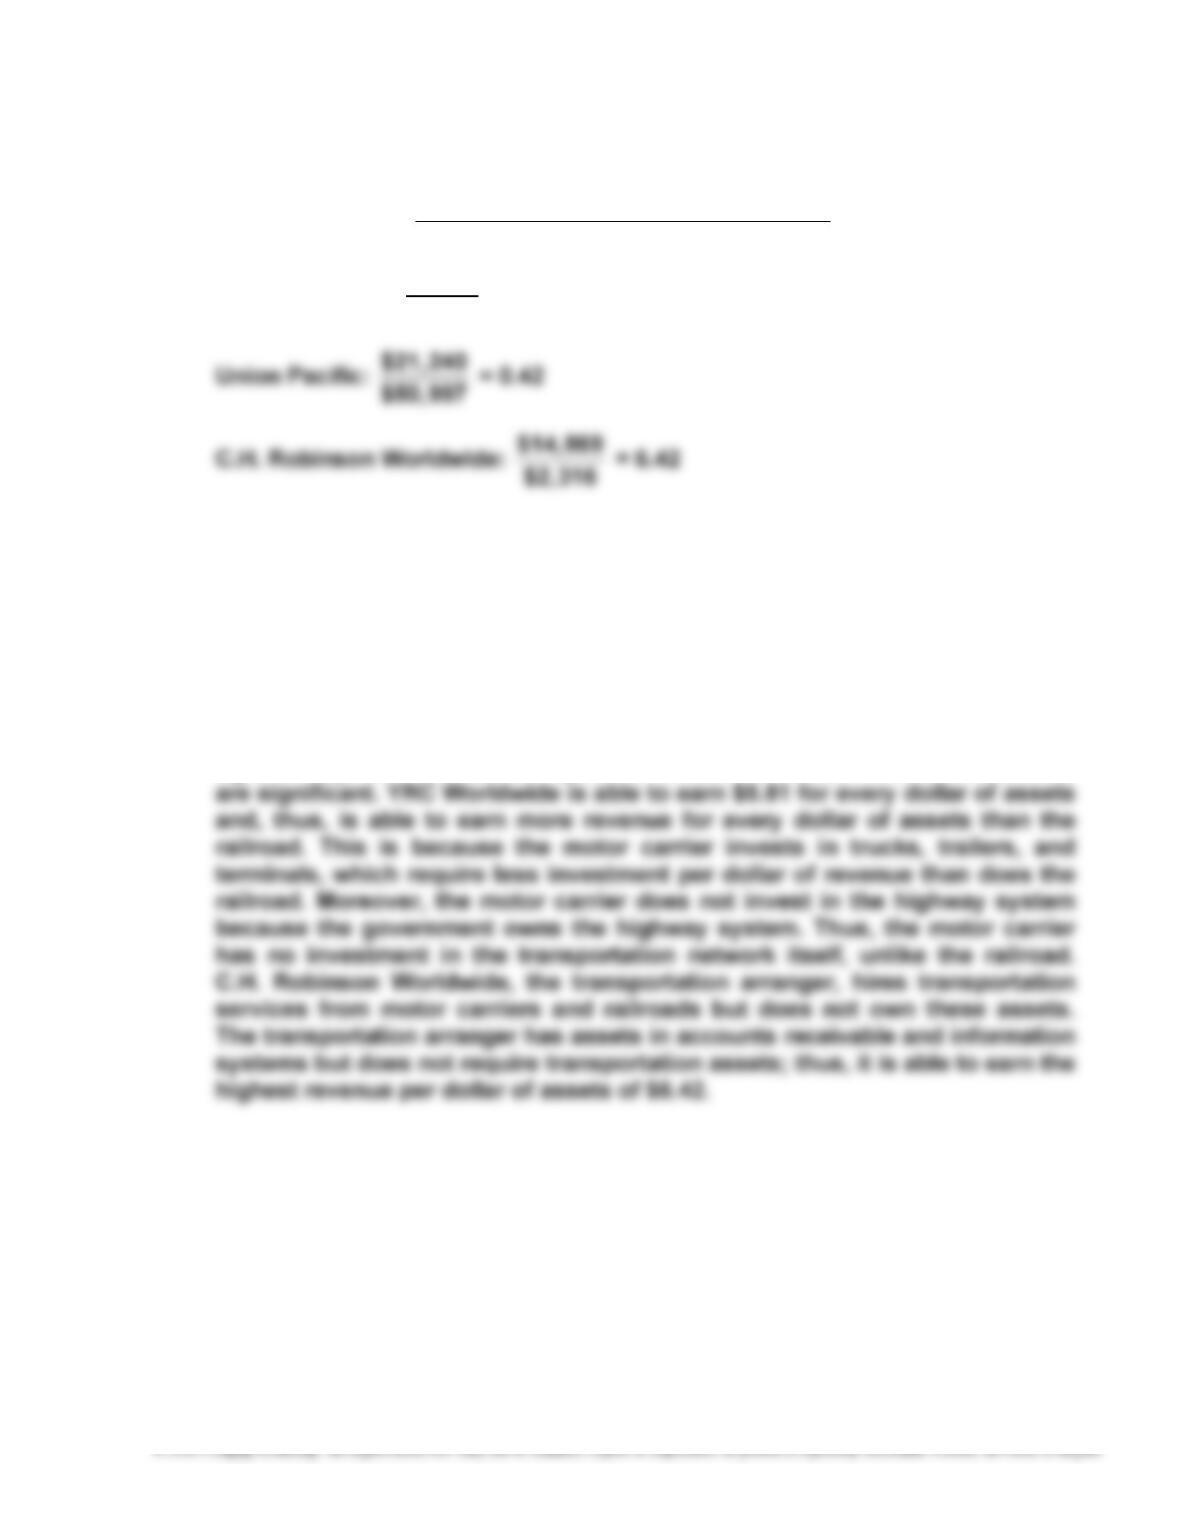
b. The asset turnover measures the number of sales dollars earned for each dol-
lar of long-term operating assets. The greater the number of sales dollars
earned for every dollar of assets, the more efficient a firm is in using assets.
Thus, the ratio is a measure of the efficiency in using assets. The three
companies are different in their efficiency in using assets because they are
different in the nature of their operations. Union Pacific earns only 42 cents
for every dollar of assets. This is because Union Pacific is asset intensive.
That is, Union Pacific must invest in locomotives, railcars, terminals, tracks,
right-of-way, and information systems to earn revenues. These investments
272
E9–16, Concluded
Note to Instructors: Students may wonder how asset-intensive companies
overcome their asset efficiency disadvantages relative to competitors with
better asset efficiencies. Asset efficiency is part of the financial equation; the
other part is the profit margin made on each dollar of sales. Thus, companies
E9–17
a. Return on Total Assets = AssetsTotal Average
ExpenseInterest + IncomeNet
*($2,100,000 + $1,600,000) ÷ 2 **($1,600,000 + $1,200,000) ÷ 2
Return on Common
Stockholders’ Equity = Equity rs’Stockholde Common Average
Dividends Preferred––IncomeNet
20Y5: *$1,450,000
$32,000–– $530,000 = 34.3% 20Y4: **$1,000,000
$32,000–– $430,000 = 39.8%
*($1,700,000 + $1,200,000) ÷ 2 **($1,200,000 + $800,000) ÷ 2
b. The profitability ratios indicate The O’Malley Group’s profitability has
273
E9–18
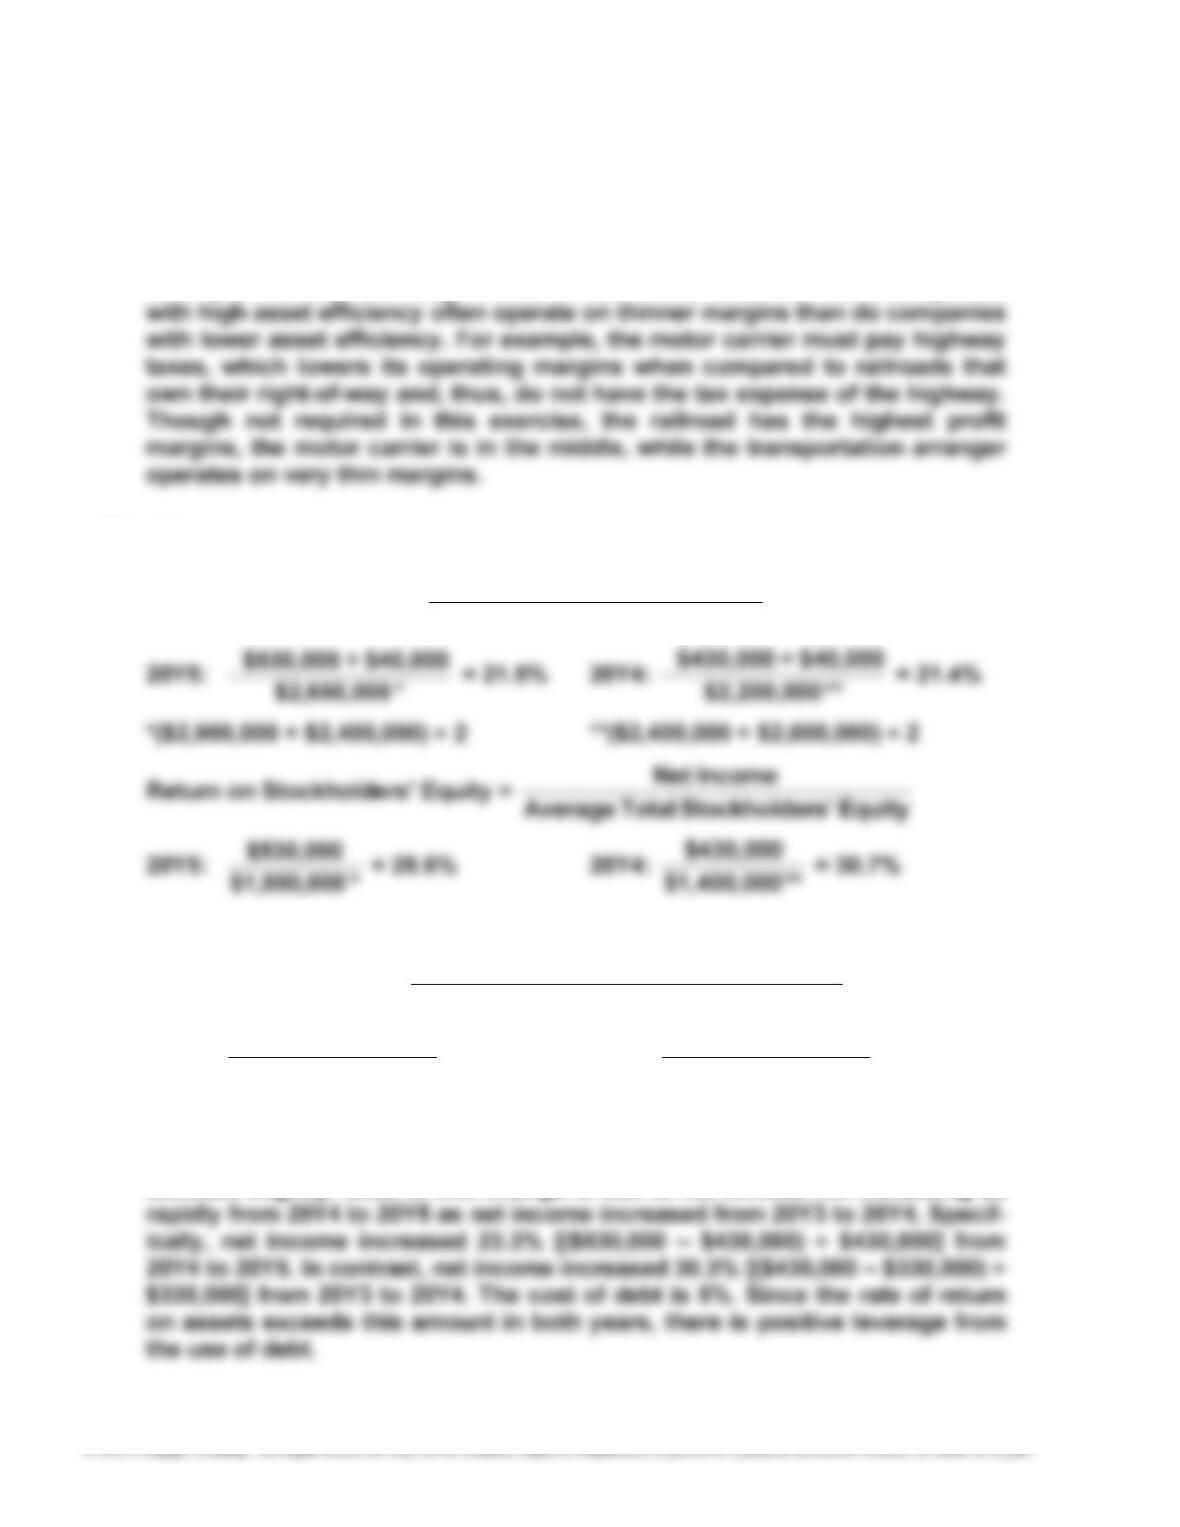
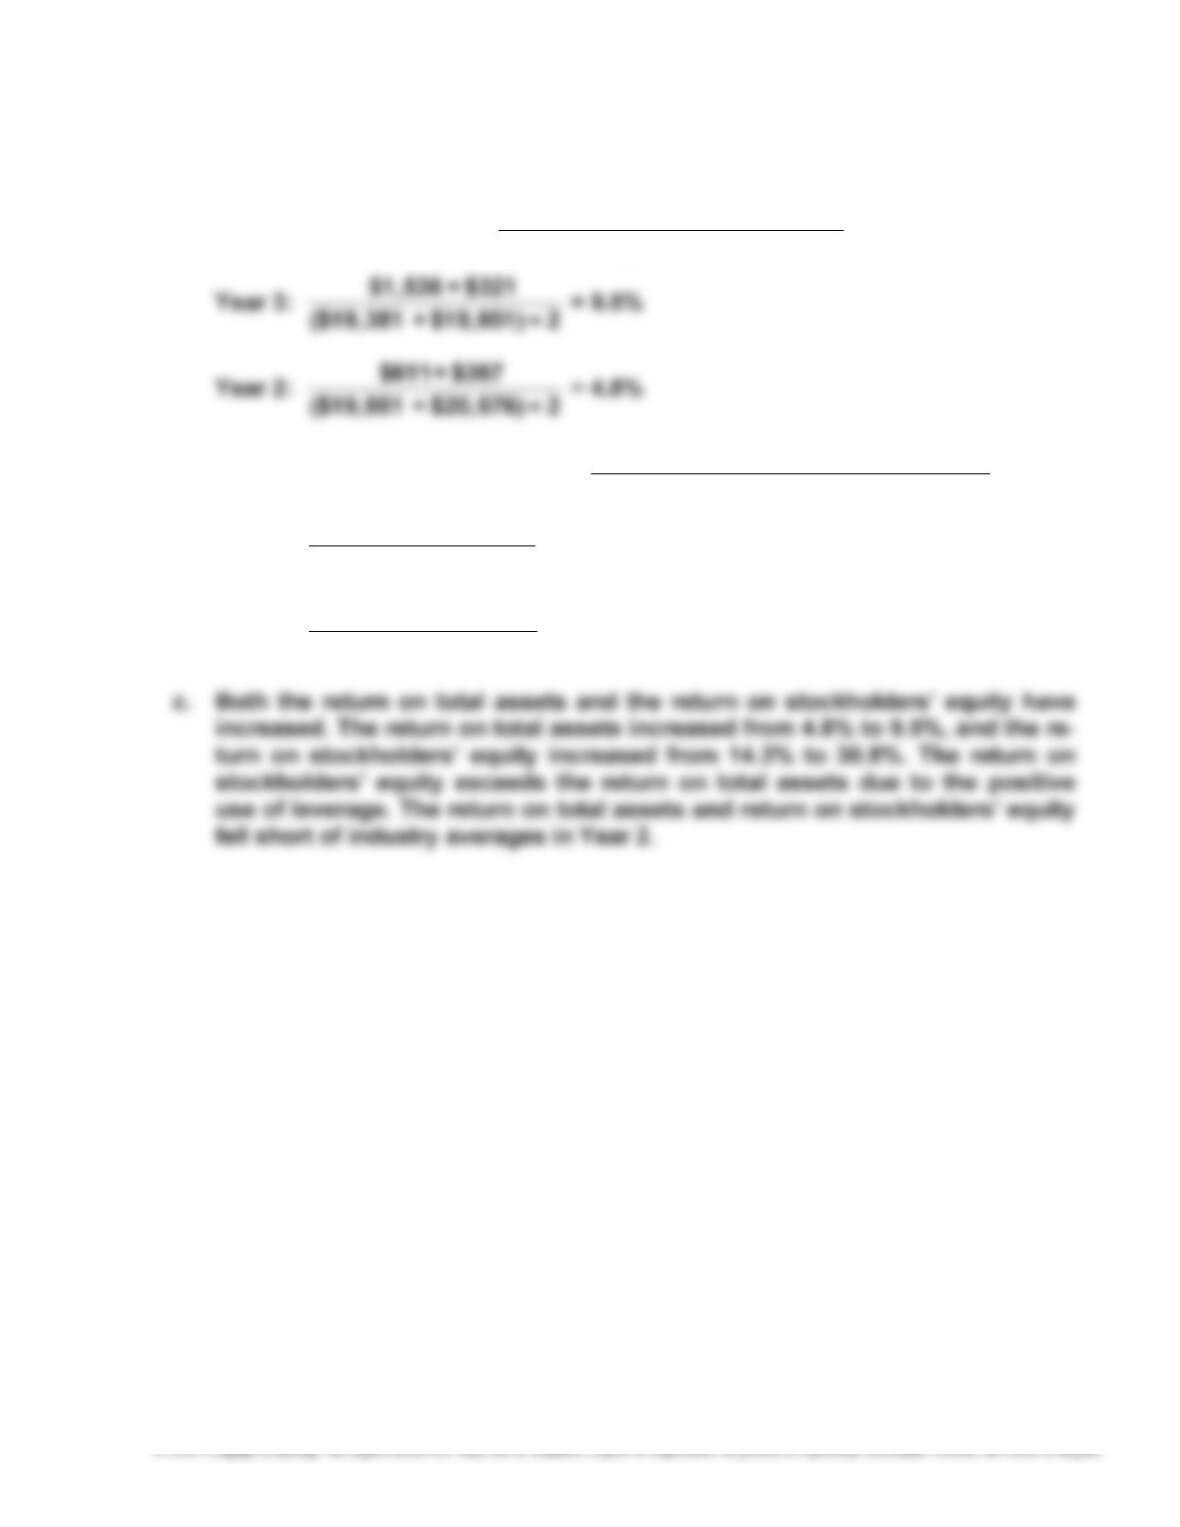
a. Return on Total Assets = AssetsTotal Average
ExpenseInterest + IncomeNet
b. Return on Stockholders’ Equity = Equity rs’Stockholde Total Average
IncomeNet
Year 3: $1,536
($5,661 + $4,322) ÷ 2 = 30.8%
Year 2: $611
($4,322 + $4,253) ÷ 2 = 14.3%
274
E9–19
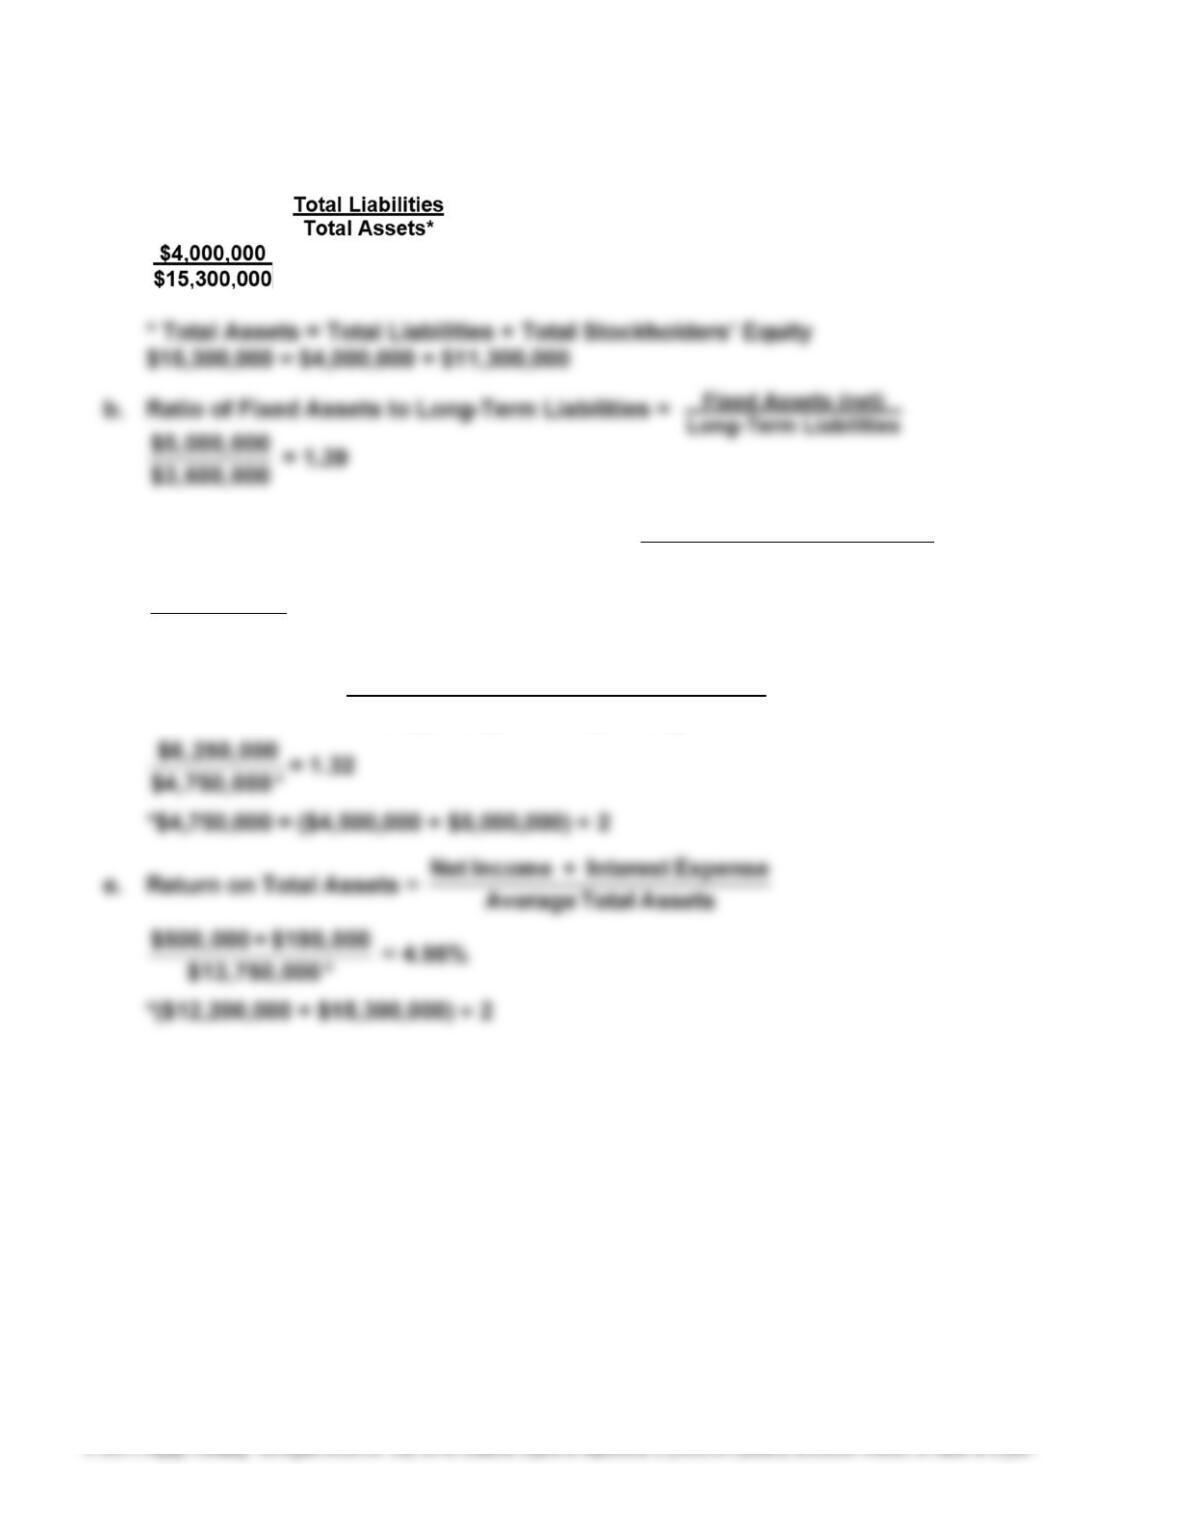
a. Debt ratio =
= 26.14%
c. Ratio of Liabilities to Stockholders’ Equity =
Equity rs’Stockholde Total
sLiabilitie Total
$4,000,000
$11,300,000
= 0.35
d. Asset Turnover =
Sales
Average Long– Term Operating Assets