204 CHAPTER 9/NONPARAMETRIC METHODS
Mann-Whitney Test and CI: Dpanph_1, Dpanph_3
N Median
Mann-Whitney Test and CI: Dpanph_1, Dpanph_4
Mann-Whitney Test and CI: Dpanph_1, Dpanph_5
N Median
9.34 We note that the problems with the data exist as were mentioned in 8.84. For hormone 2, we classify those
with dose_2= 7.5 as low-dose, and those with dose_2=15 as high-dose. No significant differences were
found.
Mann-Whitney Test and CI: Dbilsec_2_0, Dbilsec_2_1
N Median
Mann-Whitney Test and CI: Dpansec_2_0, Dpansec_2_1
N Median
Mann-Whitney Test and CI: Dpanph_2_0, Dpanph_2_1
Mann-Whitney Test and CI: Dbilsec_3_0, Dbilsec_3_1
N Median
Mann-Whitney Test and CI: Dbilph_3_0, Dbilph_3_1
CHAPTER 9/NONPARAMETRIC METHODS 205
Mann-Whitney Test and CI: Dpansec_3_0, Dpansec_3_1
N Median
Mann-Whitney Test and CI: Dpanph_3_0, Dpanph_3_1
N Median
Mann-Whitney Test and CI: Dbilsec_4_0, Dbilsec_4_1
N Median
Mann-Whitney Test and CI: Dbilph_4_0, Dbilph_4_1
N Median
Mann-Whitney Test and CI: Dpansec_4_0, Dpansec_4_1
N Median
Dpansec_4_0 18 0.000
Mann-Whitney Test and CI: Dpanph_4_0, Dpanph_4_1
Mann-Whitney Test and CI: Dbilsec_5_0, Dbilsec_5_1
N Median
Dbilsec_5_0 47 0.200
Mann-Whitney Test and CI: Dbilph_5_0, Dbilph_5_1
N Median
Dbilph_5_0 47 0.000
Mann-Whitney Test and CI: Dpansec_5_0, Dpansec_5_1
N Median
206 CHAPTER 9/NONPARAMETRIC METHODS
9.35 Comparing question 9.32 with 8.70, the set of comparisons which yielded significant p-values for each
question were identical. While the p-values themselves were not identical across tests, the qualitative results
9.37 We first calculate the itching score for the active eye minus the itching score for the placebo eye for each
patient as shown below:
Subject Efficacy score*
1 -1
2 0
CHAPTER 9/NONPARAMETRIC METHODS 207
9.39-9.40 To answer these questions, we again create the variables fnD = fn1-fn2, and fsD = fs1-fs2. We then use
MINITAB to perform a signed-rank test for each variable.
Wilcoxon Signed Rank Test: fnD, fsD
Test of median = 0.000000 versus median not = 0.000000
9.41 We will use the Wilcoxon signed rank test based on the difference scores defined by Number of palpable
lymph nodes Doctor A – Number of palpable lymph nodes Doctor B. The distribution of difference scores
d
i
is as follows:
Absolute
Value
Positive
di
Negative
diTotal
Rank
Range
Average
Range
10 1 0 1 29 29.0
8 1 0 1 28 28.0
Thus, the test statistic is
208 CHAPTER 9/NONPARAMETRIC METHODS
9.43 We rank the data in the combined sample of 16 plants as follows:
Value
Frequency in
I group
Frequency in
U group Rank
0.49 0 1 1
0.75 0 1 2
0.85 0 1 3
0.92 0 1 4
1.00 0 1 5
9.44 In Problem 8.113, we used a two-sample t-test and found that .02 < p < .05. In Problem 9.45, we also
9.45 Since each person is being used as their own control, we use the paired t test to test the hypothesis
9.46 We have the test statistic:
CHAPTER 9/NONPARAMETRIC METHODS 209
9.48 To implement this test, we first sort the data by absolute value as follows:
i
‘0
i
‘! 0
i
‘ Total
rank
range
average
rank
0.3 1 0 1 1 1
1.8 0 1 1 2 2
2.2 1 0 1 3 3
2.7 0 1 1 4 4
3.5 1 0 1 5 5
210 CHAPTER 9/NONPARAMETRIC METHODS
9.50 We compute the rank sum (R1) in the Caucasian group (ethnic group = 0). We have
The expected value of R1 is
Hence, the test statistic is given by
9.51 We run the following R code to estimate the p-value for the Wilcoxon rank sum test using the
permutation tests methods
CHAPTER 9/NONPARAMETRIC METHODS 211
9.53 We first perform the F test for the equality of 2 variances. We have:
9.54 We have the test statistic
The approximate degrees of freedom is given by
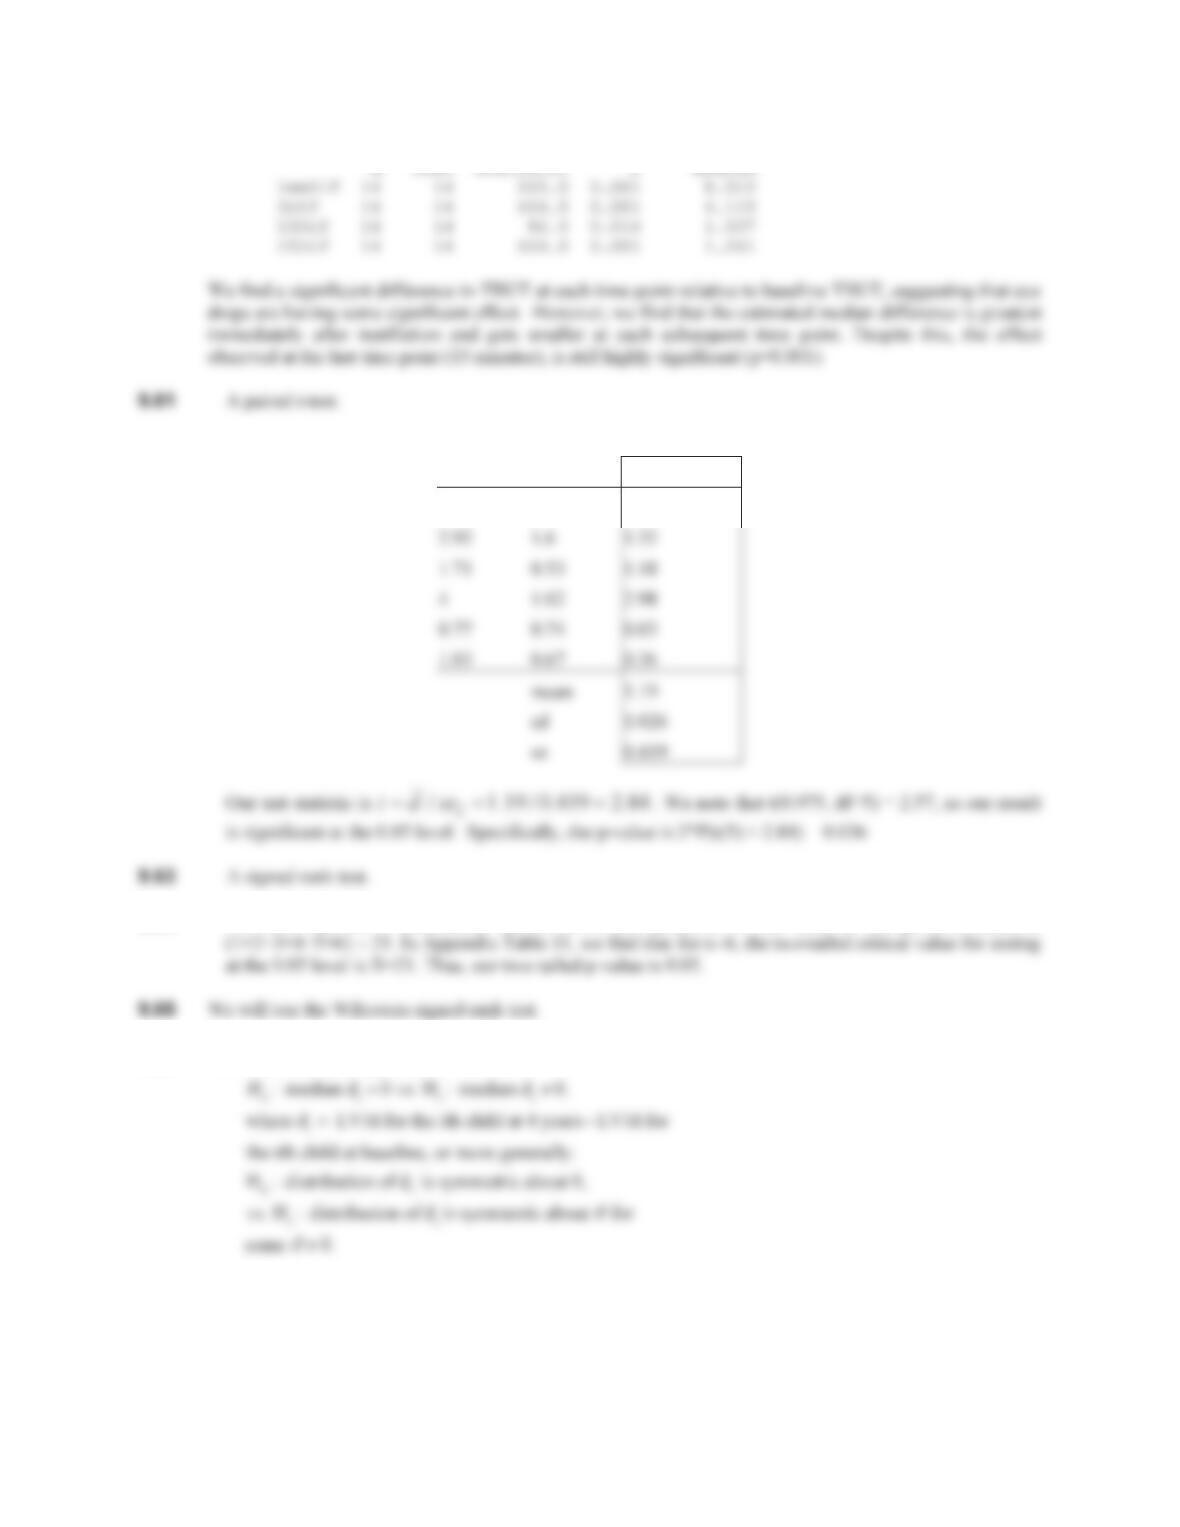
9.56-9.60 Once we create average the TBUT scores for each time point, and create our 4 difference scores relating
Wilcoxon Signed Rank Test: ImmDif, 5Dif, 10Dif, 15Dif
212 CHAPTER 9/NONPARAMETRIC METHODS
N for Wilcoxon Estimated
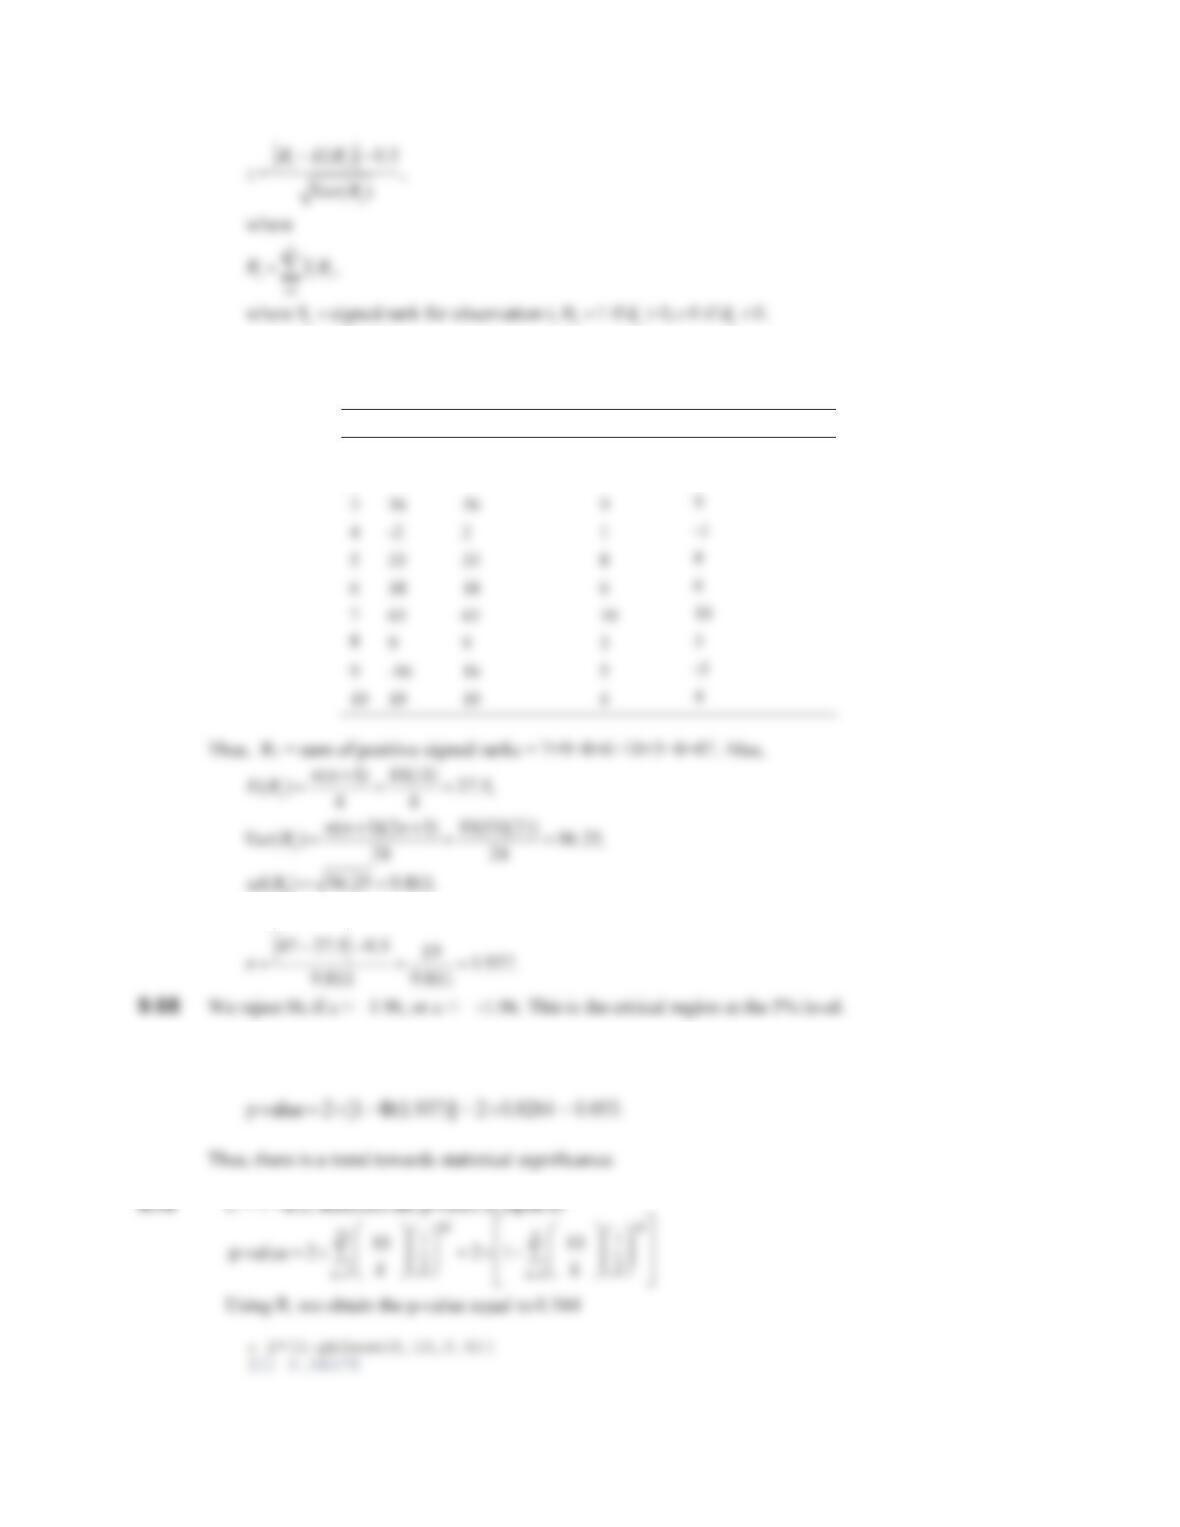
9.62 Our data is shown below.
High-Fat Low-Fat Difference
2.55 1.27 1.28
9.64 We note that all 6 differences shown above are positive, so the sum of the positive ranks is
9.66 We wish to test the hypotheses:
9.67 The test statistic is:
CHAPTER 9/NONPARAMETRIC METHODS 213
To compute signed ranks, we first rank the data points by absolute value and then attach the sign of
observation to this rank as shown in the table below.
ID change Absolute value Rank (Ri)Signed Rank (Si)
1 24 24 7 7
2 -8 8 2 -2
1
Thus,
9.69 The p-value is given by:
214 CHAPTER 9/NONPARAMETRIC METHODS
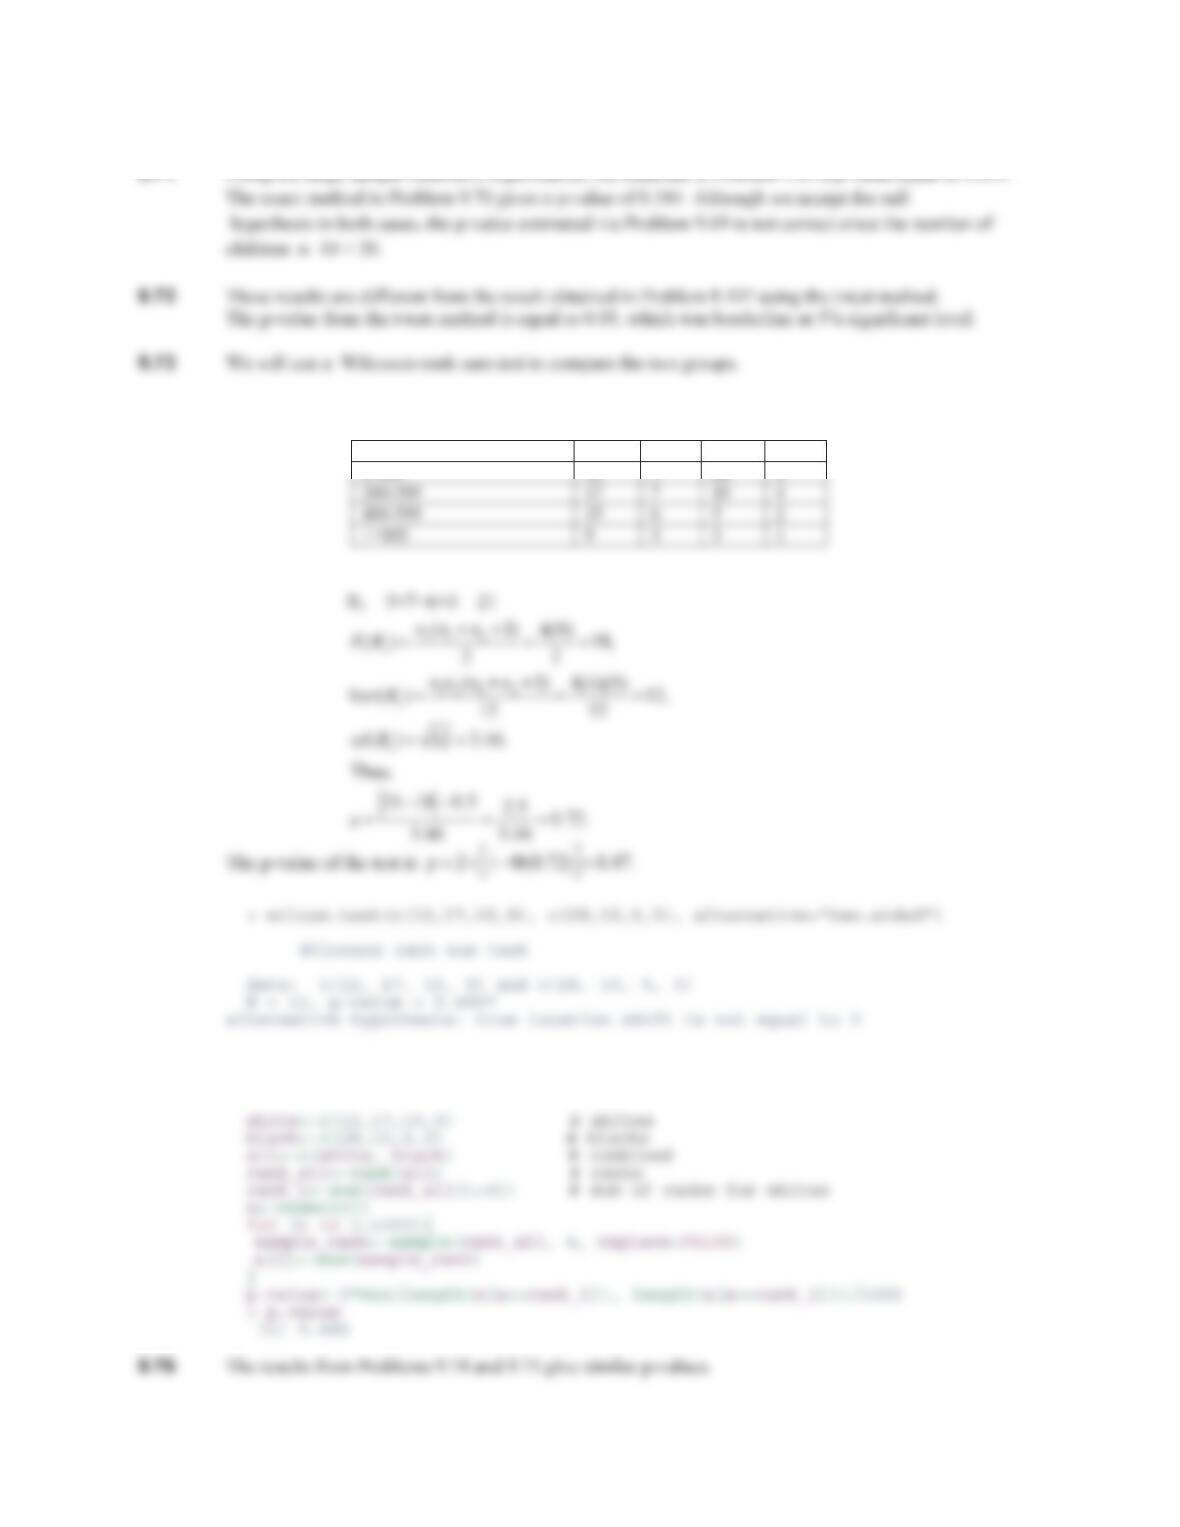
9.74 Table 9.19: Plasma aldosterone levels in 43 white and black children
Aldosterone group (pmol/l) White Rank Black Rank
0-199 12 5 28 8
9.75 We use the following R code

CHAPTER 9/NONPARAMETRIC METHODS 215