CHAPTER 22 (FIN MAN); CHAPTER 8 (MAN) Budgeting
Prob. 22–3A (FIN MAN); Prob. 8–3A (MAN)
1.
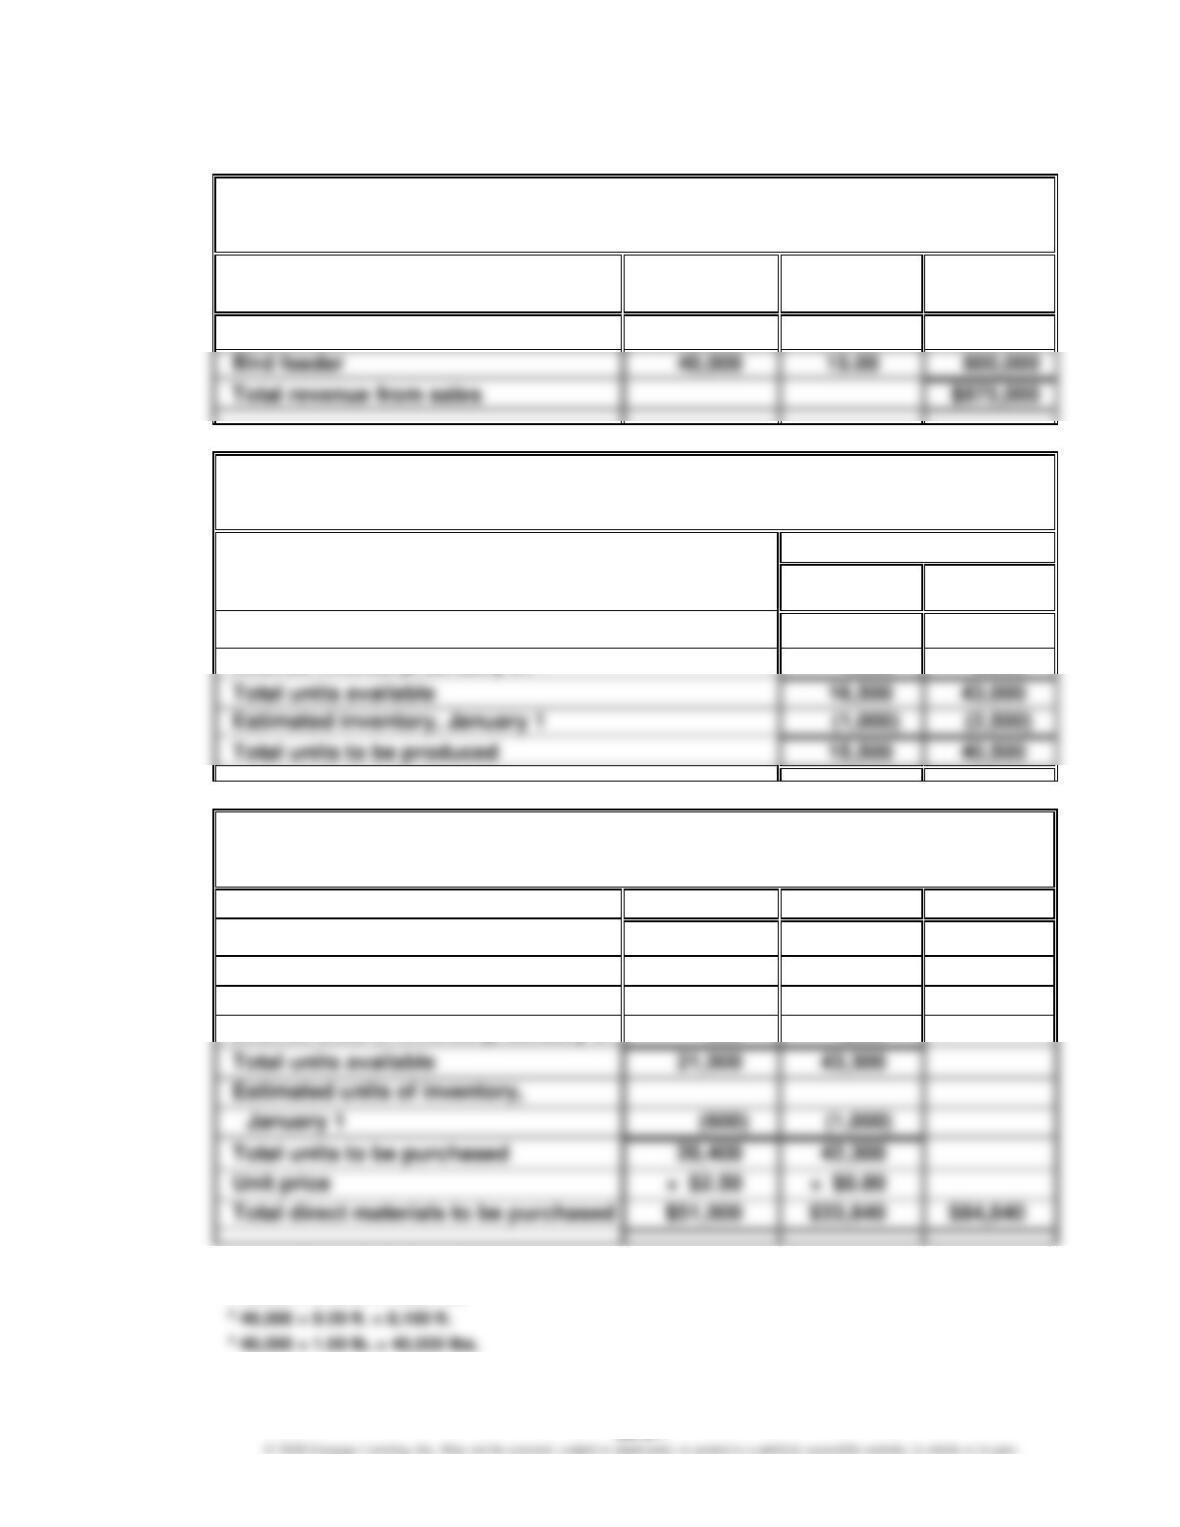
Birding Homes & Feeders Inc.
Sales Budget
For the Month Ending January 31
Unit Sales
Volume
Unit Selling
Price
Total Sales
Bird house
15,000
$25.00
$375,000
Bird feeder
Total revenue from sales
2.
Birding Homes & Feeders Inc.
Production Budget
For the Month Ending January 31
Units
Bird
House
Bird
Feeder
Expected units to be sold
15,000
40,000
Total units available
16,500
Estimated inventory, January 1
Total units to be produced
15,500
Desired inventory, January 31
1,500
3,000
3.
Birding Homes & Feeders Inc.
Direct Materials Purchases Budget
For the Month Ending January 31
Wood
Plastic
Total
Required units for production:
Bird house
12,4001
1,5502
Bird feeder
8,1003
40,5004
Total direct materials to be purchased
Desired units of inventory, January 31
500
1,250
1 15,500 × 0.80 ft. = 12,400 ft.
2 15,500 × 0.10 lb. = 1,550 lbs.
CHAPTER 22 (FIN MAN); CHAPTER 8 (MAN) Budgeting
Prob. 22–3A (FIN MAN); Prob. 8–3A (MAN) (Continued)
4.
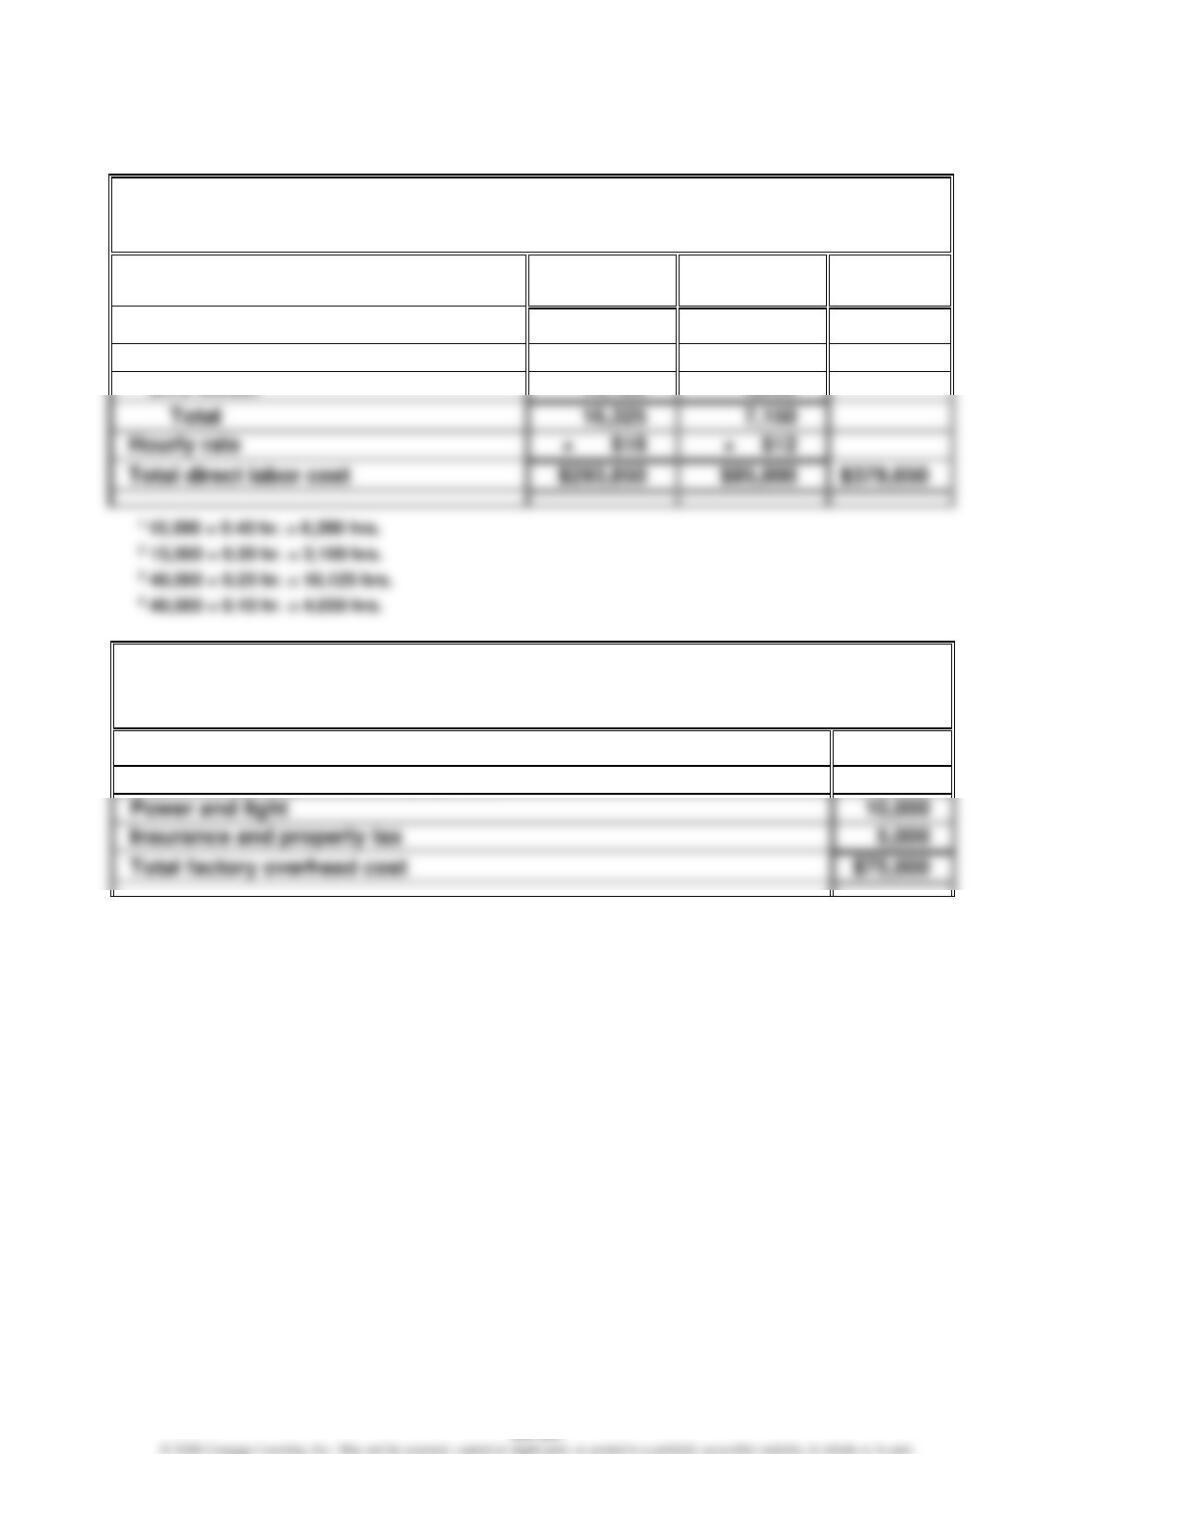
Birding Homes & Feeders Inc.
Direct Labor Cost Budget
For the Month Ending January 31
Fabrication
Department
Assembly
Department
Total
Hours required for production:
Bird house
6,2001
3,1002
Bird feeder
5.
Birding Homes & Feeders Inc.
Factory Overhead Cost Budget
For the Month Ending January 31
Indirect factory wages
$40,000
Depreciation of plant and equipment
20,000
Power and light
10,000
Insurance and property tax
Total factory overhead cost
CHAPTER 22 (FIN MAN); CHAPTER 8 (MAN) Budgeting
Prob. 22–3A (FIN MAN); Prob. 8–3A (MAN) (Continued)
6.
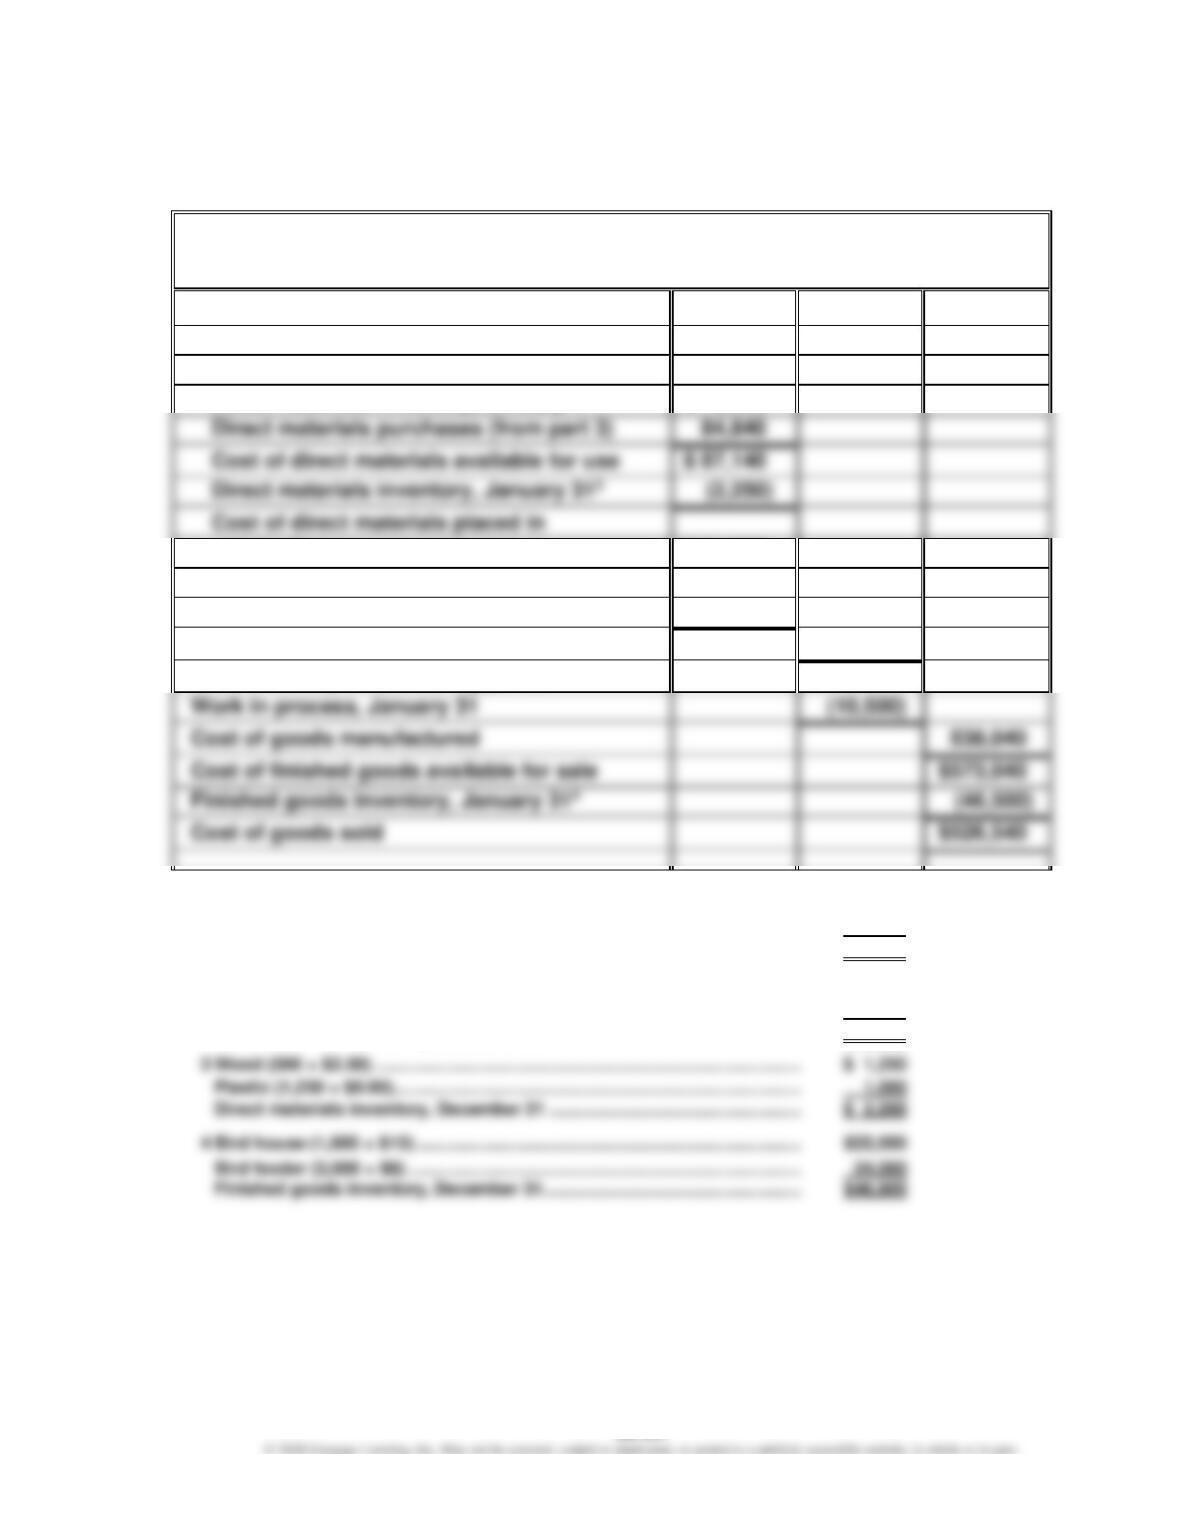
Birding Homes & Feeders Inc.
Cost of Goods Sold Budget
For the Month Ending January 31
Finished goods inventory, January 11
$ 35,000
Work in process inventory, January 1
$ 9,000
Direct materials:
Direct materials inventory, January 12
$ 2,300
Direct materials inventory, January 313
production
$ 84,890
Direct labor (from part 4)
379,650
Factory overhead (from part 5)
75,000
Total manufacturing costs
539,540
Total work in process during period
$548,540
Cost of finished goods available for sale
1
Bird house (1,000 × $15) …………………………………………………………………….
$15,000
Bird feeder (2,500 × $8) ………………………………………………………………………
20,000
Finished goods inventory, December 1 ……………………………………………….
$35,000
2
Wood (600 × $2.50) …………………………………………………………………………….
$ 1,500
Plastic (1,000 × $0.80)…………………………………………………………………………
800
Direct materials inventory, December 1 …………………………..………………….
$ 2,300
CHAPTER 22 (FIN MAN); CHAPTER 8 (MAN) Budgeting
Prob. 22–3A (FIN MAN); Prob. 8–3A (MAN) (Concluded)
7.
Birding Homes & Feeders Inc.
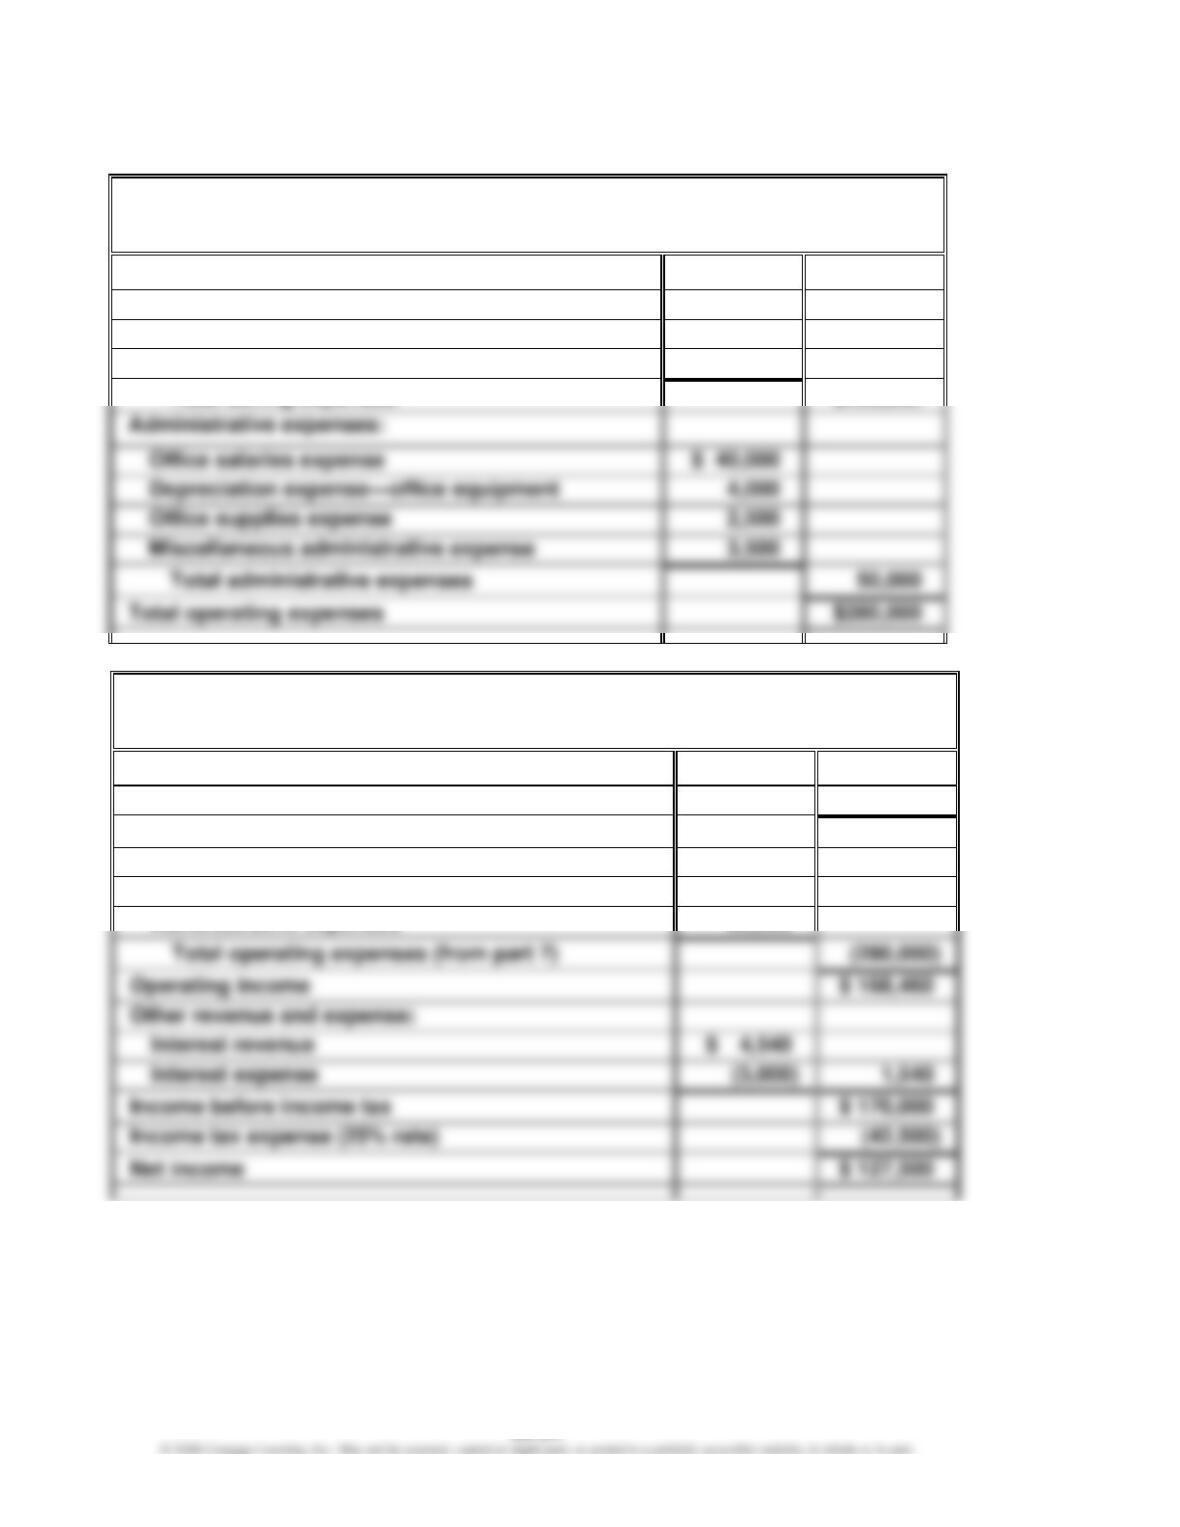
Selling and Administrative Expenses Budget
For the Month Ending January 31
Selling expenses:
Sales salaries expense
$125,000
Advertising expense
80,000
Travel expense—selling
25,000
$230,000
Depreciation expense—office equipment
Office supplies expense
Miscellaneous administrative expense
50,000
8.
Birding Homes & Feeders Inc.
Budgeted Income Statement
For the Month Ending January 31
Revenue from sales (from part 1)
$ 975,000
Cost of goods sold (from part 6)
(526,540)
Gross profit
$ 448,460
Operating expenses:
Selling expenses (from part 7)
$230,000
Administrative expenses
50,000
(280,000)
Operating income
$ 168,460
Other revenue and expense:
Interest revenue
Interest expense
Income tax expense (25% rate)
CHAPTER 22 (FIN MAN); CHAPTER 8 (MAN) Budgeting
Prob. 22–4A (FIN MAN); Prob. 8–4A (MAN)
1.
Bellaire Inc.
Sales Budget
For the First Quarter Ending March 31
January
February
March
First Quarter
Estimated units sold
$3,125,000
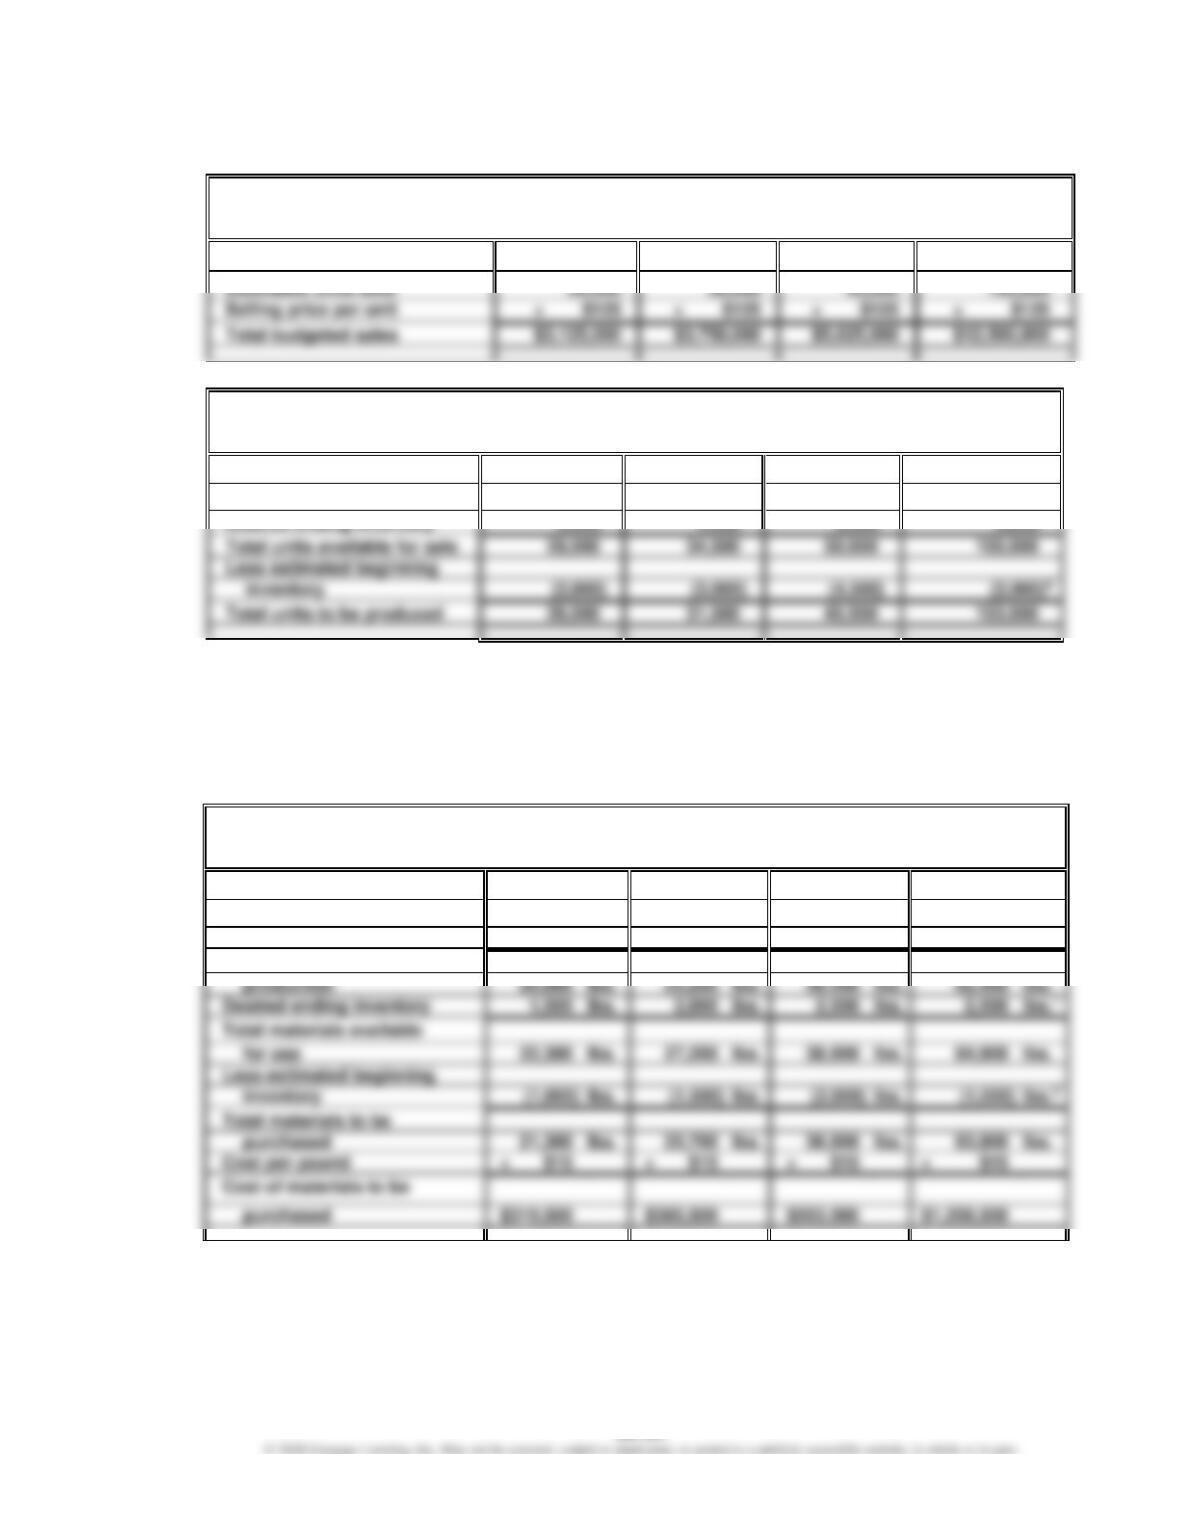
2.
Bellaire Inc.
Production Budget
For the First Quarter Ending March 31
January
February
March
First Quarter
Estimated units sold
25,000
30,000
45,000
100,000
Less estimated beginning
inventory
1 30,000 units × 10% = 3,000 units
2 45,000 units × 10% = 4,500 units
3 50,000 units × 10% = 5,000 units
4 Ending finished goods inventory as of March 31, the end of the first quarter.
5 Beginning finished goods inventory as of January 1, the beginning of the first quarter.
3.
Bellaire Inc.
Direct Materials Purchases Budget
For the First Quarter Ending March 31
January
February
March
First Quarter
Units to be produced
26,000
31,500
45,500
103,000
Materials required per unit
× 0.8
lb.
× 0.8
lb.
× 0.8
lb.
× 0.8
lb.
Materials required for
production
Desired ending inventory
2,500
22,300
38,900
Less estimated beginning
(2,000)
Total materials to be
1 Ending materials inventory as of March 31, the end of the first quarter.
2 Beginning materials inventory as of January 1, the beginning of the first quarter.
CHAPTER 22 (FIN MAN); CHAPTER 8 (MAN) Budgeting
Prob. 22–4A (FIN MAN); Prob. 8–4A (MAN) (Continued)
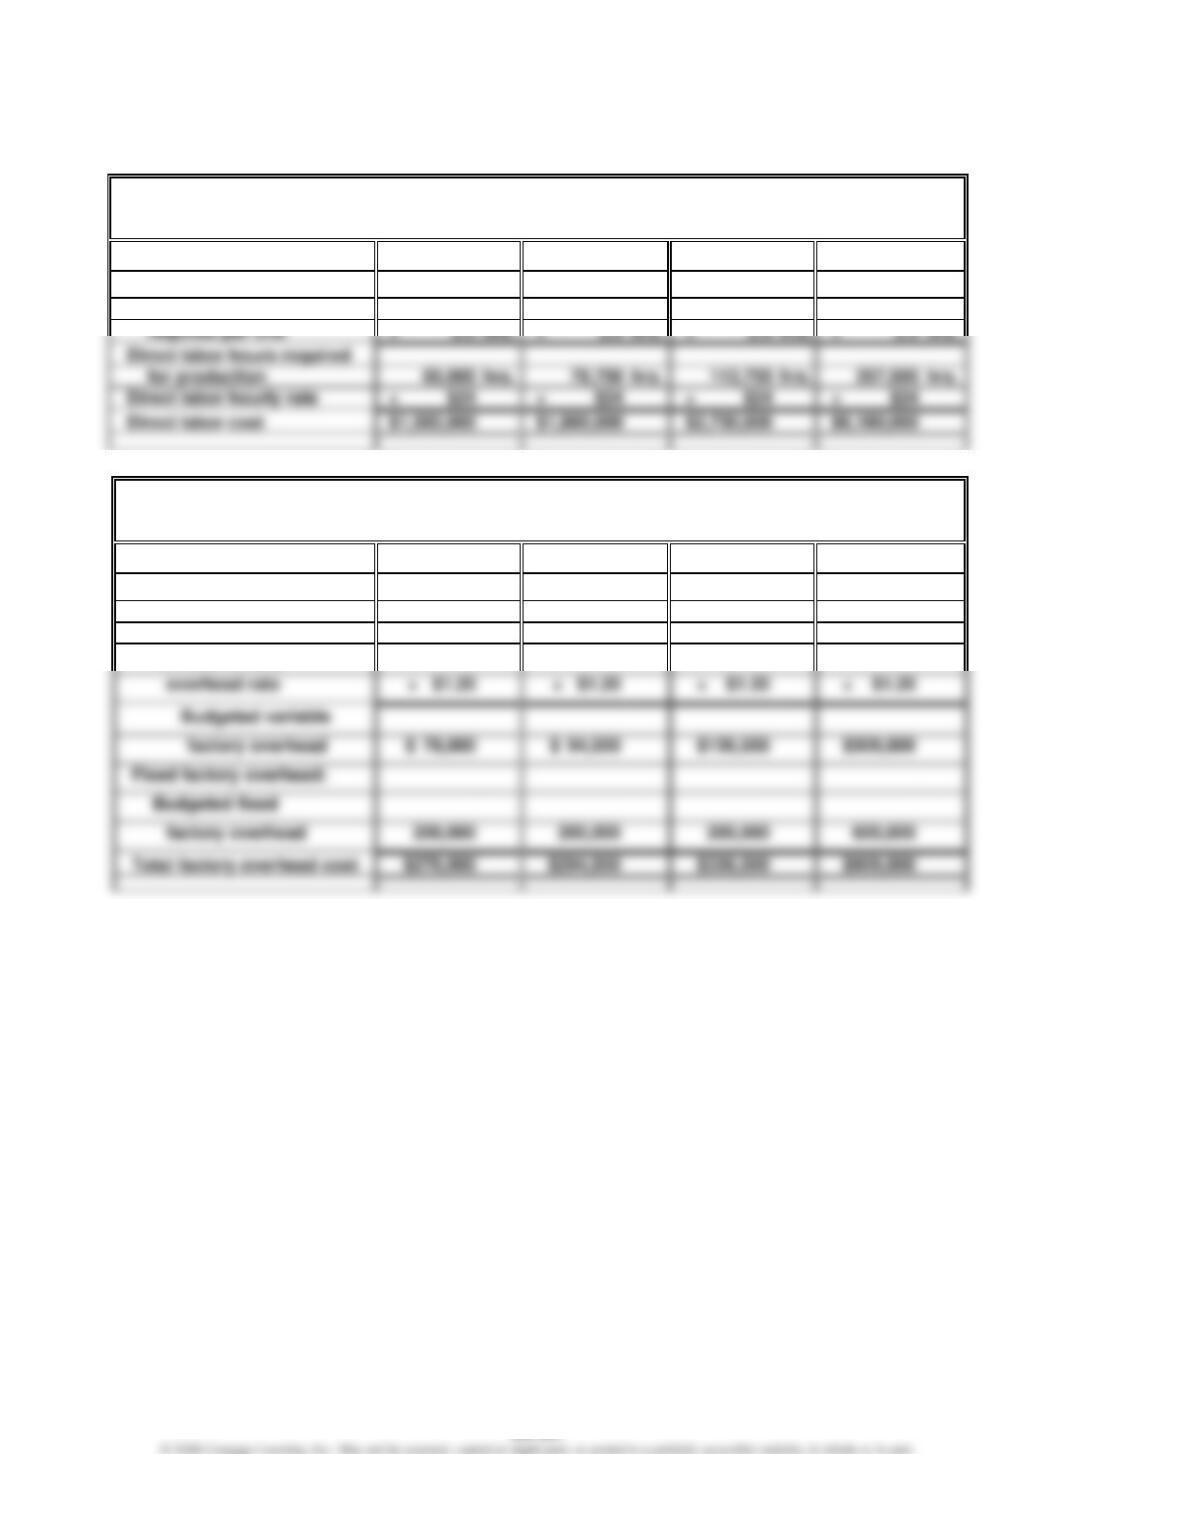
4.
Bellaire Inc.
Direct Labor Cost Budget
For the First Quarter Ending March 31
January
February
March
First Quarter
Units to be produced
26,000
31,500
45,500
103,000
Direct labor hours
required per unit
hrs.
hrs.
hrs.
hrs.
Direct labor hours required
Direct labor hourly rate
Direct labor cost
5.
Bellaire Inc.
Factory Overhead Cost Budget
For the First Quarter Ending March 31
January
February
March
First Quarter
Variable factory overhead:
Budgeted direct labor
hours
65,000
hrs.
78,750
hrs.
113,750
hrs.
257,500
hrs.
Variable factory
Total factory overhead cost
CHAPTER 22 (FIN MAN); CHAPTER 8 (MAN) Budgeting
Prob. 22–4A (FIN MAN); Prob. 8–4A (MAN) (Continued)
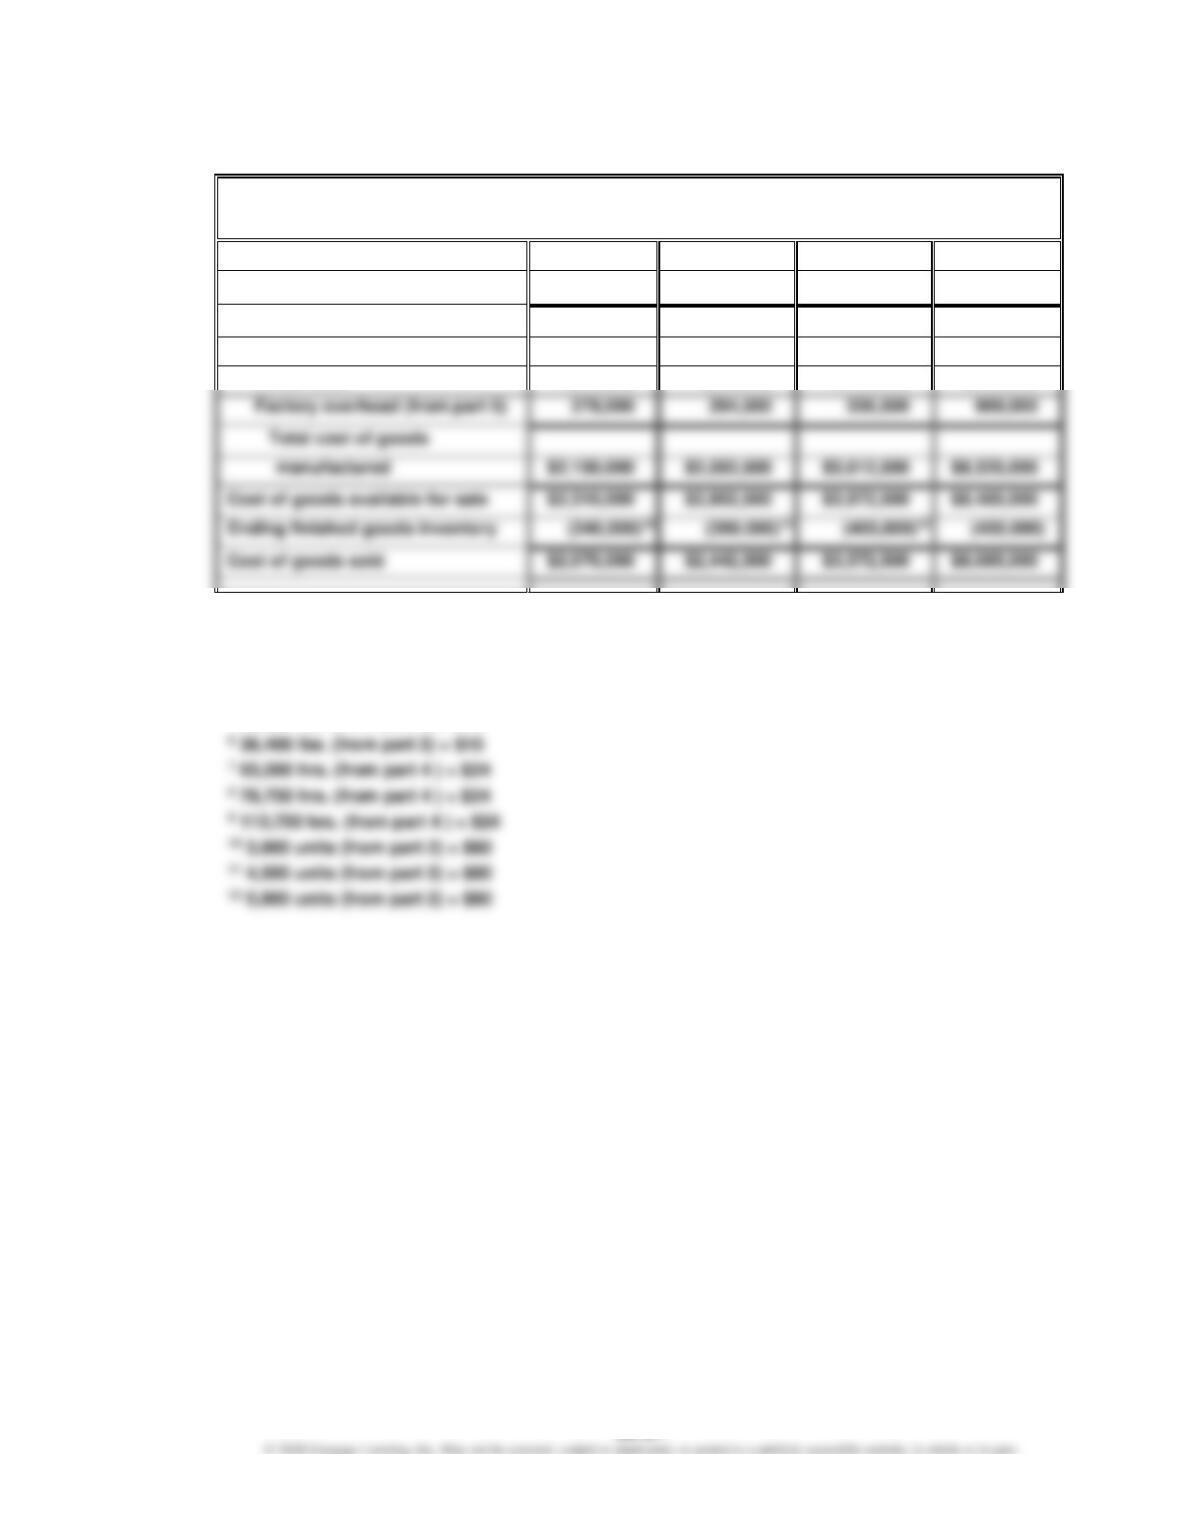
6.
Bellaire Inc.
Cost of Goods Sold Budget
For the First Quarter Ending March 31
January
February
March
First Quarter
Beginning finished goods inventory
$ 160,0001
$ 240,0002
$ 360,0003
$ 160,000
Cost of goods manufactured:
Direct materials
$ 312,0004
$ 378,0005
$ 546,0006
$1,236,000
Factory overhead (from part 5)
$2,310,000
$8,485,000
Cost of goods sold
Direct labor
1,560,0007
1,890,0008
2,730,0009
6,180,000
1 2,000 units (from part 2) × $80
2 3,000 units (from part 2) × $80
3 4,500 units (from part 2) × $80
4 20,800 lbs. (from part 3) × $15
5 25,200 lbs. (from part 3) × $15
CHAPTER 22 (FIN MAN); CHAPTER 8 (MAN) Budgeting
Prob. 22–4A (FIN MAN); Prob. 8–4A (MAN) (Concluded)
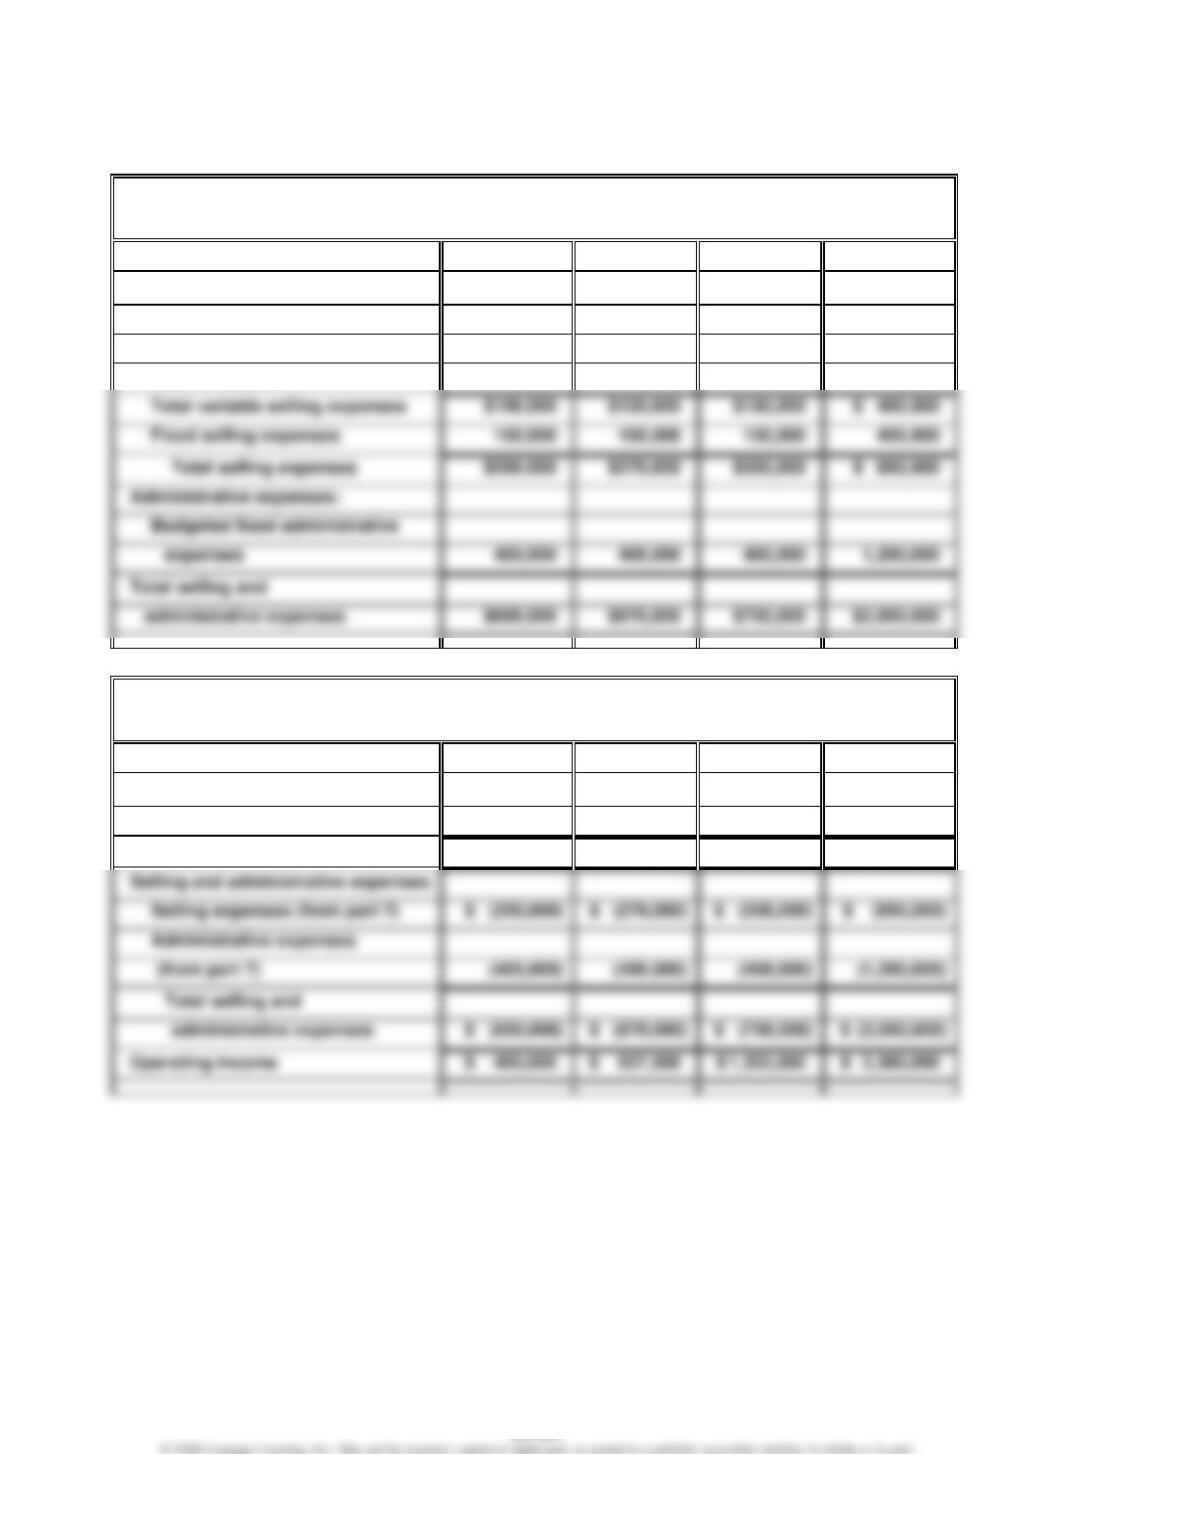
7.
Bellaire Inc.
Selling and Administrative Expenses Budget
For the First Quarter Ending March 31
January
February
March
First Quarter
Selling expenses:
Budgeted sales units
25,000
30,000
45,000
100,000
Variable selling expenses
Total variable selling expenses
Fixed selling expenses
450,000
Administrative expenses:
Budgeted fixed administrative
Total selling and
per unit sold
× $4.00
× $4.00
× $4.00
× $4.00
8.
Bellaire Inc.
Budgeted Income Statement
For the First Quarter Ending March 31
January
February
March
First Quarter
Sales (from part 1)
$ 3,125,000
$ 3,750,000
$ 5,625,000
$12,500,000
Cost of goods sold (from part 6)
(2,070,000)
(2,442,500)
(3,572,500)
(8,085,000)
Gross profit
$ 1,055,000
$ 1,307,500
$ 2,052,500
$ 4,415,000
Selling and administrative expenses:
Selling expenses (from part 7)
Administrative expenses
Operating income
CHAPTER 22 (FIN MAN); CHAPTER 8 (MAN) Budgeting
Prob. 22–5A (FIN MAN); Prob. 8–5A (MAN)
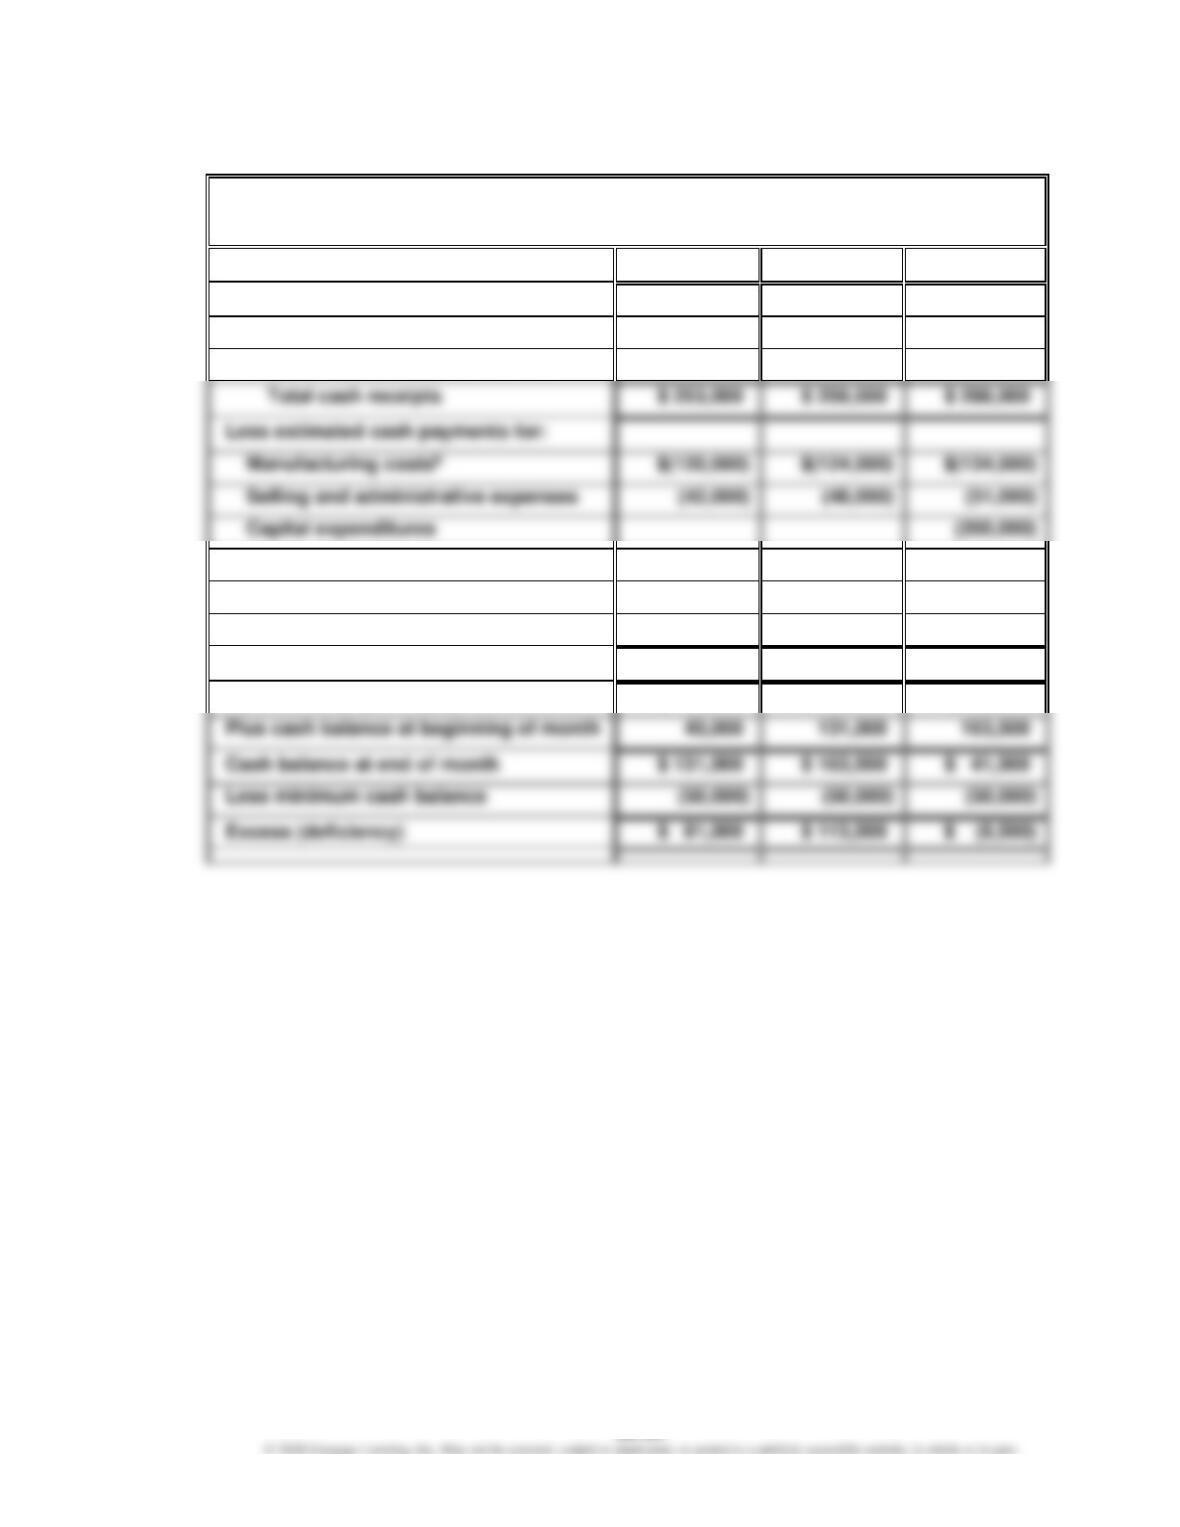
1.
Bridgeport Housewares Inc.
Cash Budget
For the Three Months Ending November 30
September
October
November
Estimated cash receipts from:
Cash sales
$ 25,000
$ 30,000
$ 31,500
Collection of accounts receivablea
228,000
229,500
256,500
Total cash receipts
Selling and administrative expenses
(51,000)
Other purposes:
Income tax
(55,000)
Dividends
(25,000)
Total cash payments
$(162,000)
$(227,000)
$(410,000)
Cash increase (decrease)
$ 91,000
$ 32,500
$(122,000)
Cash balance at end of month
$ 41,500
CHAPTER 22 (FIN MAN); CHAPTER 8 (MAN) Budgeting
Prob. 22–5A (FIN MAN); Prob. 8–5A (MAN) (Concluded)
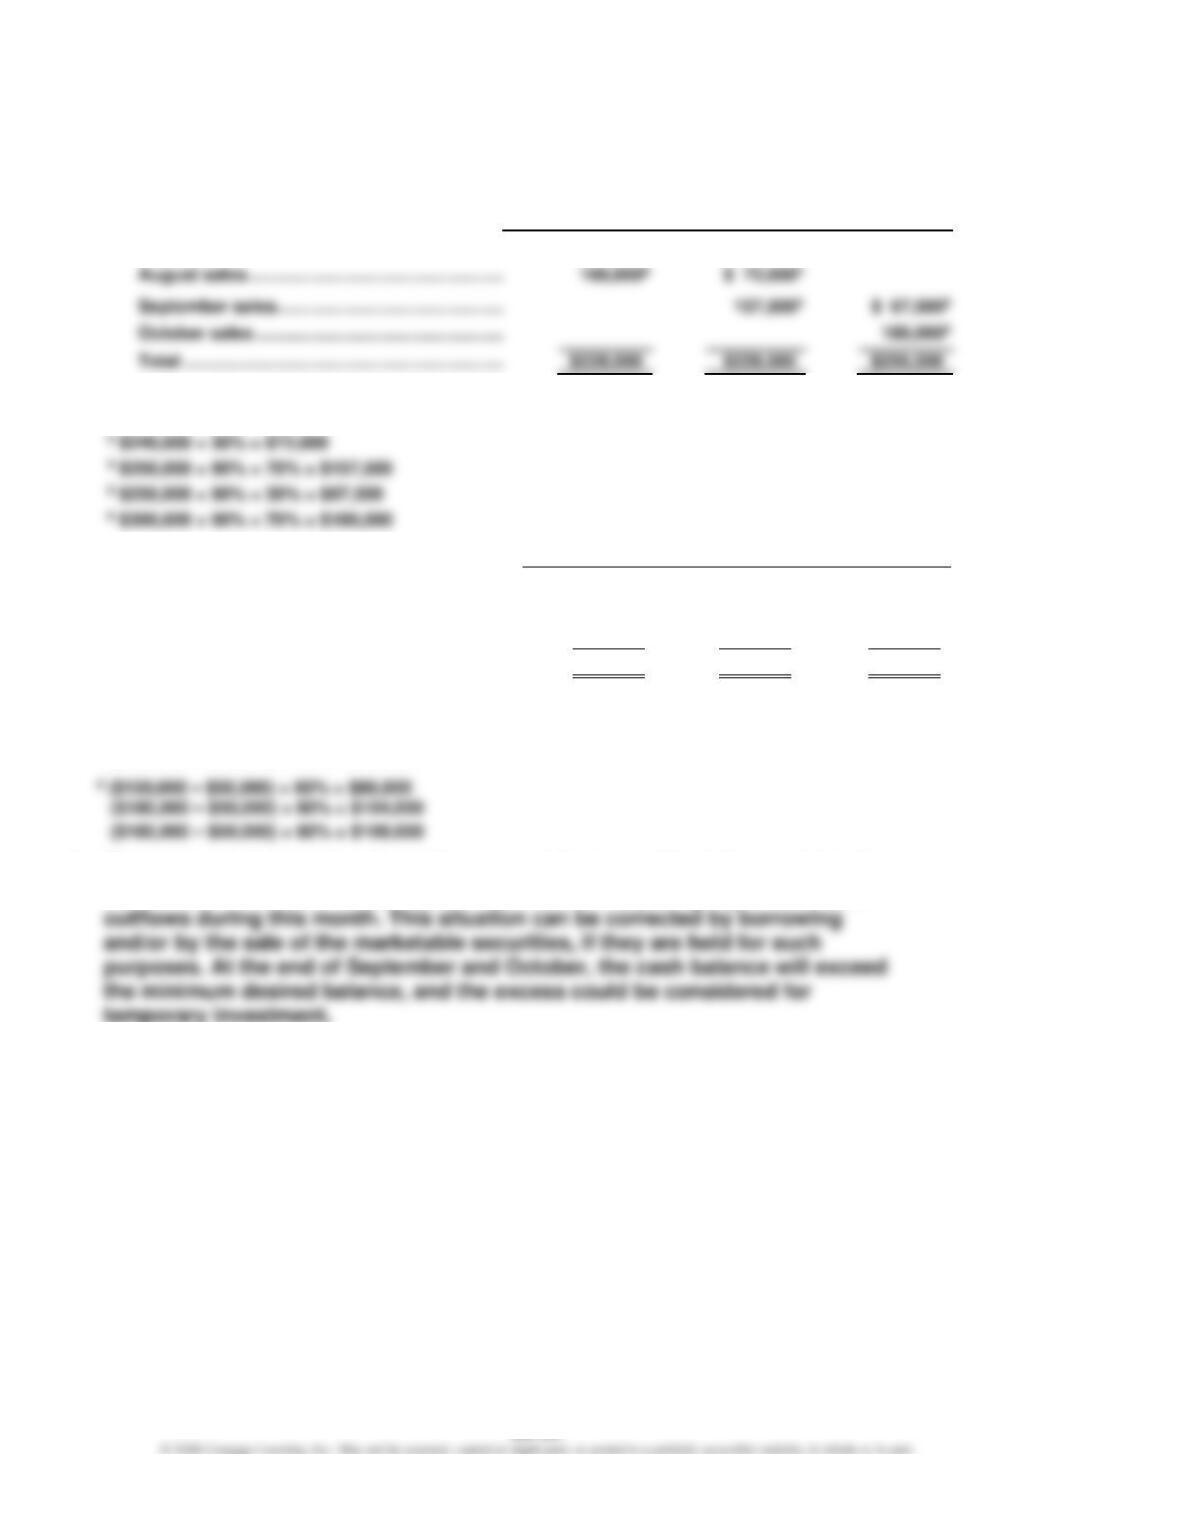
Computations:
a Collections of accounts receivable:
September
October
November
July sales …………………………………………………..
$ 60,0001
September sales …………………………………………
October sales …………………………………………….
1 $200,000 × 30% = $60,000
2 $240,000 × 70% = $168,000
b Payments for manufacturing costs:
September
October
November
Payment of accounts payable, beginning
of month balancec ……………………………………
$ 40,000
$ 20,000
$ 26,000
Payment of current month’s costd ……………….
80,000
104,000
108,000
Total ………………………………………………………..
$120,000
$124,000
$134,000
c Accounts payable, September 1 balance = $40,000
($150,000 – $50,000) × 20% = $20,000
($180,000 – $50,000) × 20% = $26,000
2. The budget indicates that the minimum cash balance will not be maintained in
November. This is due to the capital expenditures requiring significant cash
CHAPTER 22 (FIN MAN); CHAPTER 8 (MAN) Budgeting
Prob. 22–6A (FIN MAN); Prob. 8–6A (MAN)
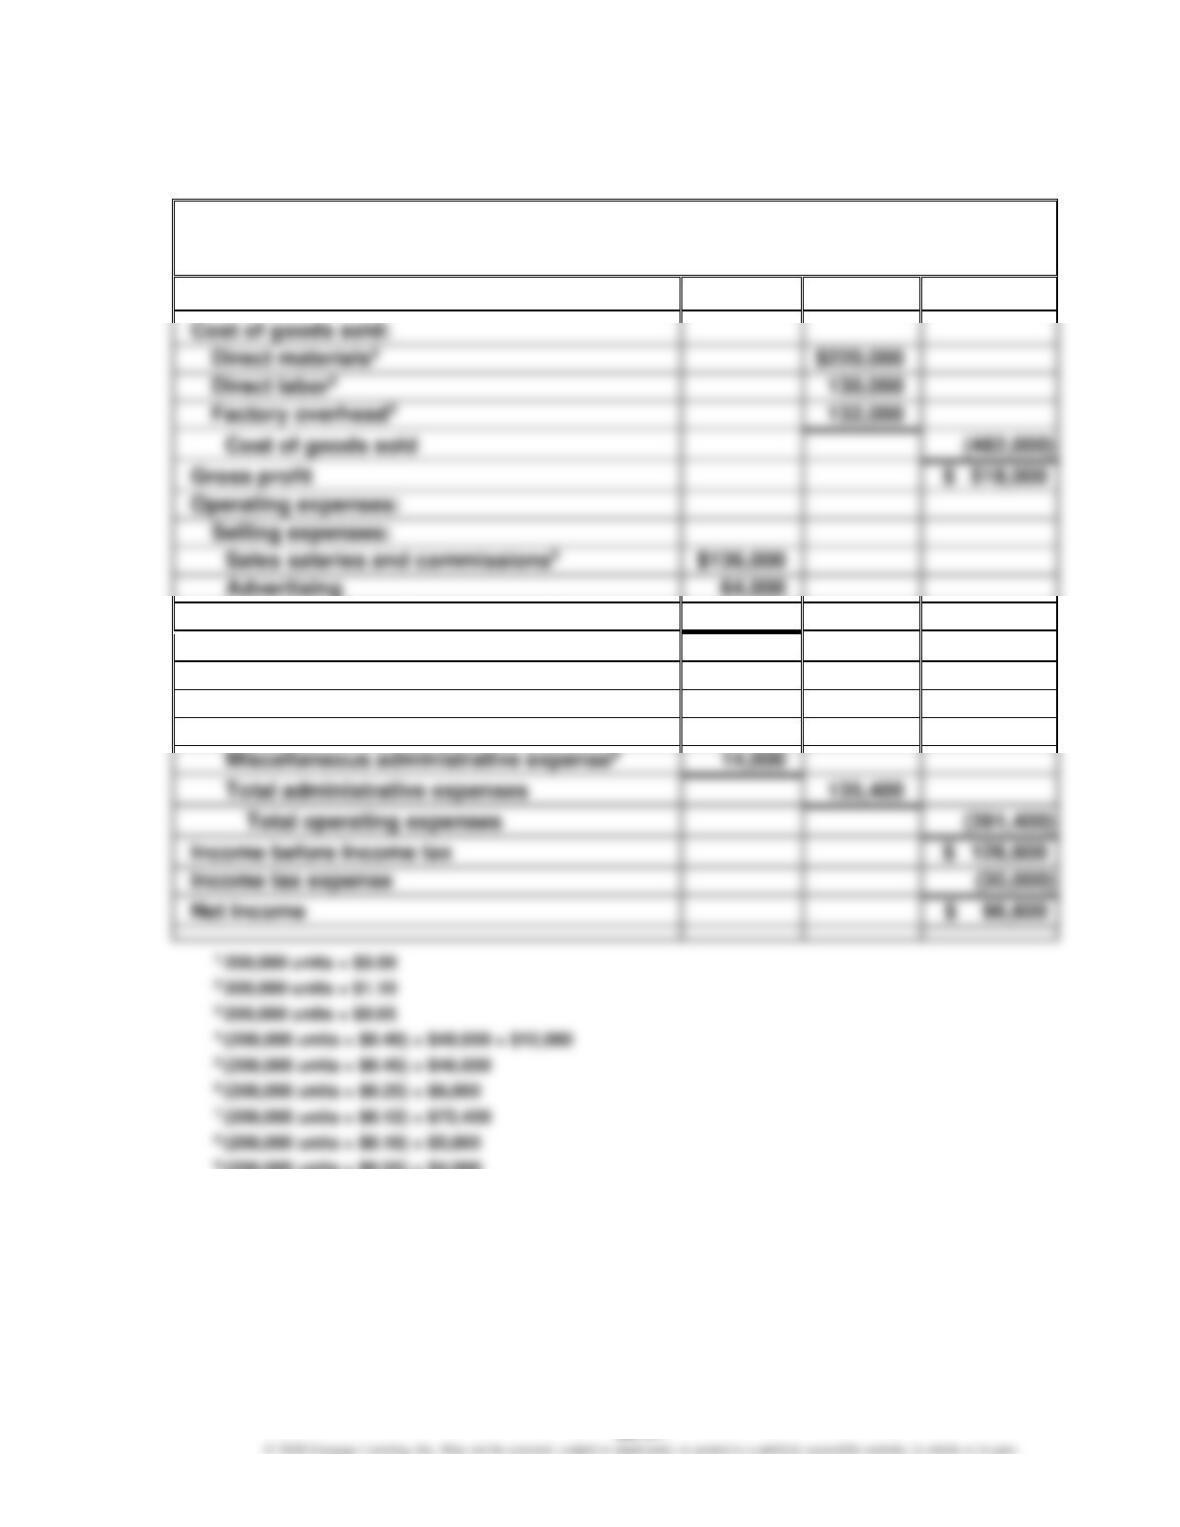
1.
Regina Soap Co.
Budgeted Income Statement
For the Year Ending December 31, 20Y9
Sales1
$1,000,000
$220,000
Selling expenses:
Sales salaries and commissions5
64,000
Miscellaneous selling expenses6
56,000
Total selling expenses
$256,000
Administrative expenses:
Office and officers salaries7
$ 96,400
Supplies8
25,000
Miscellaneous administrative expense9
14,000
Total operating expenses
CHAPTER 22 (FIN MAN); CHAPTER 8 (MAN) Budgeting
Prob. 22–6A (FIN MAN); Prob. 8–6A (MAN) (Concluded)
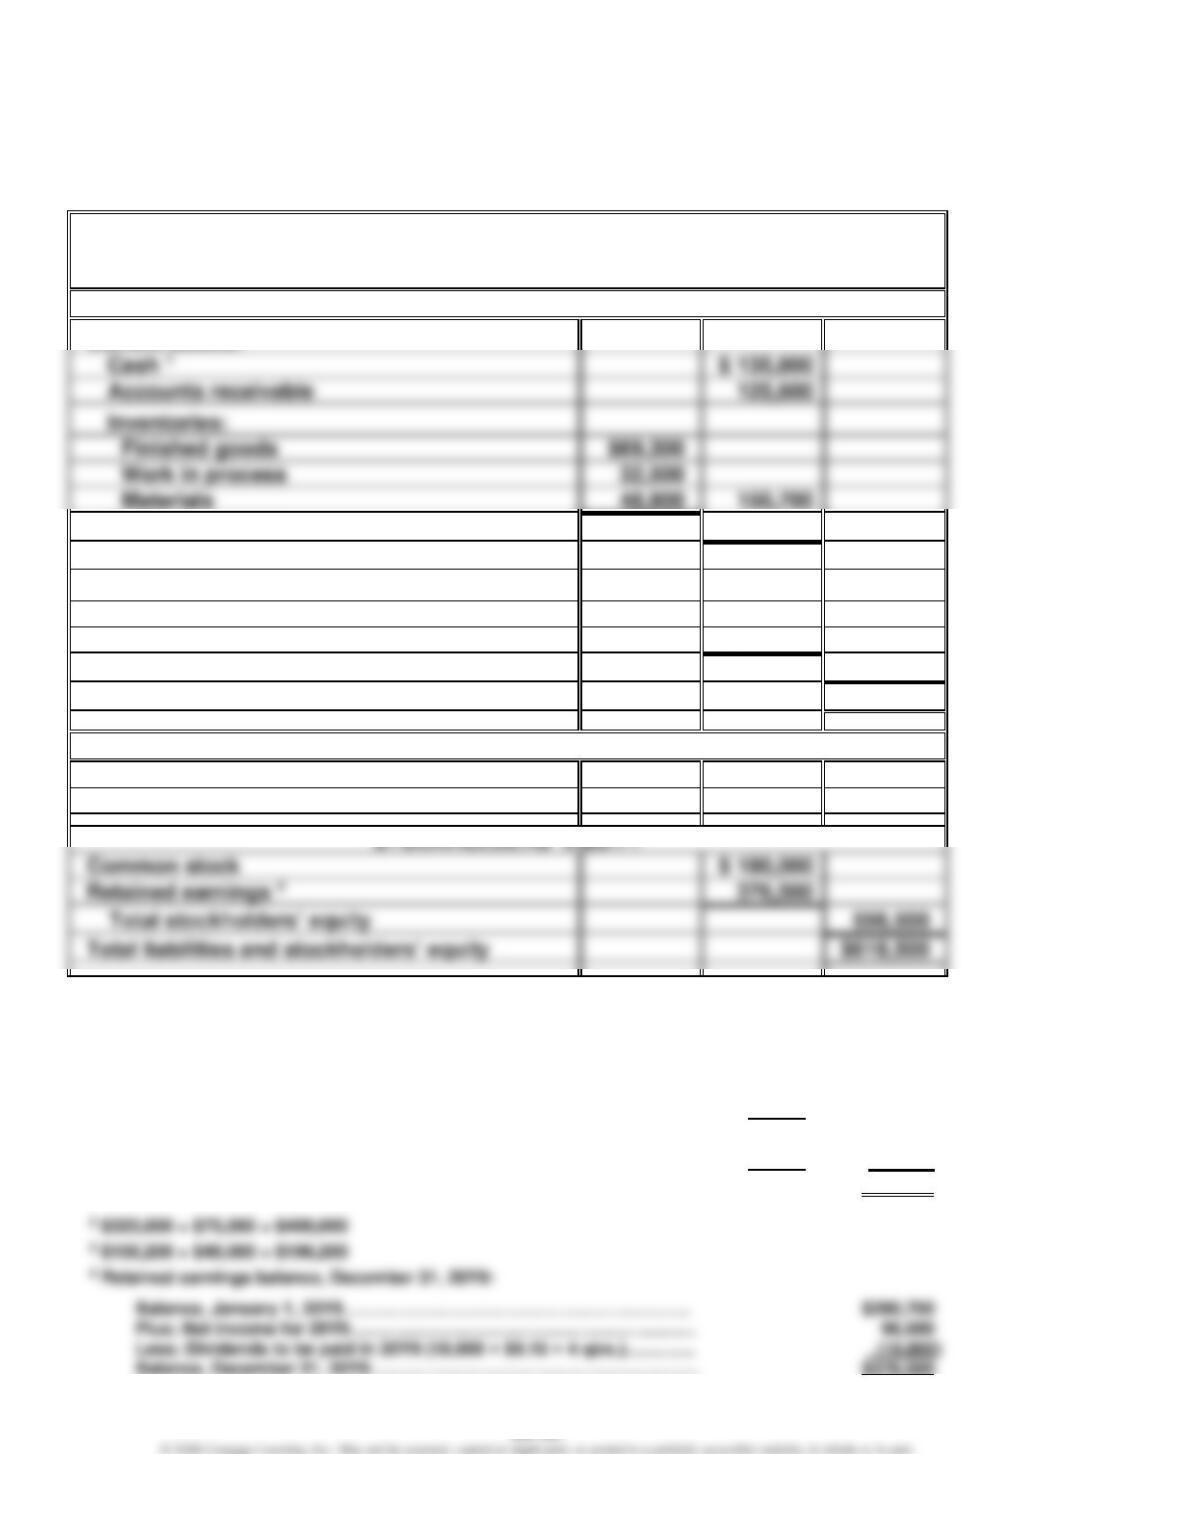
2.
Regina Soap Co.
Budgeted Balance Sheet
December 31, 20Y9
ASSETS
Current assets:
Cash 1
$ 135,800
Accounts receivable
Work in process
Prepaid expenses
2,600
Total current assets
$414,700
Property, plant, and equipment:
Plant and equipment 2
$ 400,000
Accumulated depreciation 3
(196,200)
Total property, plant, and equipment
203,800
Total assets
$618,500
LIABILITIES
Current liabilities:
Accounts payable
$ 62,000
Common stock
$ 180,000
$618,500
1 Cash balance, December 31, 20Y9:
Balance, January 1, 20Y9 ………………………………………………………………….
$ 85,000
Add cash from operations:
Net income ………………………………………………………………………….
$96,600
Depreciation of plant and equipment …………………………………….
40,000
136,600
Less: Dividends to be paid in 20Y9 (18,000 × $0.15 × 4 qtrs.) ……………
$10,800
Plant and equipment to be acquired in 20Y9 ………………………….
75,000
(85,800)
Cash balance, December 31, 20Y9 …………………………………………………….
$135,800
CHAPTER 22 (FIN MAN); CHAPTER 8 (MAN) Budgeting
Prob. 22–1B (FIN MAN); Prob. 8–1B (MAN)
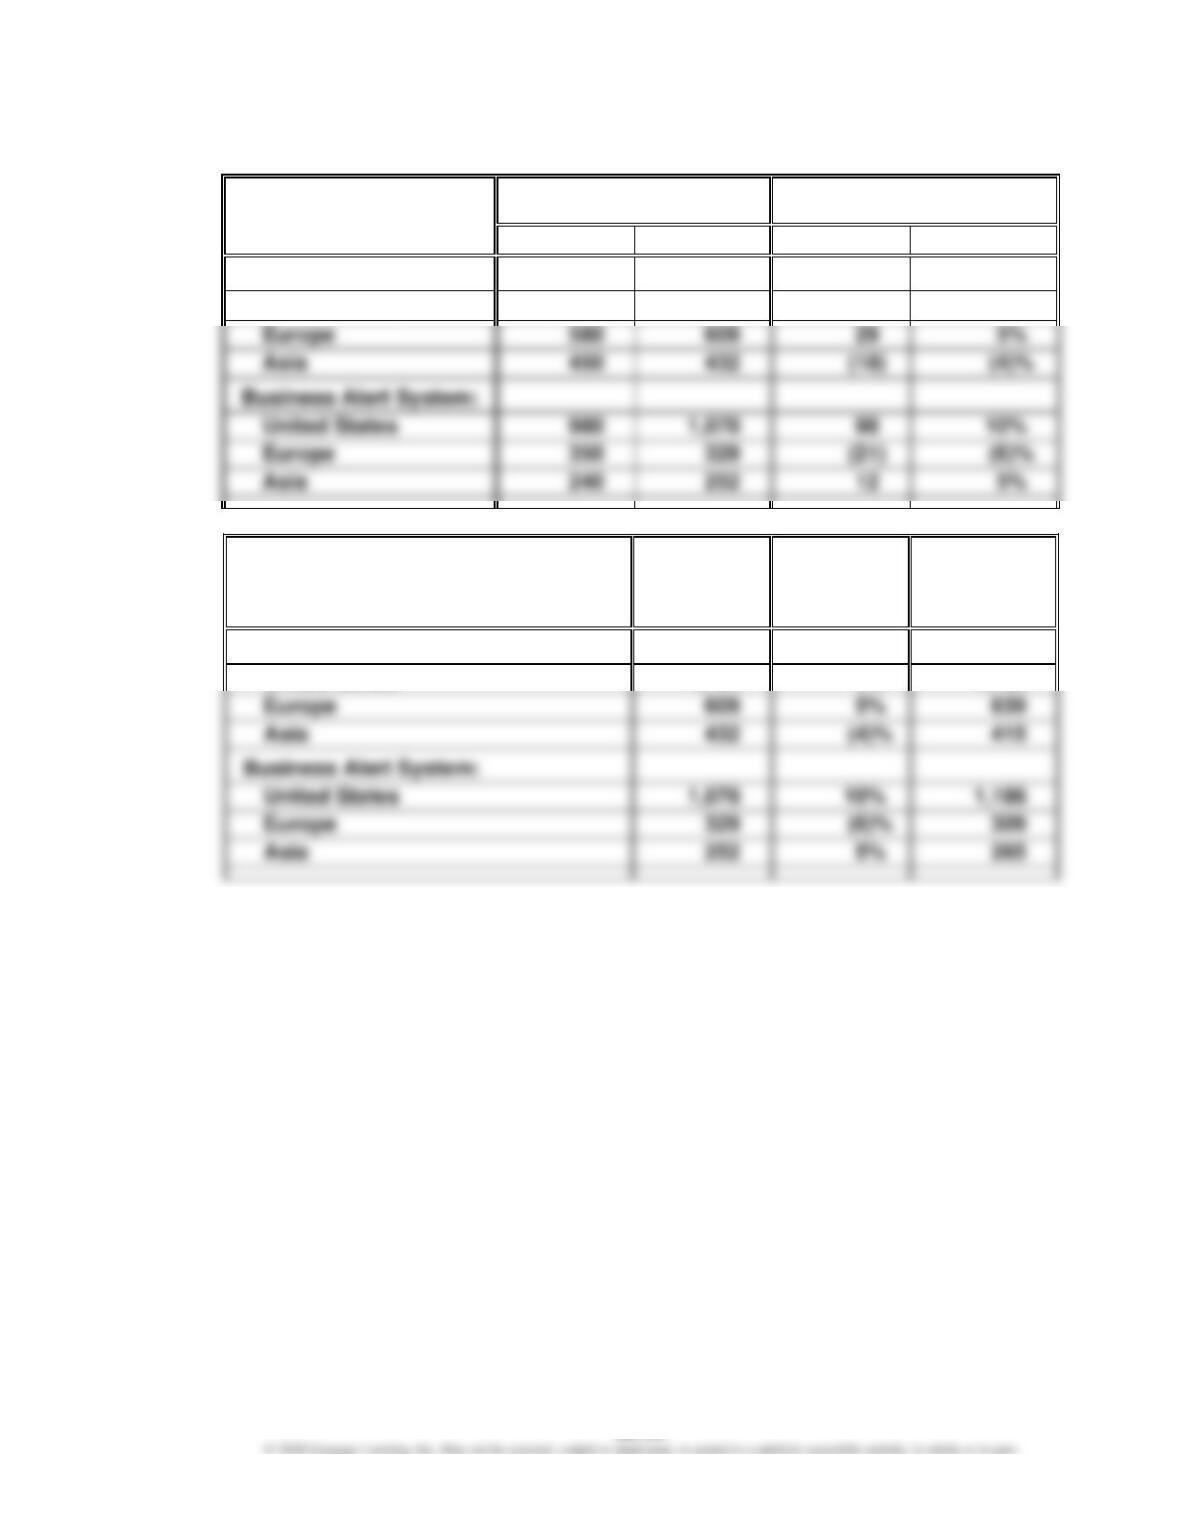
1.
Unit Sales, Year Ended 20Y8
Increase (Decrease)
Actual Over Budget
Budget
Actual Sales
Amount
Percent
Home Alert System:
United States
1,700
1,734
34
2%
29
Business Alert System:
United States
1,078
98
12
2.
20Y8
Actual
Units
Percentage
Increase
(Decrease)
20Y9
Budgeted
Units
(rounded)
Home Alert System:
5%
Business Alert System:
United States
1,078
1,186
5%
United States
1,734
2%
1,769
CHAPTER 22 (FIN MAN); CHAPTER 8 (MAN) Budgeting
Prob. 22–1B (FIN MAN); Prob. 8–1B (MAN) (Concluded)
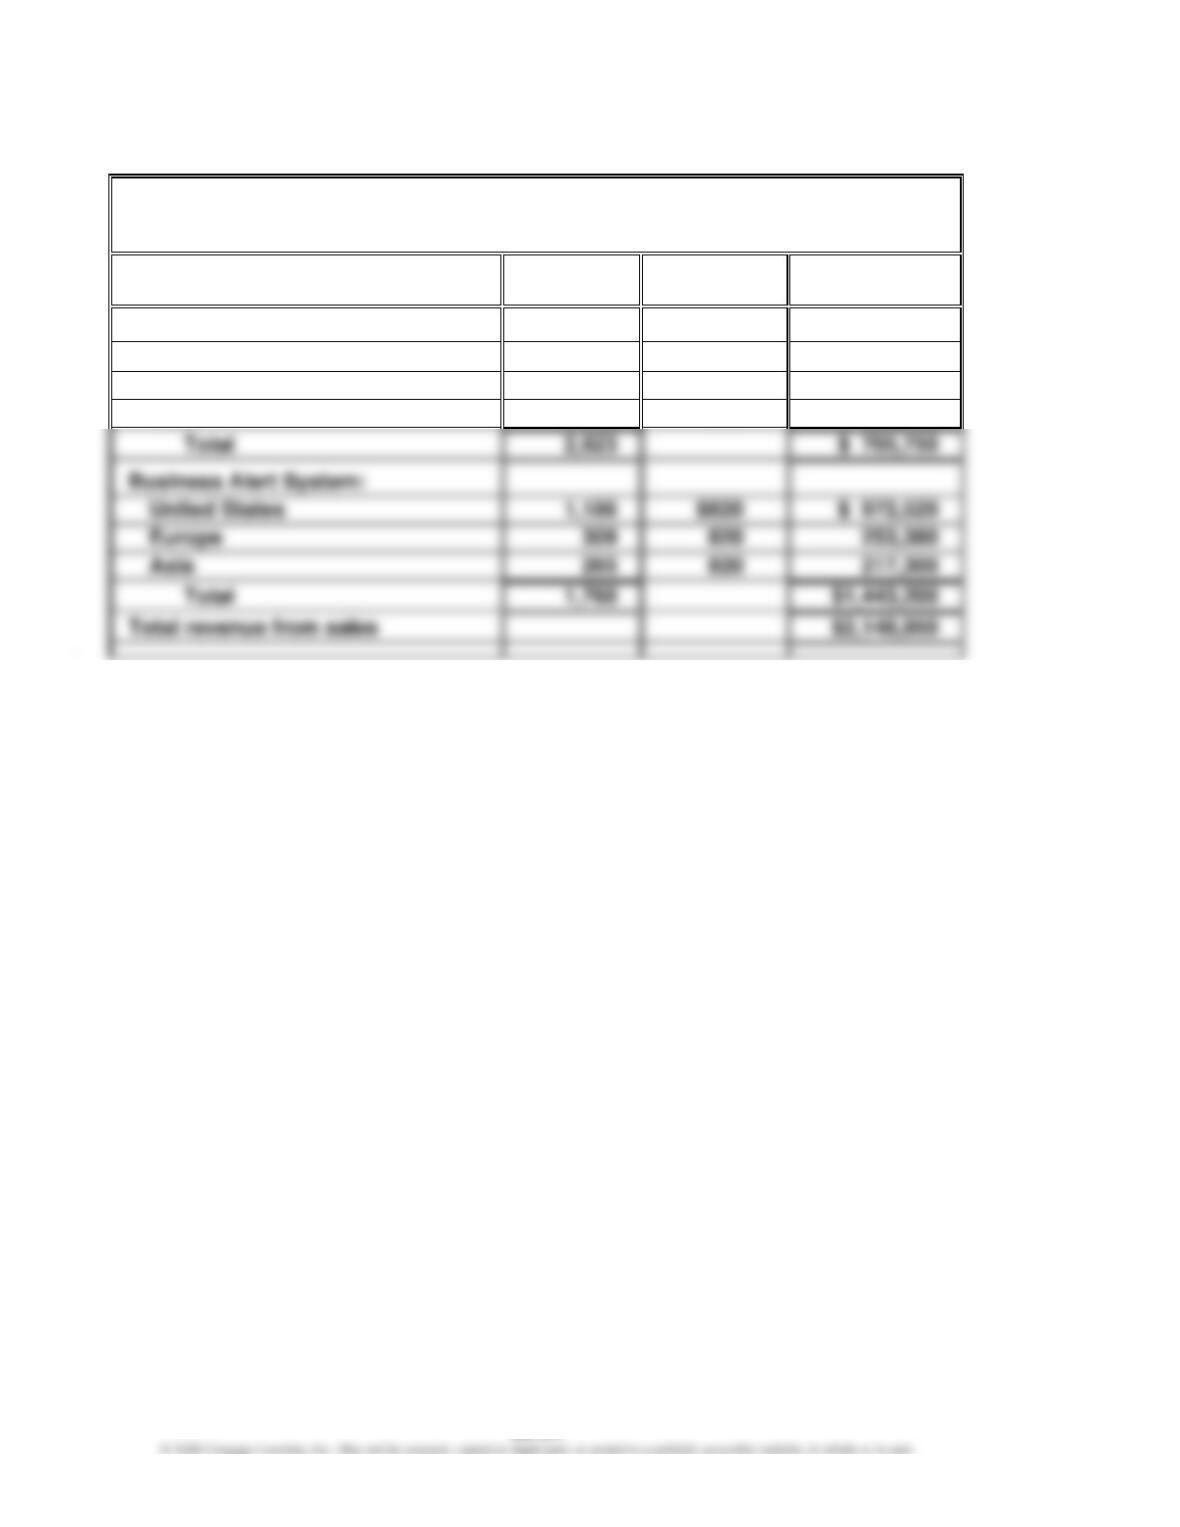
3.
Sentinel Systems Inc.
Sales Budget
For the Year Ending December 31, 20Y9
Product and Area
Unit Sales
Volume
Unit Selling
Price
Total Sales
Home Alert System:
United States
1,769
$250
$ 442,250
Europe
639
250
159,750
Asia
415
250
103,750
Business Alert System:
Europe
309
820
253,380
Asia
265
820
217,300
Total revenue from sales
CHAPTER 22 (FIN MAN); CHAPTER 8 (MAN) Budgeting
Prob. 22–2B (FIN MAN); Prob. 8–2B (MAN)
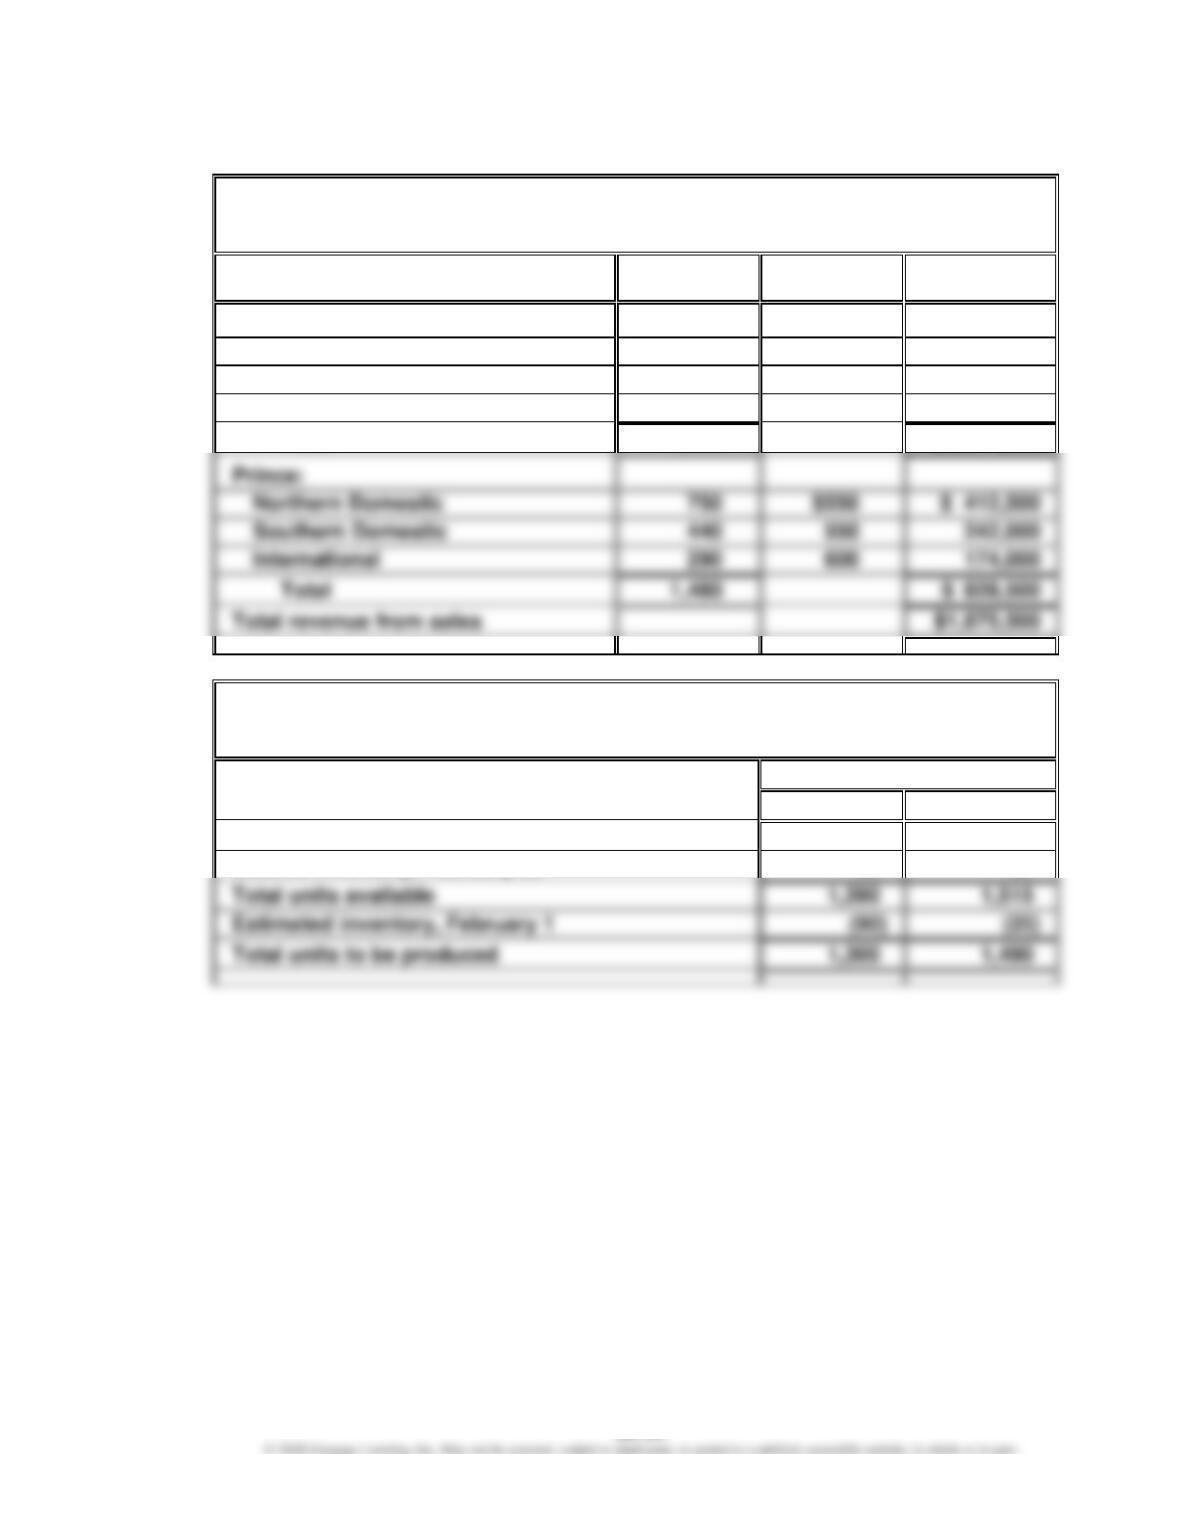
1.
Royal Furniture Company
Sales Budget
For the Month Ending February 28
Product and Area
Unit Sales
Volume
Unit Selling
Price
Total Sales
King:
Northern Domestic
610
$780
$ 475,800
Southern Domestic
340
780
265,200
International
360
850
306,000
Total
1,310
$1,047,000
Prince:
Northern Domestic
750
$550
$ 412,500
Southern Domestic
440
550
242,000
International
290
600
174,000
Total
1,480
Total revenue from sales
$1,875,500
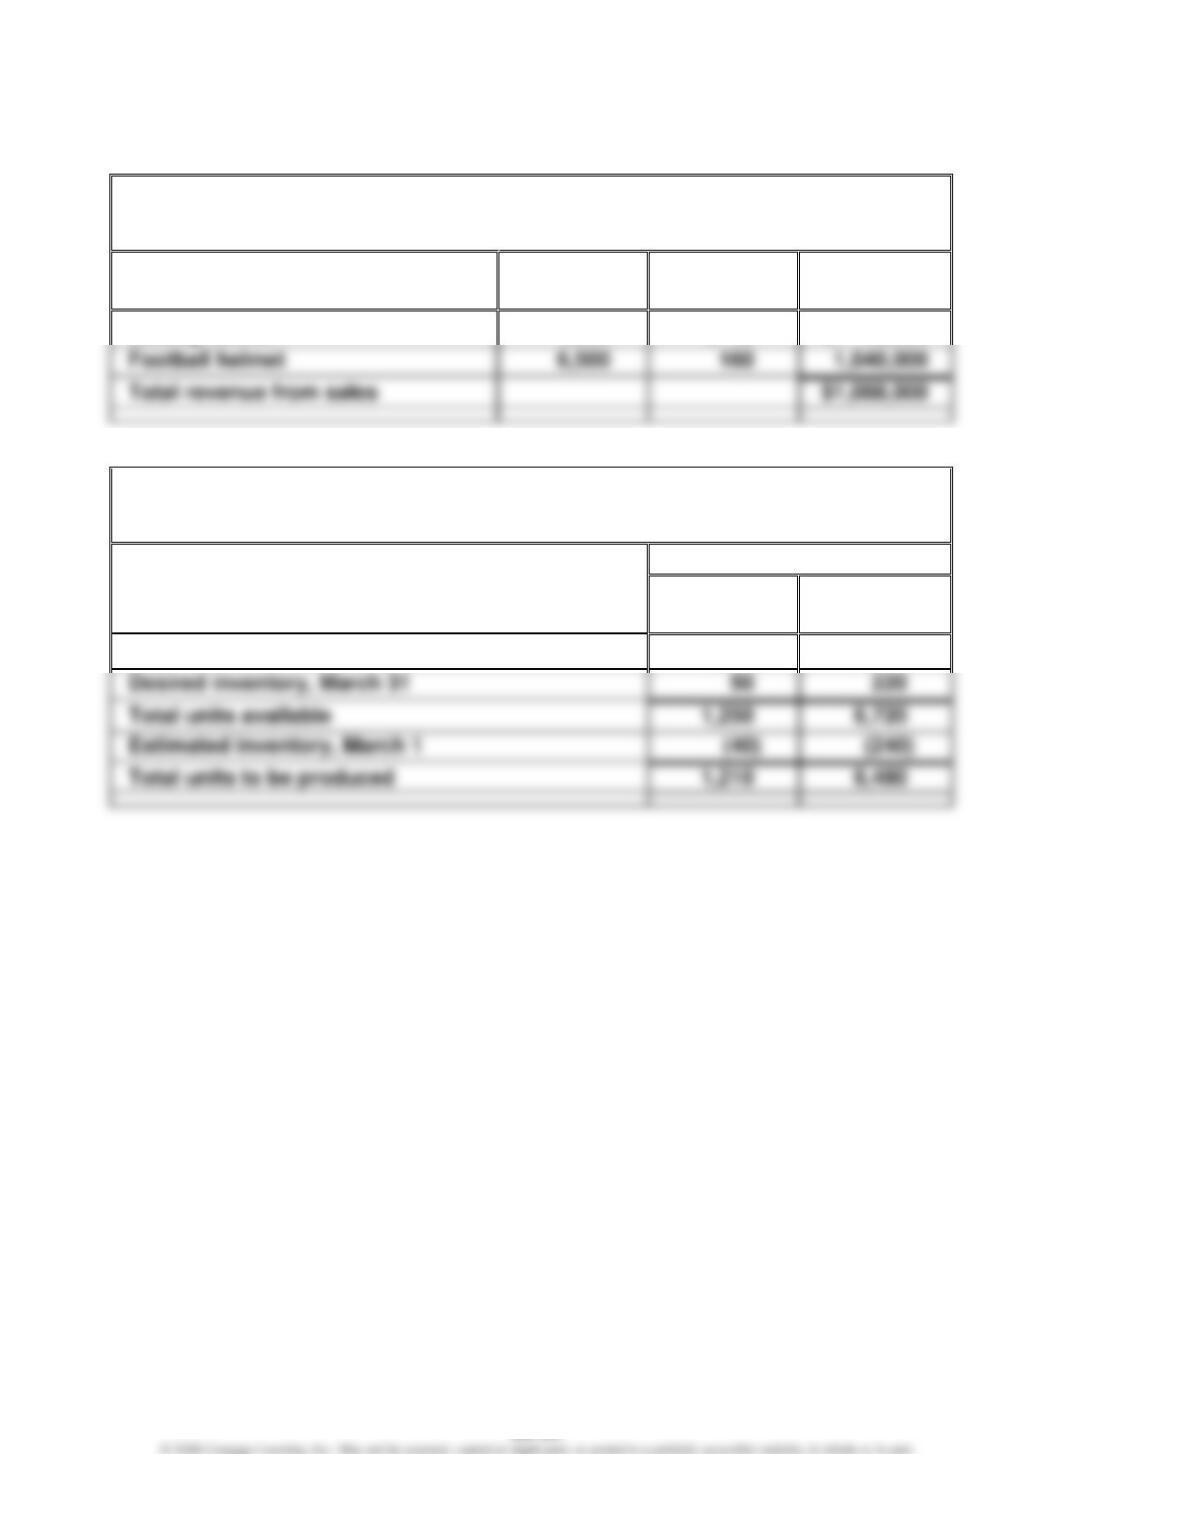
2.
Royal Furniture Company
Production Budget
For the Month Ending February 28
Units
King
Prince
Expected units to be sold
1,310
1,480
Total units available
1,390
1,515
Total units to be produced
1,300
1,490
Desired inventory, February 28
80
35
CHAPTER 22 (FIN MAN); CHAPTER 8 (MAN) Budgeting
Prob. 22–2B (FIN MAN); Prob. 8–2B (MAN) (Continued)
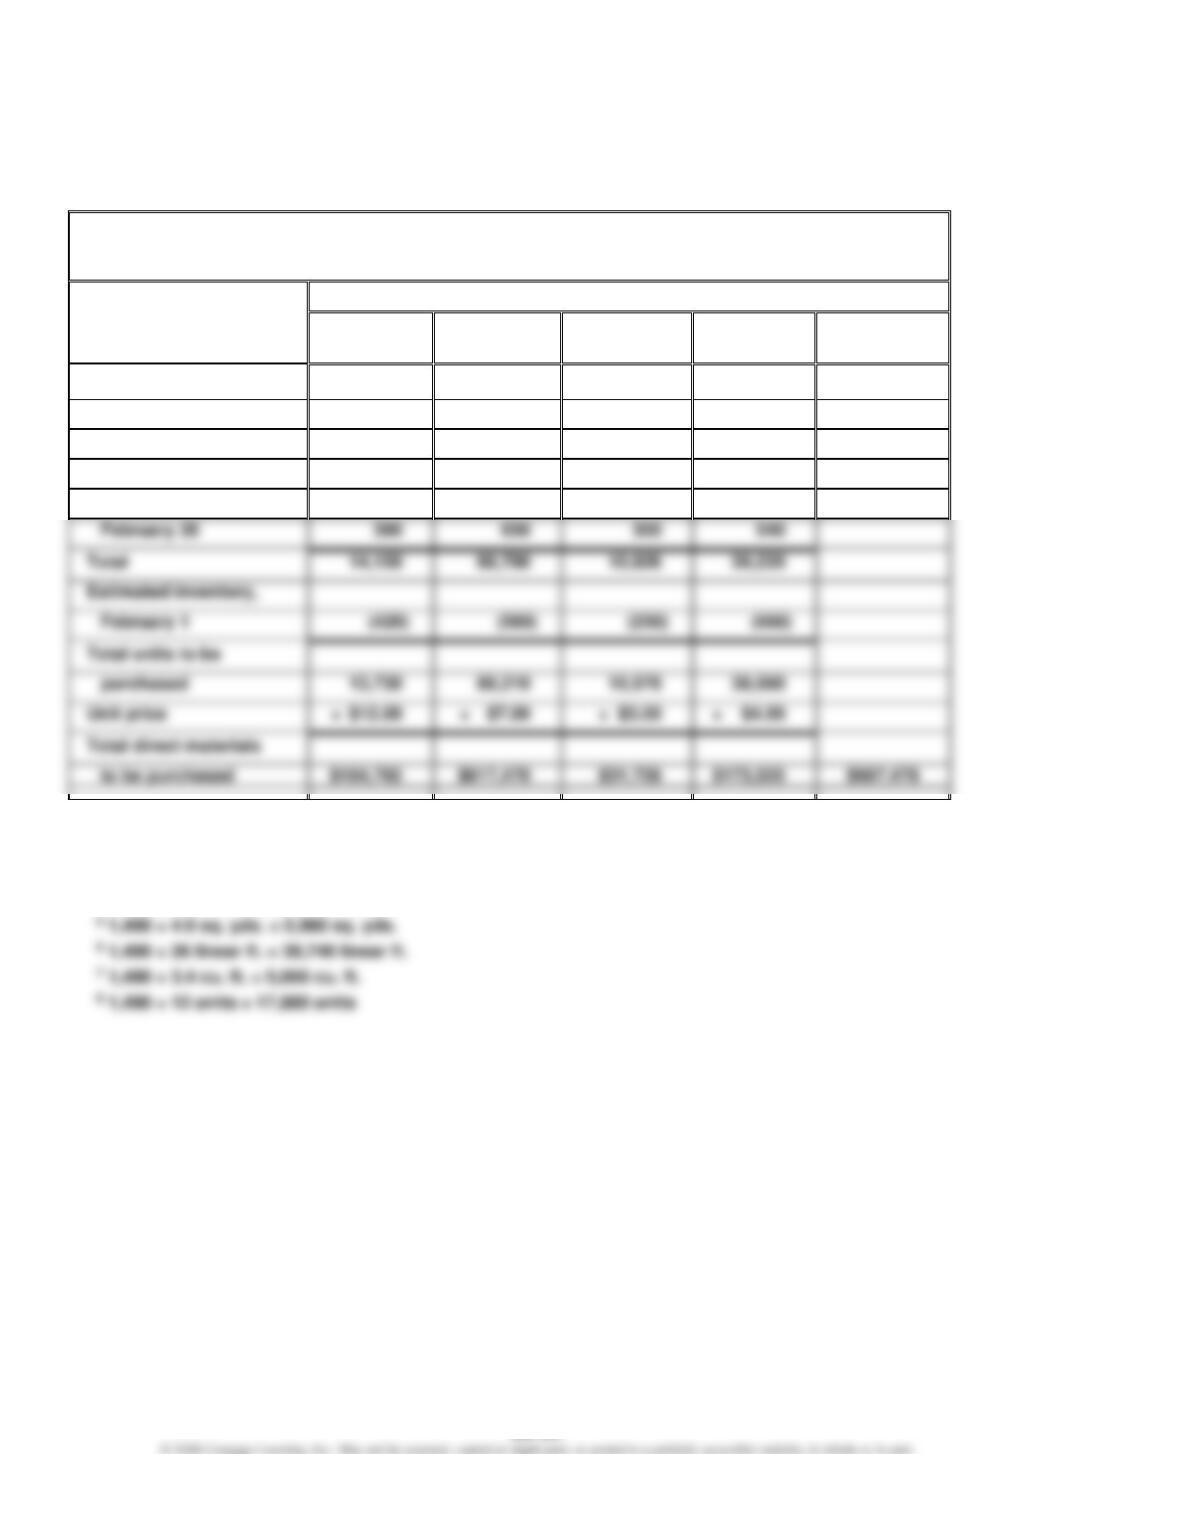
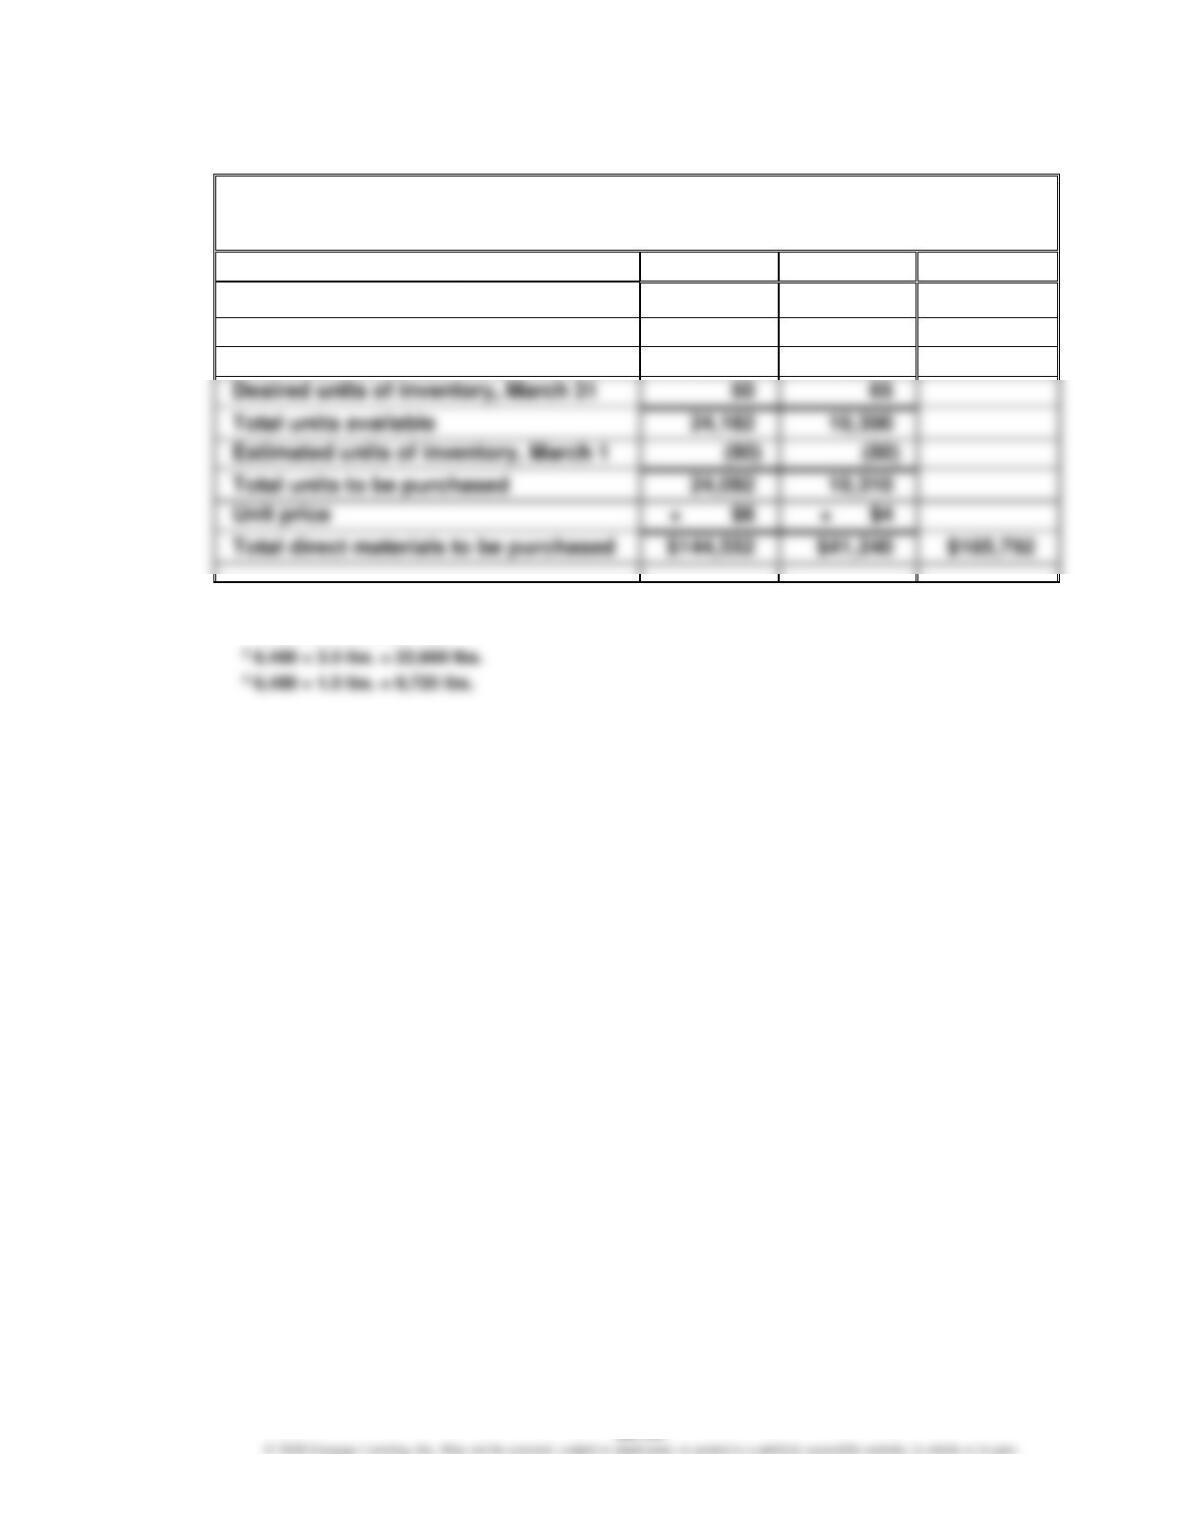
3.
Royal Furniture Company
Direct Materials Purchases Budget
For the Month Ending February 28
Direct Materials
Fabric
(sq. yds.)
Wood
(linear ft.)
Filler
(cu. ft.)
Springs
(units)
Total
Required units for
production:
King
7,8001
49,4002
5,4603
20,8004
Prince
5,9605
38,7406
5,0667
17,8808
Desired inventory,
Estimated inventory,
Total units to be
Total direct materials
1 1,300 × 6.0 sq. yds. = 7,800 sq. yds.
2 1,300 × 38 linear ft. = 49,400 linear ft.
3 1,300 × 4.2 cu. ft. = 5,460 cu. ft.
4 1,300 × 16 units = 20,800 units
CHAPTER 22 (FIN MAN); CHAPTER 8 (MAN) Budgeting
Prob. 22–2B (FIN MAN); Prob. 8–2B (MAN) (Concluded)
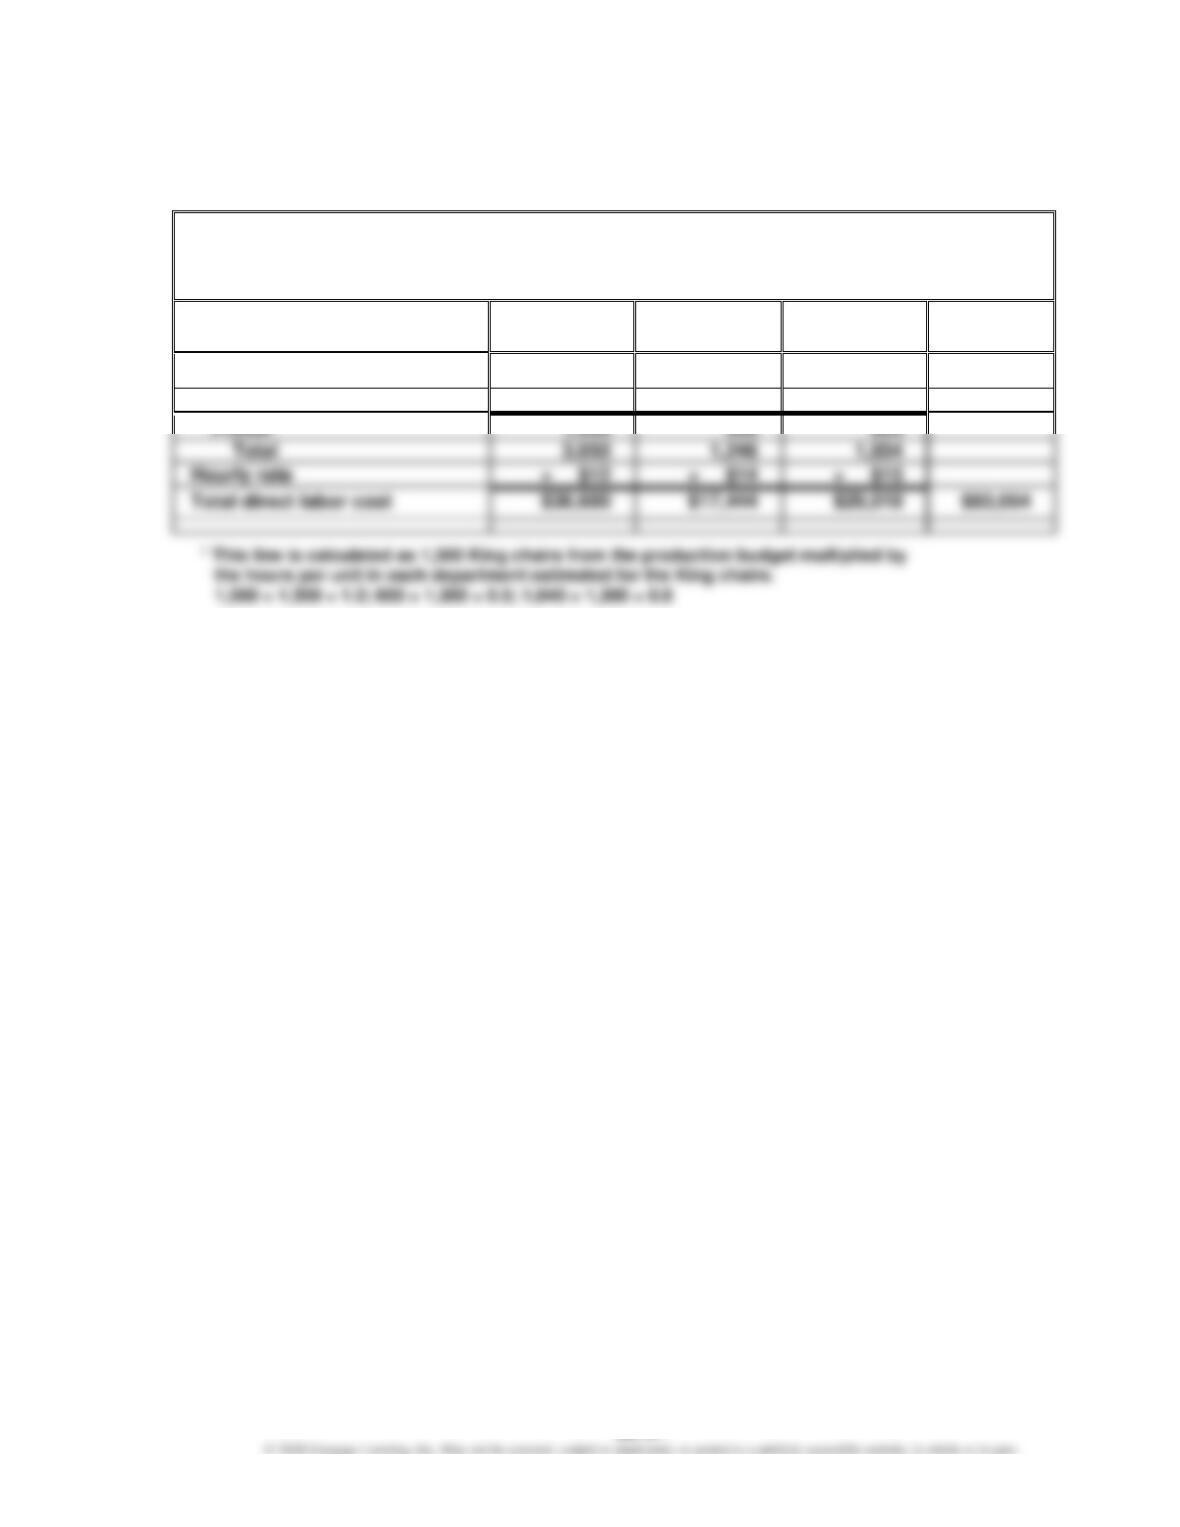
4.
Royal Furniture Company
Direct Labor Cost Budget
For the Month Ending February 28
Framing
Department
Cutting
Department
Upholstery
Department
Total
Hours required for production:
King1
1,560
650
1,040
Prince2
1,490
596
3,050
1,934
2 This line is calculated as 1,490 Prince chairs from the production budget multiplied by
the hours per unit in each department estimated for the Prince chairs.
1,490 = 1,490 × 1.0; 596 = 1,490 × 0.4; 894 = 1,490 × 0.6
CHAPTER 22 (FIN MAN); CHAPTER 8 (MAN) Budgeting
Prob. 22–3B (FIN MAN); Prob. 8–3B (MAN)
1.
Gold Medal Athletic Co.
Sales Budget
For the Month Ending March 31
Unit Sales
Volume
Unit Selling
Price
Total Sales
Batting helmet
1,200
$ 40
$ 48,000
2.
Gold Medal Athletic Co.
Production Budget
For the Month Ending March 31
Units
Batting
Helmet
Football
Helmet
Expected units to be sold
1,200
6,500
CHAPTER 22 (FIN MAN); CHAPTER 8 (MAN) Budgeting
Prob. 22–3B (FIN MAN); Prob. 8–3B (MAN) (Continued)
3.
Gold Medal Athletic Co.
Direct Materials Purchases Budget
For the Month Ending March 31
Plastic
Foam Lining
Total
Units required for production:
Batting helmet
1,4521
6052
Football helmet
22,6803
9,7204
1 1,210 × 1.2 lbs. = 1,452 lbs.
2 1,210 × 0.5 lb. = 605 lbs.