8-1
Auditing: A Risk Based Approach to Conducting a Quality Audit, 10e
Solutions for Chapter 8
True/False Questions
8-2 F
8-4 F
8-6 F
8-8 F
8-10 T
8-12 F
8-14 T
Multiple-Choice Questions
8-16 C
8-18 A
8-20 C
8-22 A
8-24 C
8-26 D
8-28 A
Review and Short Case Questions
8-29
Sampling is used in testing both controls and account balances and assertions and involves
looking at less than 100% of the transactions that occurred during the period under audit.
8-2
Sampling techniques would be appropriate when an auditor wants to perform procedures such as
examining documents, reperforming calculations, or sending confirmations.
8-30
Exhibit 8.1
Approaches to Gathering Audit Evidence about Assertions
Financial
Using Sampling to Gather Evidence
Using GAS to Gather Evidence
8-3
source documents.
agreements or invoices.
8-31
Sampling units refer to the individual items to be tested. The sampling units make up the
8-32
The auditor needs to answer four critical questions when sampling:
1. Which population and sampling unit should be tested and what characteristics should be
examined (population)?
8-33
Sampling risk is the risk that the auditor’s conclusion based on a sample might be different from
8-4
8-34
a.
Risk of incorrect acceptance of internal control reliability The risk that the auditor will
conclude that the state of internal controls is effective when internal controls are actually
not effective (also referred to as the risk of assessing control risk too low).
Risk of incorrect rejection of internal control reliability The risk that the auditor will
conclude that the state of internal controls is not effective when internal controls are
actually effective (also referred to as the risk of assessing control risk too high).
While the auditor will certainly not want to be inefficient, ineffectiveness is a greater risk.
8-35
Exhibit 8.4
Comparison of Nonstatistical and Statistical Sampling
Nonstatistical Sampling
Statistical Sampling
Sample size
Sample size is determined by auditor
judgment.
Auditor judgment is quantified and
sample size is determined by
probability theory.
Sample selection
Selection involves any method that the
auditor believes is representative of
the population.
included in the sample.
selected.
The sample must be randomly
selected to give each unit in the
population an equal chance to be
8-5
Costs
• Lower selection cost because only
requires audit judgment to
determine an appropriate sample
size and evaluate the results
• Requires knowledge of
statistical sampling methods
and/or special computer
sampling software is required
measure of sampling risk
• Gain efficiencies through
computerized selection and
statistical evaluation
• Defend sample inferences
maximum amount of
misstatement in the recorded
account balance or class of
transactions
• The risk that the auditor
8-36
Attributes sampling is a statistical sampling method used to estimate the rate of control
procedure failures based on selecting one sample and performing the appropriate audit
procedure. An attribute is a characteristic of the population of interest to the auditor.
An example of an attribute of interest to an auditor would be evidence that the client has matched
8-37
In defining the population, the following factors need to be addressed:
8-38
The AICPA’s 2012 Audit Sampling guide formally defines the tolerable rate of deviation as a
rate of deviation set by the auditor in respect of which the auditor seeks to obtain an appropriate
8-39
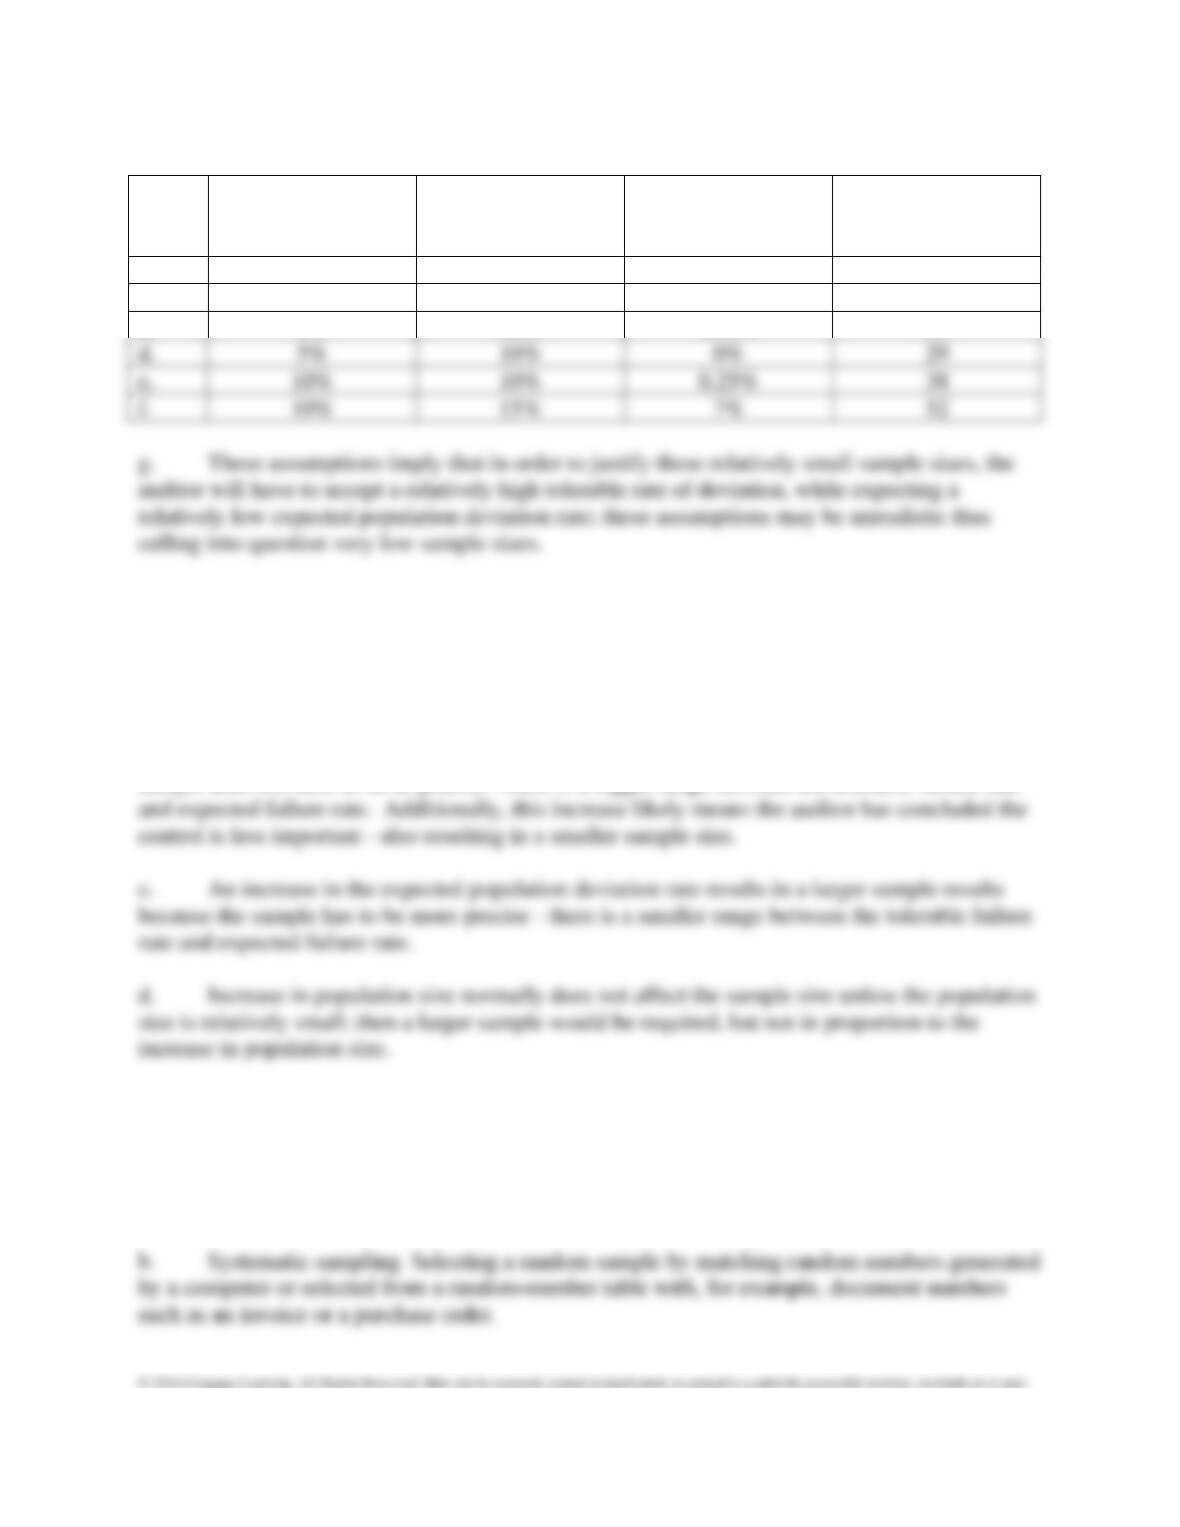
Sampling risk
Tolerable rate of
deviation
Expected
population
deviation rate
Sample Size
(expected errors)
a.
5%
2%
1%
590 (6)
b.
5%
6%
5%
1,580 (79)
c.
5%
8%
d.
2%
1%
398 (4)
e.
6%
5%
1,019 (51)
8%
8-7
8-40
Sampling risk
Tolerable rate of
deviation
Expected
population
deviation rate
Sample Size
a.
10%
20%
0%
11
b.
5%
20%
0%
14
c.
5%
20%
0.25%
22
d.
5%
10%
0%
29
e.
10%
10%
0.25%
38
10%
15%
7%
52
8-41
a. An increase in sampling risk results in a smaller sample because the auditor is willing to
accept more risk of the audit conclusion being in error. As a general sampling rule, the more risk
the auditor is willing to take of being wrong, the smaller will be the sample size.
b. An increase in the tolerable rate of deviation results in a smaller sample because the
sample does not have to be as precise – there is a bigger range between the tolerable failure rate
8-42
a. Simple random sampling. Selecting a random sample by matching random numbers
generated by a computer or selected from a random-number table with, for example, document
numbers such as an invoice or a purchase order.

8-8
c. Systematic random sampling. This sampling technique involves systematic sampling in
which the first item is selected randomly from the interval.
e. Block sampling. A sampling technique that involves selecting a sample that consists of
contiguous population items, such as selecting transactions by day or week.
8-43
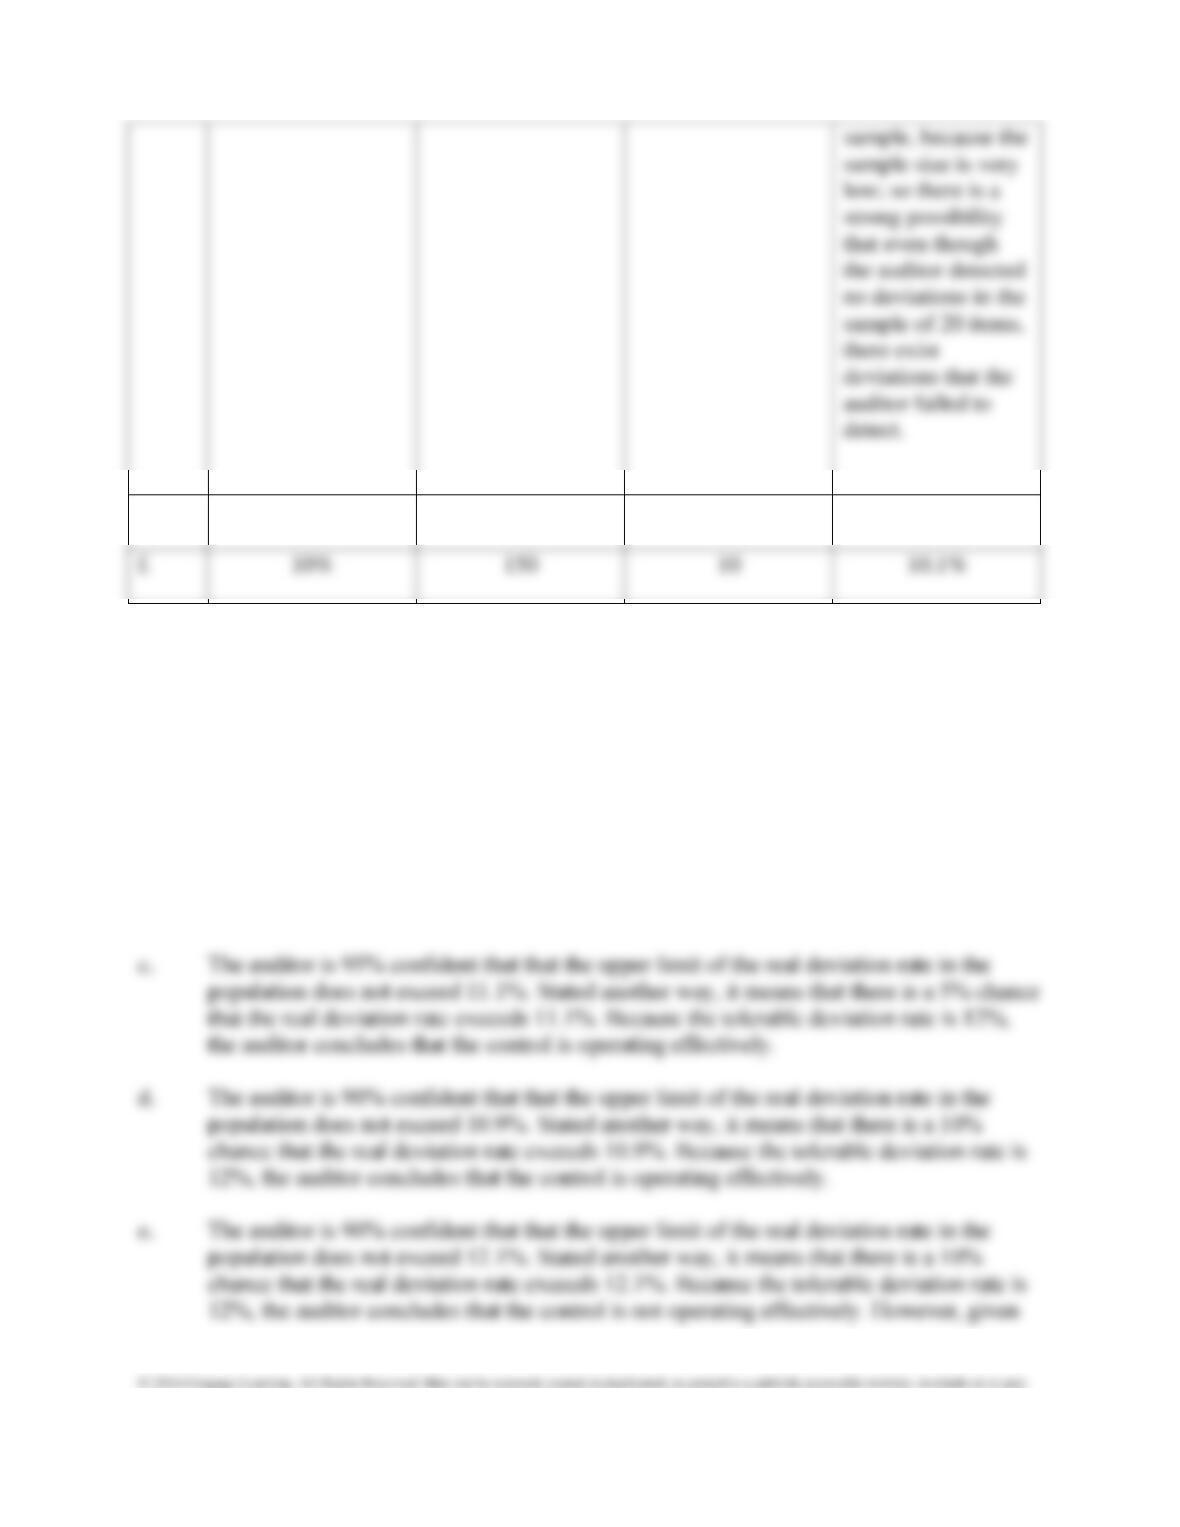
Sampling risk
Sample Size
Number of
Deviations
Upper Limit of
Deviations
a.
5%
20
0
14.0%
The upper limit is
greater than 0, even
though there were
no deviations,
b.
5%
75
5
13.6%
c.
5%
150
10
11.1%
d.
10%
20
0
10.9%
The upper limit is
greater than 0, even
though there were
no deviations in the
8-9
e.
10%
75
5
12.1%
Interpretations:
a. The auditor is 95% confident that that the upper limit of the real deviation rate in the
population does not exceed 14.0%. Stated another way, it means that there is a 5% chance
that the real deviation rate exceeds 14.0%. Because the tolerable deviation rate is 12%,
the auditor concludes that the control is not operating effectively.
b. The auditor is 95% confident that that the upper limit of the real deviation rate in the
population does not exceed 13.6%. Stated another way, it means that there is a 5% chance
that the real deviation rate exceeds 13.6%. Because the tolerable deviation rate is 12%,
the auditor concludes that the control is not operating effectively.
8-10
8-44
In any sampling application there exists sampling risk. The upper limit takes sampling risk into
account and is the best indicator of the maximum deviation rate in the population and should be
compared to the tolerable failure rate.
The alternative courses of action are:
• A compensating control procedure could be identified and tested. The decision to test the
compensating control procedure will depend on the perceived effectiveness of the control
and the additional cost to test the control procedure.
• A larger sample could be taken, but this is not likely to be cost-beneficial unless the
auditor has reason to believe the original sample was not representative.
8-45
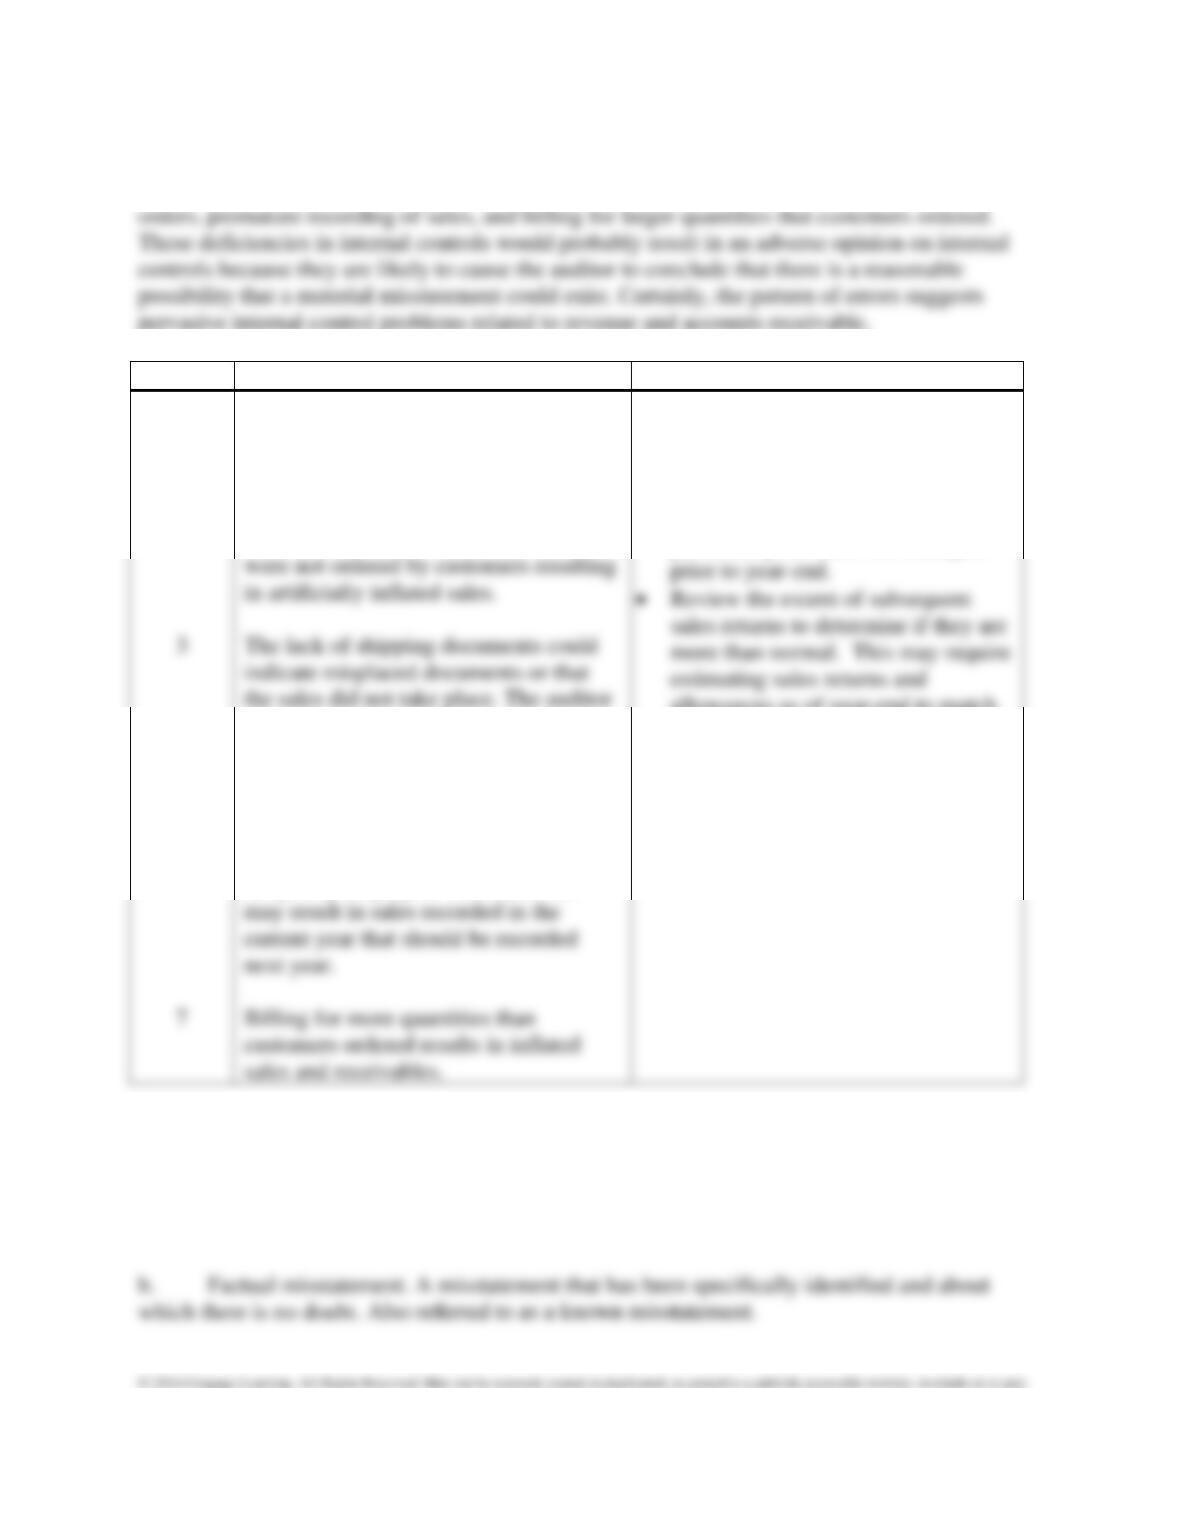
a.
Control
Upper Limit of Control Failures
1
The upper limit is 3%.
2
Since the control calls for credit approval to be noted on the customer
orders, there are five deviations (the auditor must conclude there was no
credit approval for the two sales for which no customer order could be
found). The upper limit is 10.3%.
3
The upper limit is 7.6%.
4
The upper limit is 9%.
5
The upper limit is 3%.
6
The upper limit is 6.2%.
7
There are 6 deviations. The upper limit is 11.5%.
8-11
b. The upper limit of deviation for all controls tested except 1 (sales manager approval of
sales over $10,000) and 5 (proper pricing) exceeded the tolerable deviation rate. Thus, there are
problems with proper credit approval, lack of supporting shipping documents and customer
pervasive internal control problems related to revenue and accounts receivable.
Control
c. Potential Misstatements
d. Effect on rest of audit
2 & 6
4
The allowance for doubtful accounts
may be understated because of the lack
of proper credit approval.
The lack of customer orders for two
recorded sales could mean that the sales
should be professionally skeptical and
assume the worst – the sales did not take
place.
Sales being recorded prior to shipment
could be an honest mistake due to the
temporary employee. However, this
• Carefully review the aging of the
year-end receivables.
• Increase coverage of confirmations
and subsequent collections.
• Increase the extent of cutoff testing
particularly for sales recorded just
allowances as of year-end to match
with the sales.
• Heightened alertness to other
approaches management may use to
manage its earnings, particularly in
the area of accounts based on
estimates
8-46
a. Misstatement. A dollar amount of misstatement, either intentional or unintentional, that
exists in a transaction or financial statement account balance. For substantive sampling purposes,
a misstatement involves differences between recorded values and audited values.
8-12
c. Projected misstatement. The best estimate of the actual amount of dollar misstatements in
the population based on projecting the sample results to the population. The projected
misstatement is calculated as the sampling interval multiplied by the tainting percentage. Also
see likely misstatement or most likely misstatement.
8-47
The sampling unit when gathering evidence about misstatements in account balances and
8-48
Stratification involves the division of a population into two or more sub-groups. Top-stratum
8-49
When using nonstatistical sampling, the auditor must use judgment in determining the sample
size, selecting the sample, and evaluating the sample results:
a. In determining the sample size, all significant items should be tested. The auditor should
select all items over a specific dollar amount, and then, depending on audit objectives, select
items with other characteristics, such as items billed in the last week or billed to specific parties.
c. As is true for statistical sampling, the sample results should be projected to the population
and compared with the tolerable misstatement. The auditor should also consider whether there is
an adequate allowance for sampling risk, the difference between the projected misstatement and
tolerable misstatement.
8-13
8-50
a. Lower stratum projected misstatement: ($600/$185,000) * $1,500,000 = $4,864.86
Plus top-stratum misstatement 1,000.00
Total projected misstatement $5,864.86
b. Tolerable misstatement has been set at $25,000 so the projected misstatement is significantly
less than tolerable misstatement. No further work needs to be performed.
c. When the total estimated misstatement exceeds the tolerable misstatement, the auditor has
available several possible courses of action. The auditor can:
Ask the client to correct the factual misstatements. If this is done, the total estimated
Analyze the detected misstatements for common problem(s). When misstatements are
discovered, the auditor should look beyond the quantitative aspects of the misstatements
to understand the nature and cause of the misstatements—especially to determine if there
is a systematic pattern to the misstatements. If a systematic pattern is found, the client can
be asked to investigate and make an estimate of the correction needed. The auditor can
review and test this estimate. Further, the auditor can recommend improvements to
Design an alternative audit strategy. Discovering more misstatements than expected in
the planning stage of the audit suggests that the planning assumptions may have been in
error and internal controls were not as effective as originally assessed. In such cases, the
Expand the sample. The auditor can increase the sample size. Although, this approach
may not be very useful if the first sample is representative of the population.
Change the audit objective to estimating the correct value. In cases where material
misstatements are likely, it may be necessary to change from an objective of testing
details to an objective of estimating the correct population value. A lower detection risk
8-51
Strengths of MUS include:
• MUS is generally easier to apply than other statistical sampling approaches.
• MUS automatically selects a sample in proportion to an item’s dollar amount,
Examples of the circumstances in which MUS might be used include:
• Accounts receivable confirmations (when credit balances are not significant).
• Loans receivable confirmations (e.g., real estate mortgage loans, commercial
loans, and installment loans).
8-52
The auditor should also be aware of difficulties in using MUS:
• MUS is not designed to test for the understatement of a population.
8-53
8-15
8-54
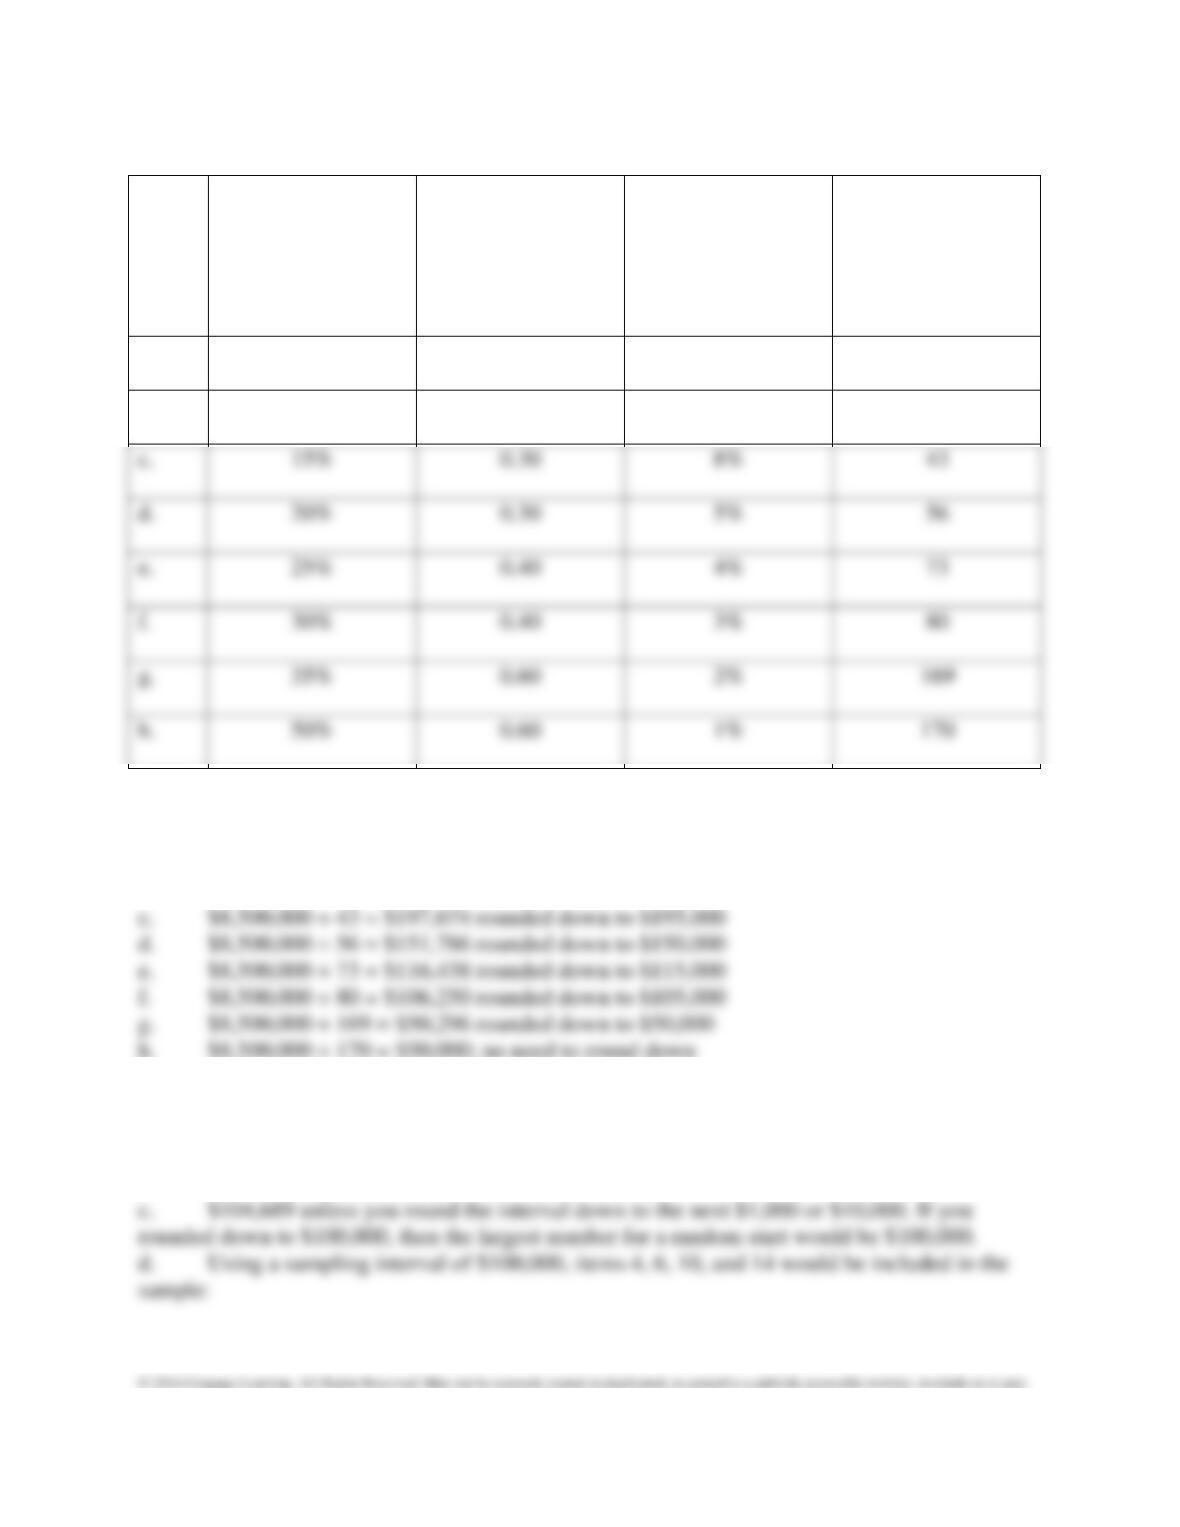
Risk of Incorrect
Acceptance
Ratio of Expected
to Tolerable
Misstatement
Ratio of Tolerable
Misstatement to
Population
Sample Size
a.
5%
0.20
50%
10
b.
10%
0.20
30%
12
c.
15%
0.30
8%
43
d.
20%
0.30
5%
56
30%
0.40
3%
80
g.
35%
0.60
2%
h.
50%
0.60
1%
8-55
a. $8,500,000 ÷ 10 = $850,000; no need to round down
b. $8,500,000 ÷ 12 = 708,333 rounded down to 700,000
8-56
a. From Exhibit 8.7, the sample size is 54.
b. The sampling interval = $5,643,200 ÷ 54 = 104,689