Comprehensive Review Page 301 Chapter 8
unfavorable) sign.
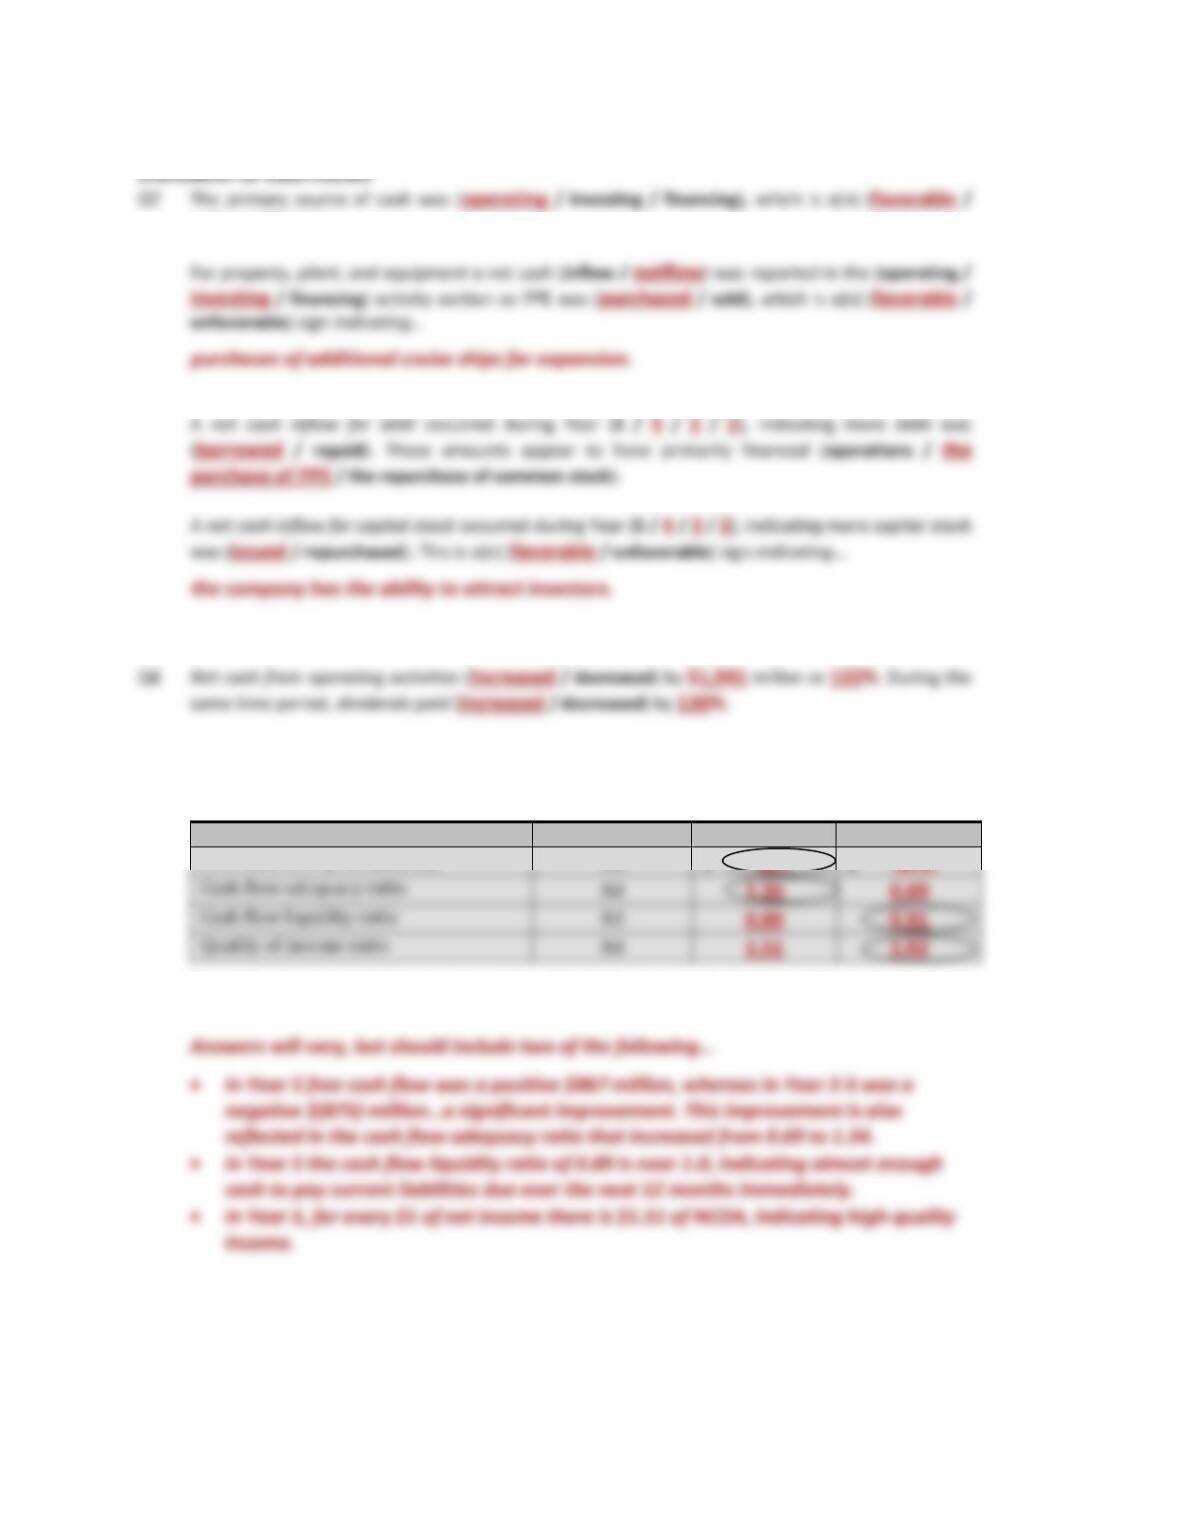
Q9 Compute the ratios requested in the chart below. For ratio formulas and explanation refer to
Appendix B—Ratios.
Carnival Corporation
Industry Norm
Year 5
Year 3
Free cash flow ($ in millions)
NA
$ 867
$ (875)
Cash flow adequacy ratio
NA
Cash flow liquidity ratio
NA
Quality of income ratio
NA
For each ratio, (a) circle the company ratio with the least amount of risk and (b) comment on the
results.
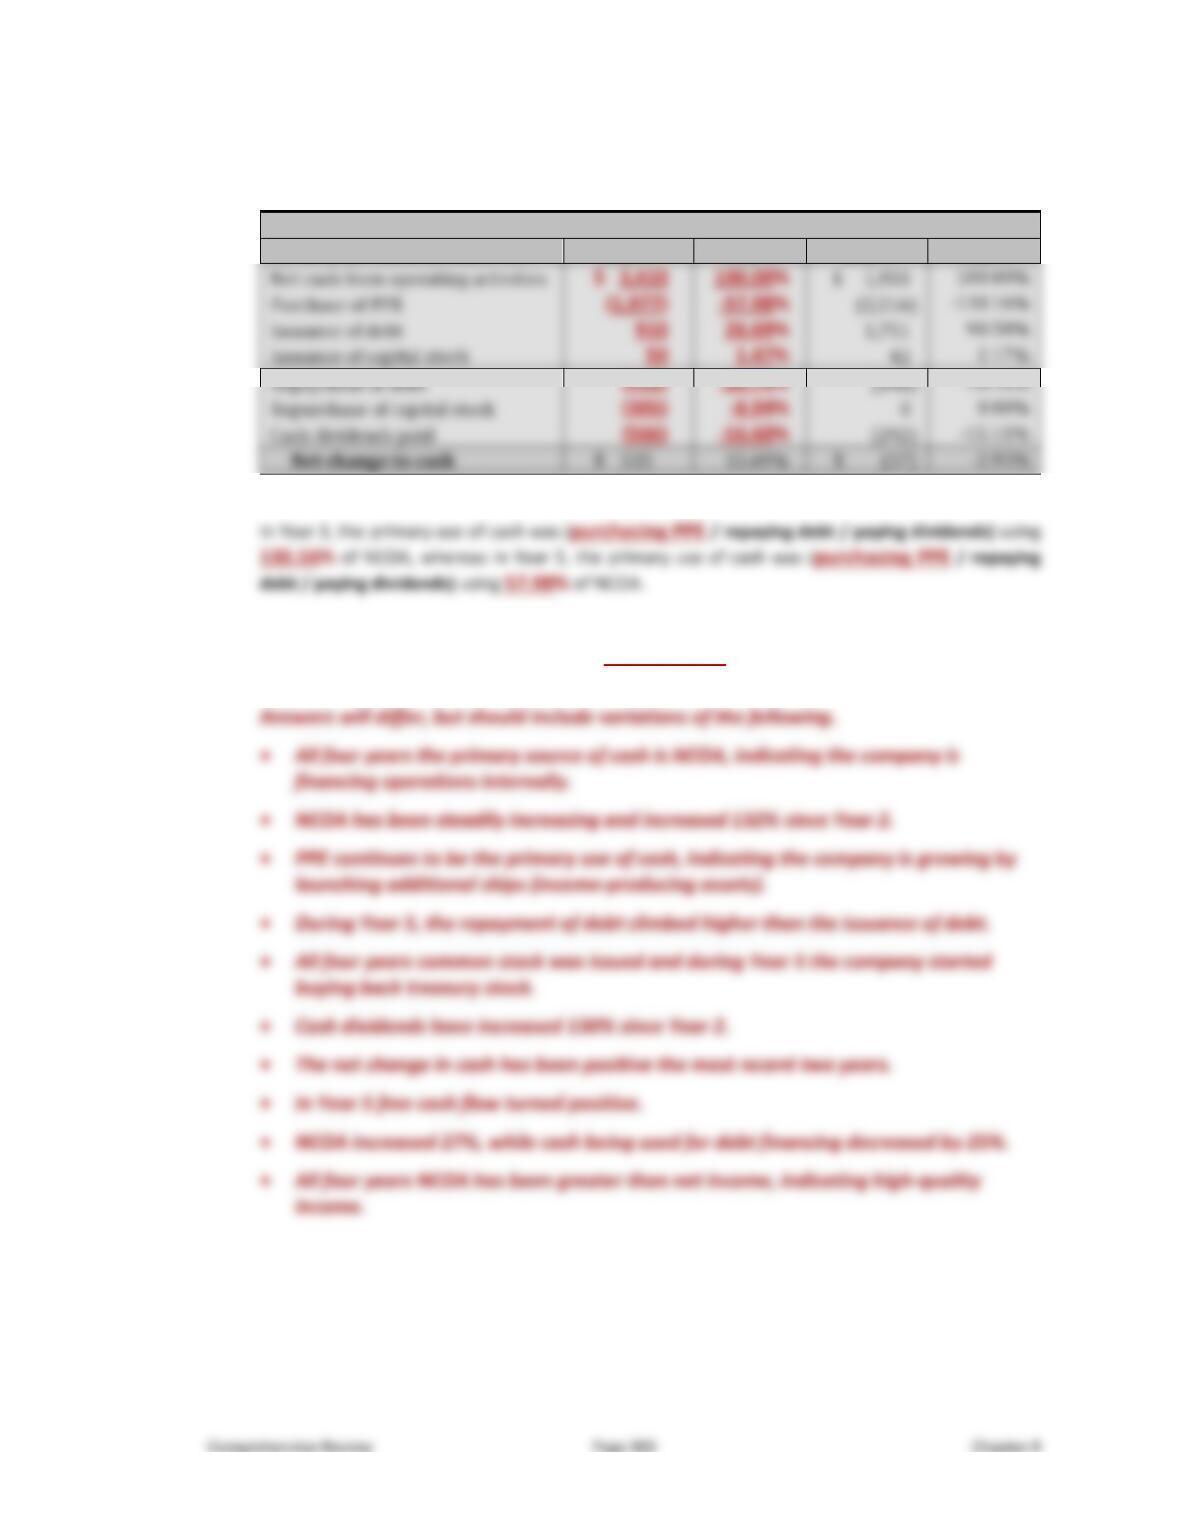
Q10 Complete the common-size Statement of Cash Flows for Year 5. Only select accounts are reported
below.
Carnival Corporation STATEMENT OF CASH FLOWS Common-Size ($ in millions)
For the years ended November 30,
Year 5
Year 5
Year 3
Year 3
* Only select amounts are listed above and will not necessarily sum to the total.
Q11 The statement of cash flows indicates a (strengthening / steady / weakening) cash position.
Why? Comment on your observations.
Comprehensive Review Page 303 Chapter 8
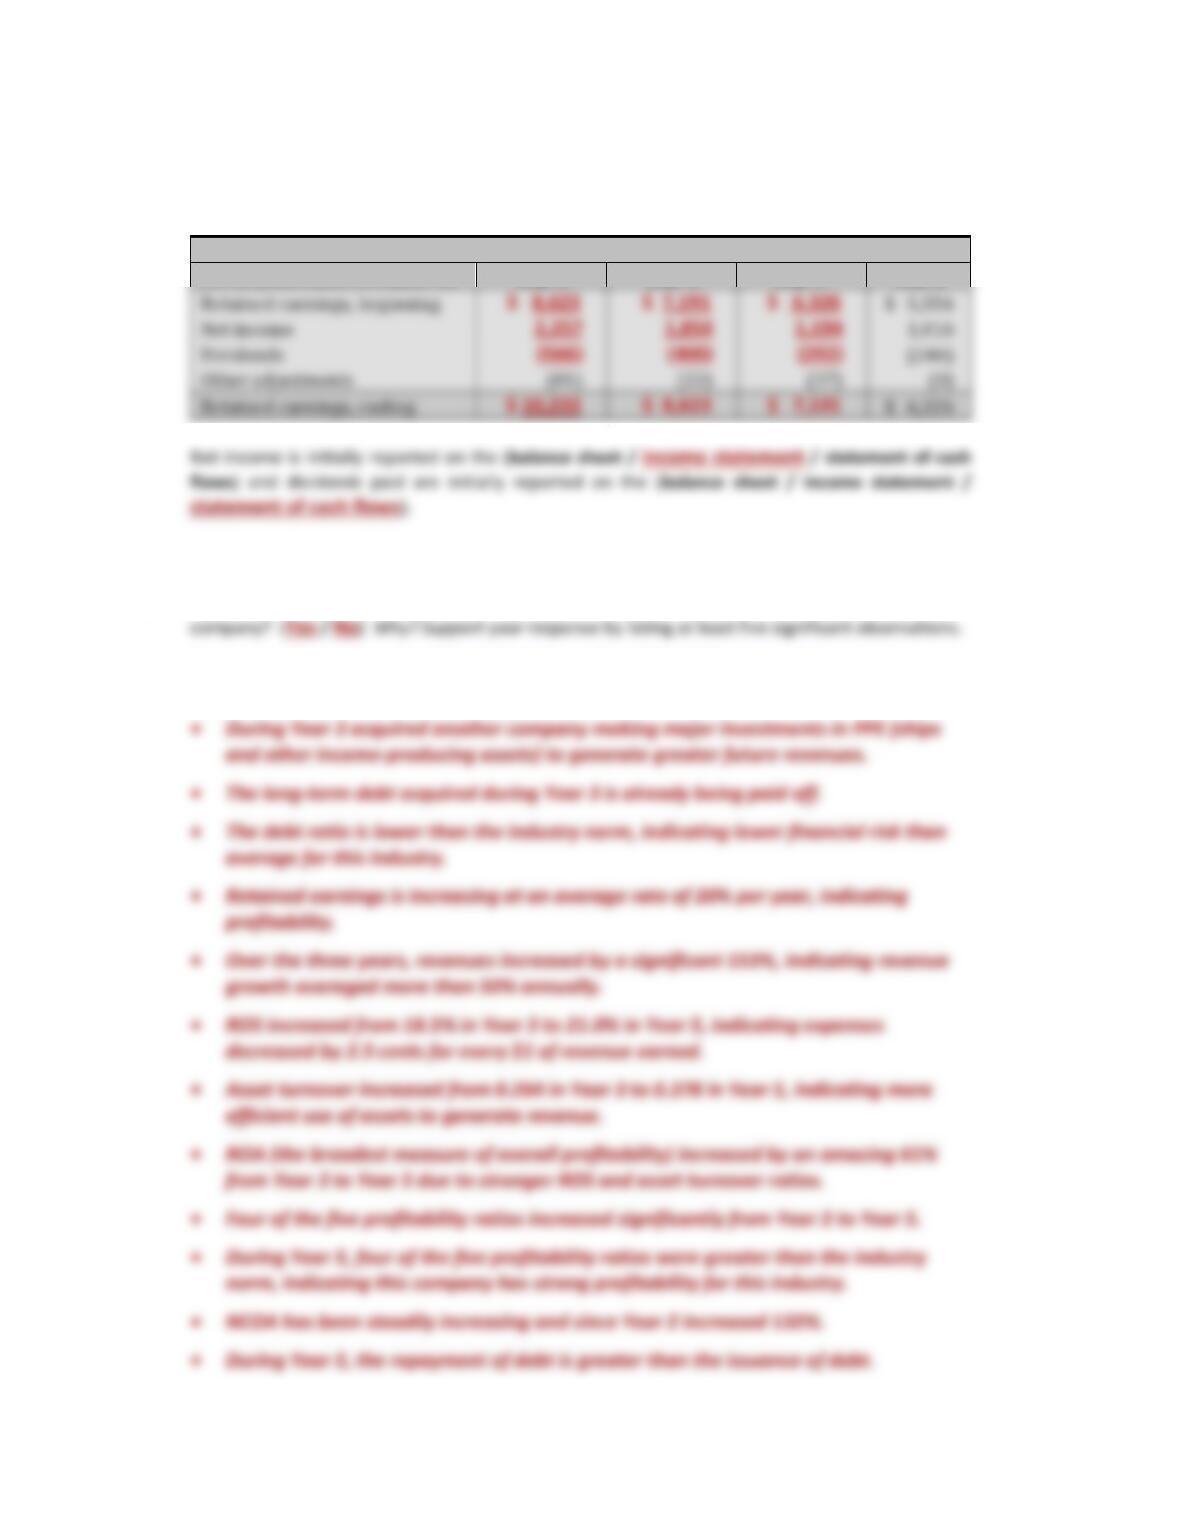
STATEMENT OF RETAINED EARNINGS
Q12 Complete the statement of retained earnings below.
Carnival Corporation STATEMENT OF RETAINED EARNINGS ($ in millions)
For the years ended November 30,
Year 5
Year 4
Year 3
Year 2
OTHER
Q13 Based on the financial statements presented for Carnival Corporation, would you invest in this
Answers will vary, but should include at least five of the following points:
Yes, I would invest in this company because…
Comprehensive Review Page 305 Chapter 8
ACTIVITY 107 TEST YOUR UNDERSTANDING—CIRCUIT CITY
Purpose: • Analyze the income statement, the balance sheet, and the statement of cash flows.
• Prepare a statement of retained earnings.
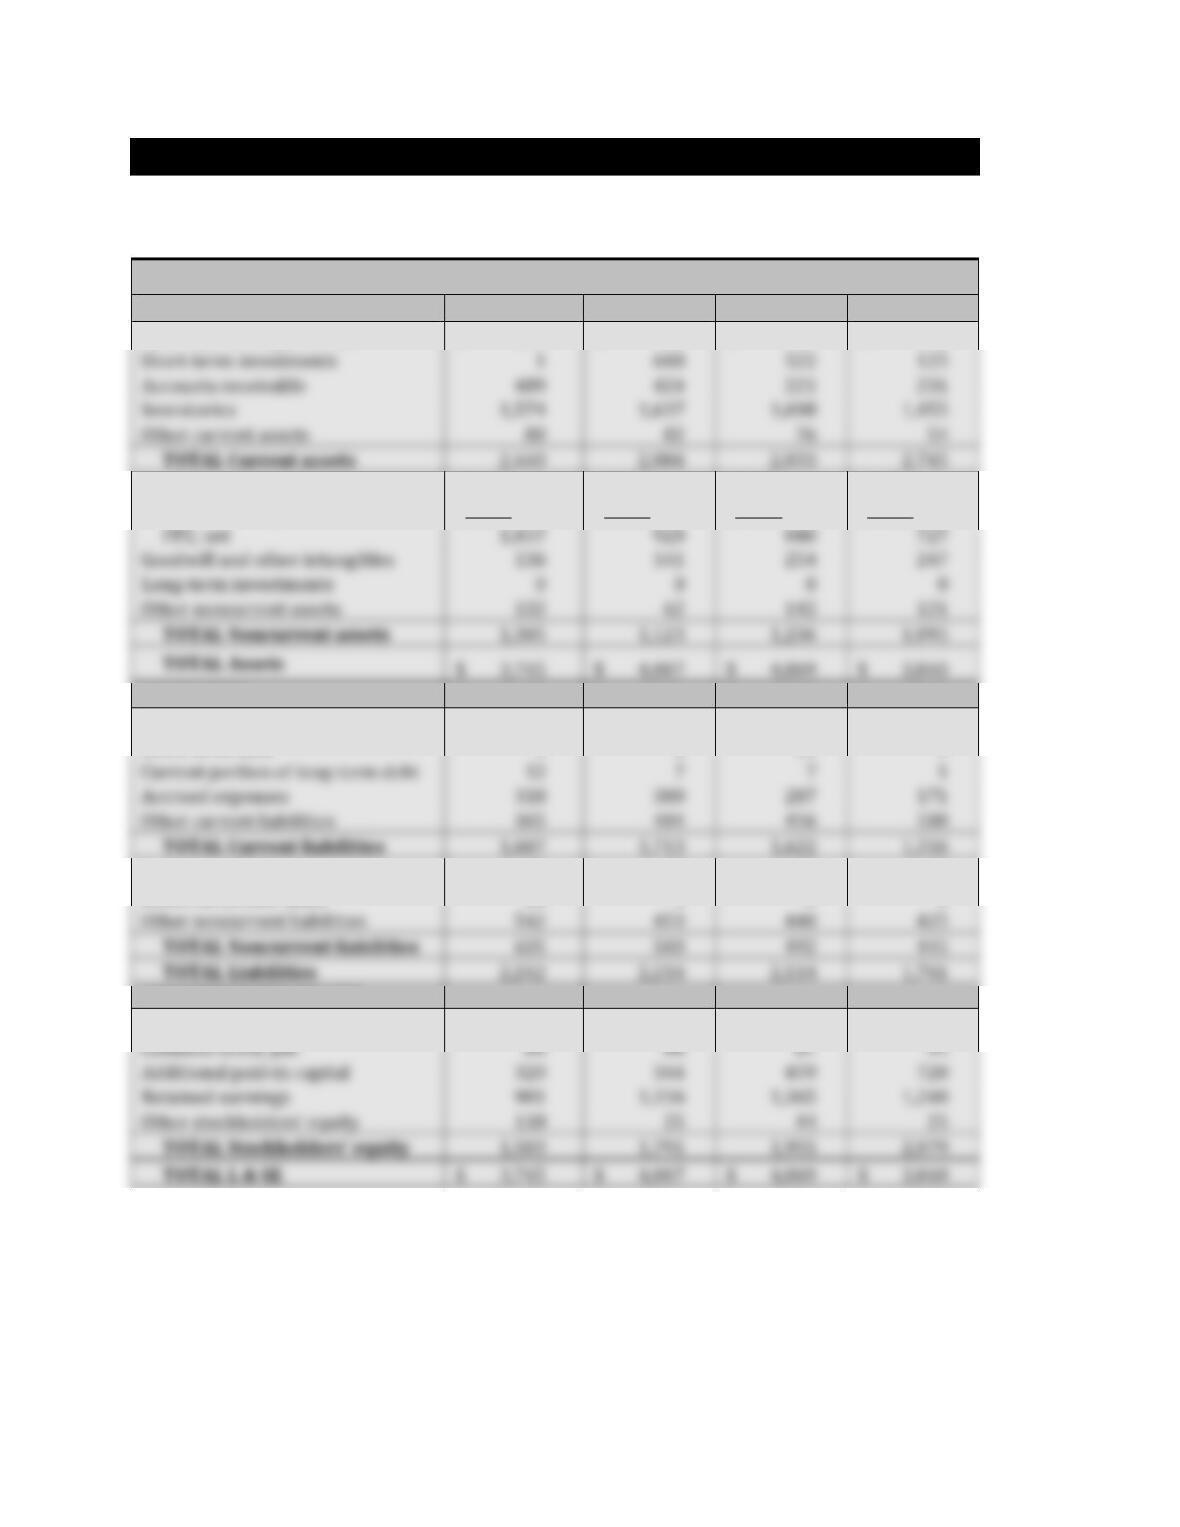
Circuit City Stores (CCYTQ) BALANCE SHEET ($ in millions)
ASSETS
2/28/Year 7
2/28/Year 6
2/28/Year 5
2/28/Year 4
Cash and cash equivalents
$ 296
$ 141
$ 316
$ 880
Property, plant, and equipment
2,485
2,220
2,019
1,820
Accumulated depreciation
(1,448)
(1,300)
(1,179)
(1,093)
PPE, net
Goodwill and other intangibles
Long-term investments
0
0
0
0
Other noncurrent assets
62
TOTAL Noncurrent assets
$ 3,745
$ 4,007
$ 3,840
LIABILITIES
Accounts payable
$ 912
$ 922
$ 850
$ 636
Short-term debt
0
0
22
0
Current portion of long-term debt
12
7
7
1
Accrued expenses
Other current liabilities
TOTAL Current liabilities
Long-term debt
57
50
52
20
Deferred income taxes
36
0
0
0
Other noncurrent liabilities
TOTAL Noncurrent liabilities
TOTAL Liabilities
STOCKHOLDERS’ EQUITY
Preferred stock
0
0
0
0
Common stock, par
84
86
87
94
Additional paid-in capital
Retained earnings
Other stockholders’ equity
25
44
25
TOTAL Stockholders’ equity
TOTAL L & SE
$ 3,745
$ 4,007
$ 3,840
Short-term investments
1
Accounts receivable
Inventories
Other current assets
80
82
54
TOTAL Current assets
Comprehensive Review Page 306 Chapter 8
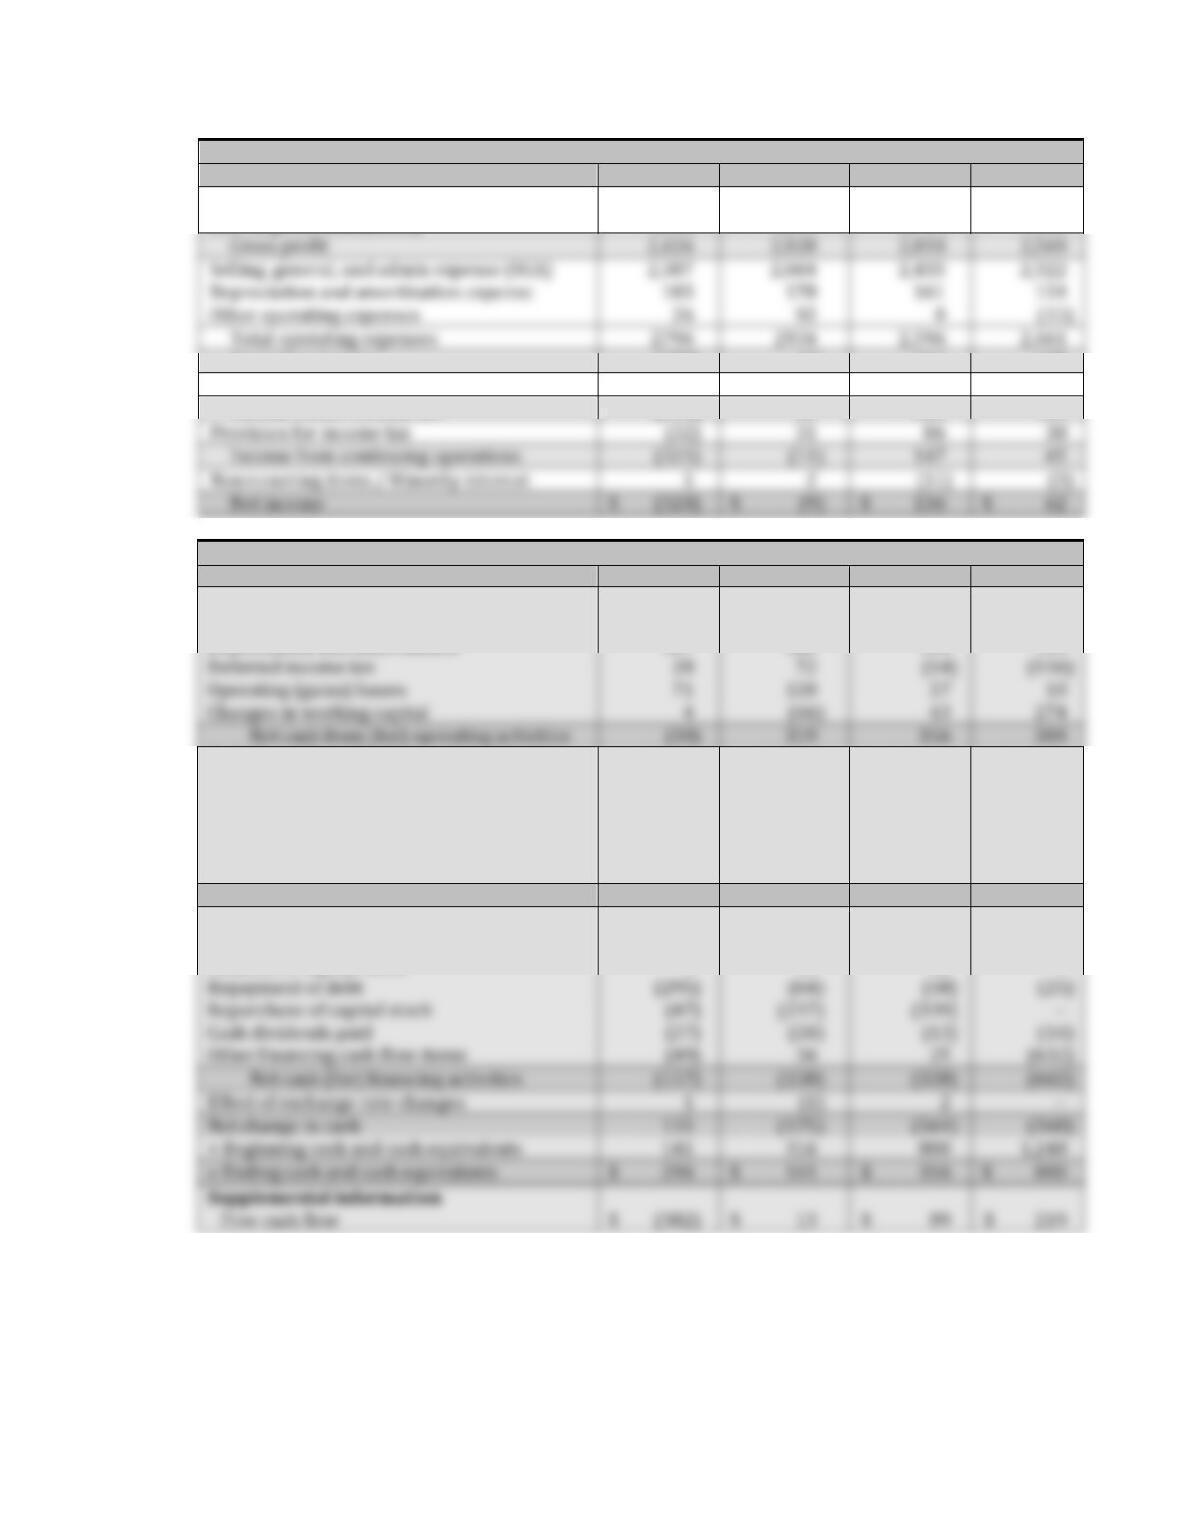
Circuit City Stores (CCYTQ) INCOME STATEMENT ($ in millions)
For the years ended February 28,
Year 7
Year 6
Year 5
Year 4
Revenue
$
11,744
$
12,430
$
11,514
$
10,470
Cost of goods sold (COGS)
9,318
9,501
8,704
7,901
Operating income
(370)
(6)
214
108
Interest income (expense) and other
17
26
19
(5)
Income before income tax
(353)
20
233
103
Provision for income tax
31
86
38
Income from continuing operations
(321)
(11)
147
65
Nonrecurring items / Minority interest
1
(3)
Net income
$
(320)
$
(9)
$
136
$
62
Circuit City (CCYTQ) STATEMENT OF CASH FLOWS ($ in millions)
For the years ended February 28,
Year 7
Year 6
Year 5
Year 4
Cash flows from (for) operating activities
Net income (loss)
$
(320)
$
(9)
$
136
$
62
Depreciation and amortization
187
182
164
154
Deferred income tax
28
72
(116)
Operating (gains) losses
71
120
27
10
Changes in working capital
4
43
Net cash from (for) operating activities
319
356
Cash flows from (for) investing activities
Sale of property, plant, and equipment
71
39
55
61
Sale of investments
3,246
1,926
1,015
—
Purchase of property, plant, and equipment
(325)
(286)
(254)
(151)
Purchase of investments
(2,650)
(2,002)
(1,410)
—
Other investing cash flow items
(1)
(12)
—
—
Net cash from (for) investing activities
341
(335)
(594)
(90)
Cash flows from (for) financing activities
Issuance of debt
256
37
19
—
Issuance of capital stock
5
90
38
9
Repayment of debt
(295)
(64)
(25)
Repurchase of capital stock
(237)
(339)
—
Cash dividends paid
(20)
(14)
Other financing cash flow items
36
25
Net cash (for) financing activities
Effect of exchange rate changes
1
(1)
2
—
Net change in cash
155
(175)
(564)
(368)
+ Beginning cash and cash equivalents
141
316
880
= Ending cash and cash equivalents
$
296
$
141
$
316
$
Supplemental information
$
(382)
$
13
$
89
Gross profit
2,426
2,928
2,810
2,569
Selling, general, and admin expense (SGA)
2,587
2,664
2,435
2,322
Depreciation and amortization expense
183
178
161
154
Other operating expenses
26
92
0
Total operating expenses
2,596
2,461
Comprehensive Review Page 307 Chapter 8
Refer to the financial statements presented for Circuit City on the previous two pages to answer the
following questions.
BALANCE SHEET
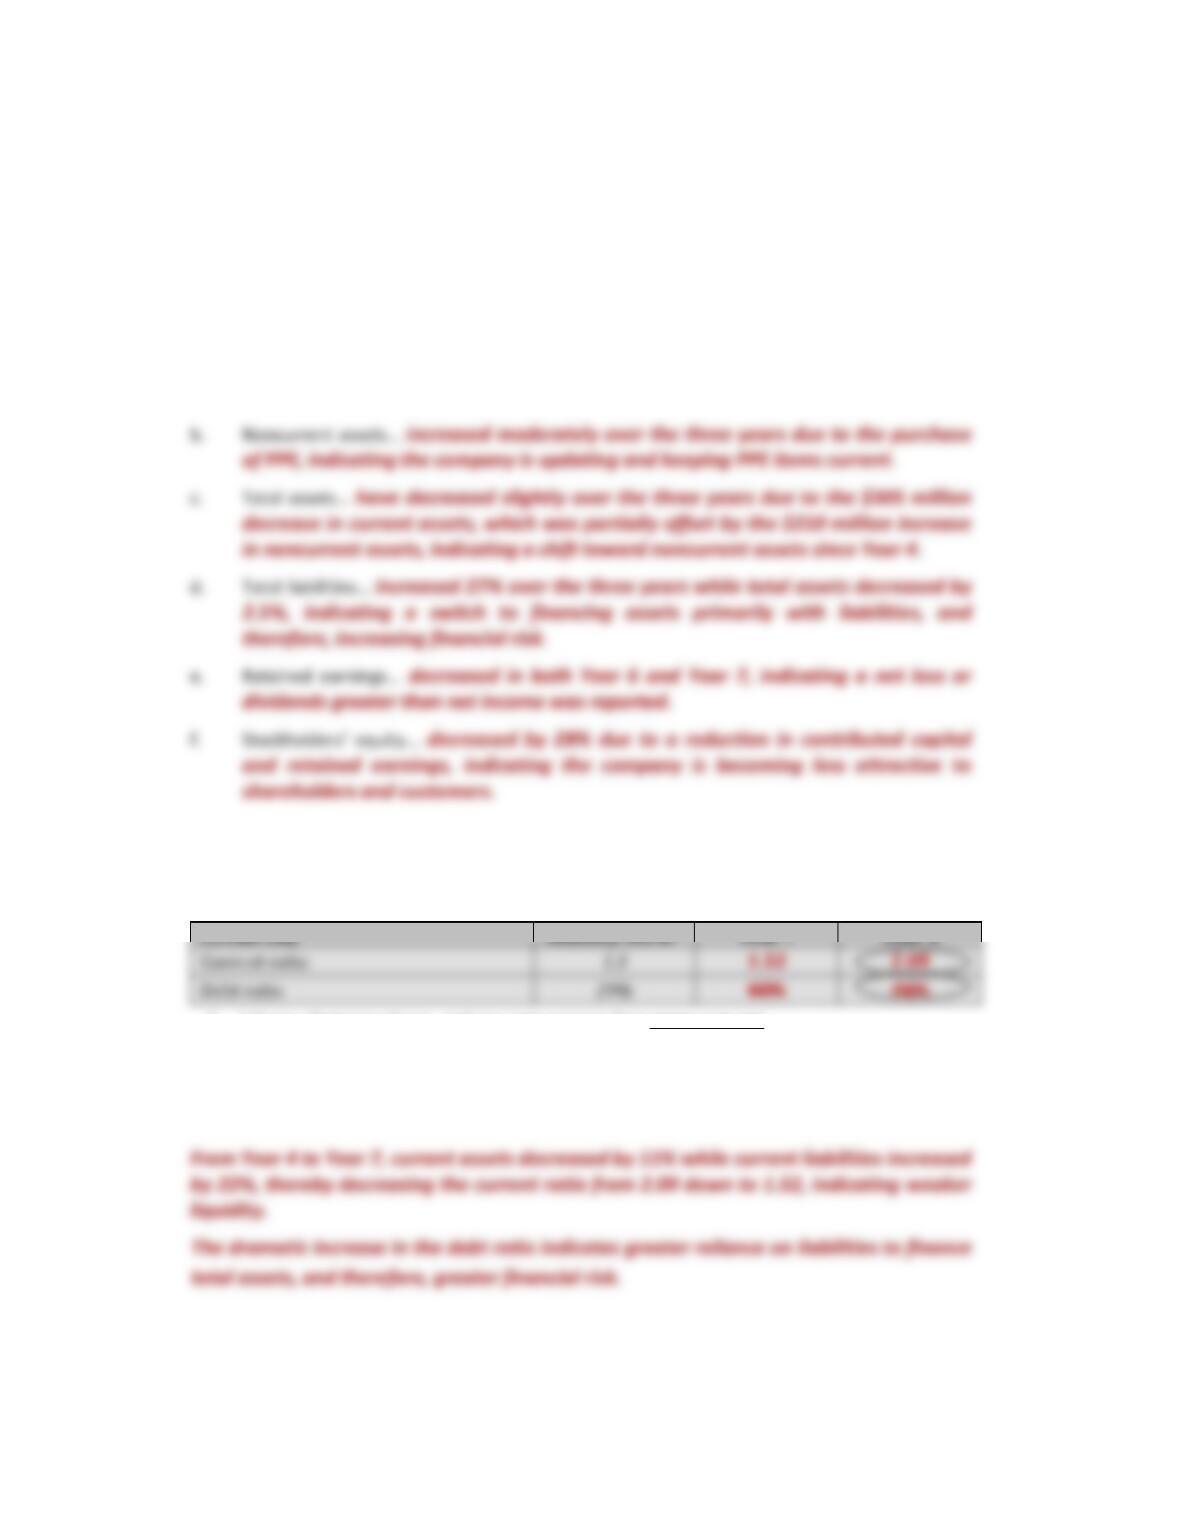
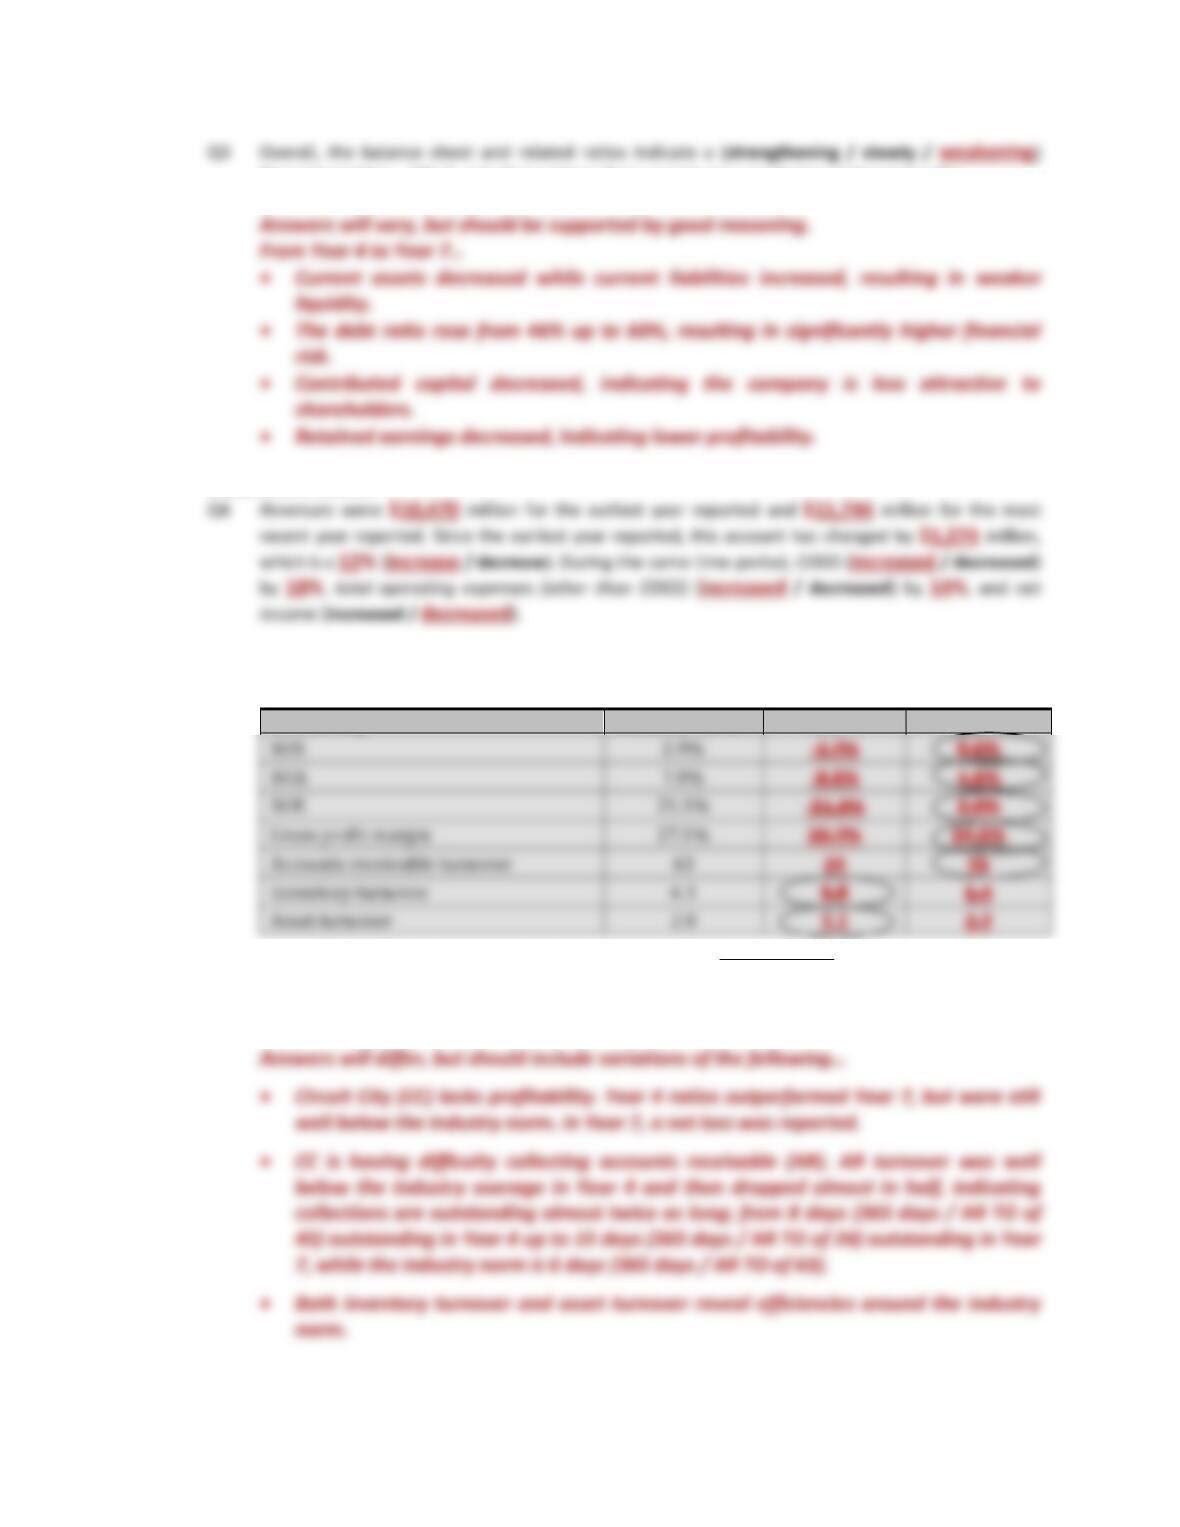
Q1 Review the following accounts, subtotals, and totals; (1) describe your observations; and then (2)
identify what your observations indicate. A response is given for Current Assets to help with
understanding.
a. Current assets… decreased in Year 7 due to a sharp decline in short-term investments and a
dip in inventory. The buildup of accounts receivable accompanied by a decrease in inventory
is cause for concern, indicating credit terms might be too lax.
Q2 Compute the ratios requested in the chart below. For ratio formulas and explanation refer to
Appendix B—Ratios.
* Industry: Electronics Stores—Industry ratio averages from money.msn.com
For each ratio, (a) compare the two years of company ratios and circle the ratio indicating lower
financial risk, (b) cross out any company ratio indicating greater financial risk than the industry
norm, and (c) comment on the results.
Comprehensive Review Page 308 Chapter 8
financial position. Why? List observations that support your conclusion and explain why.
INCOME STATEMENT
Q5 Compute the ratios requested in the chart below. For ratio formulas and explanation refer to
Appendix B—Ratios.
Circuit City
Industry Norm*
Year 7
Year 4
* Industry: Electronics Stores—Industry ratio averages from money.msn.com
For each ratio, (a) circle the stronger ratio, (b) cross out any ratio that is weaker than the industry
norm, and (c) comment on the results.
Comprehensive Review Page 309 Chapter 8
potential. Why? List observations that support your conclusion and explain why.
Answers will differ, but should include variations of the following…
STATEMENT OF CASH FLOWS
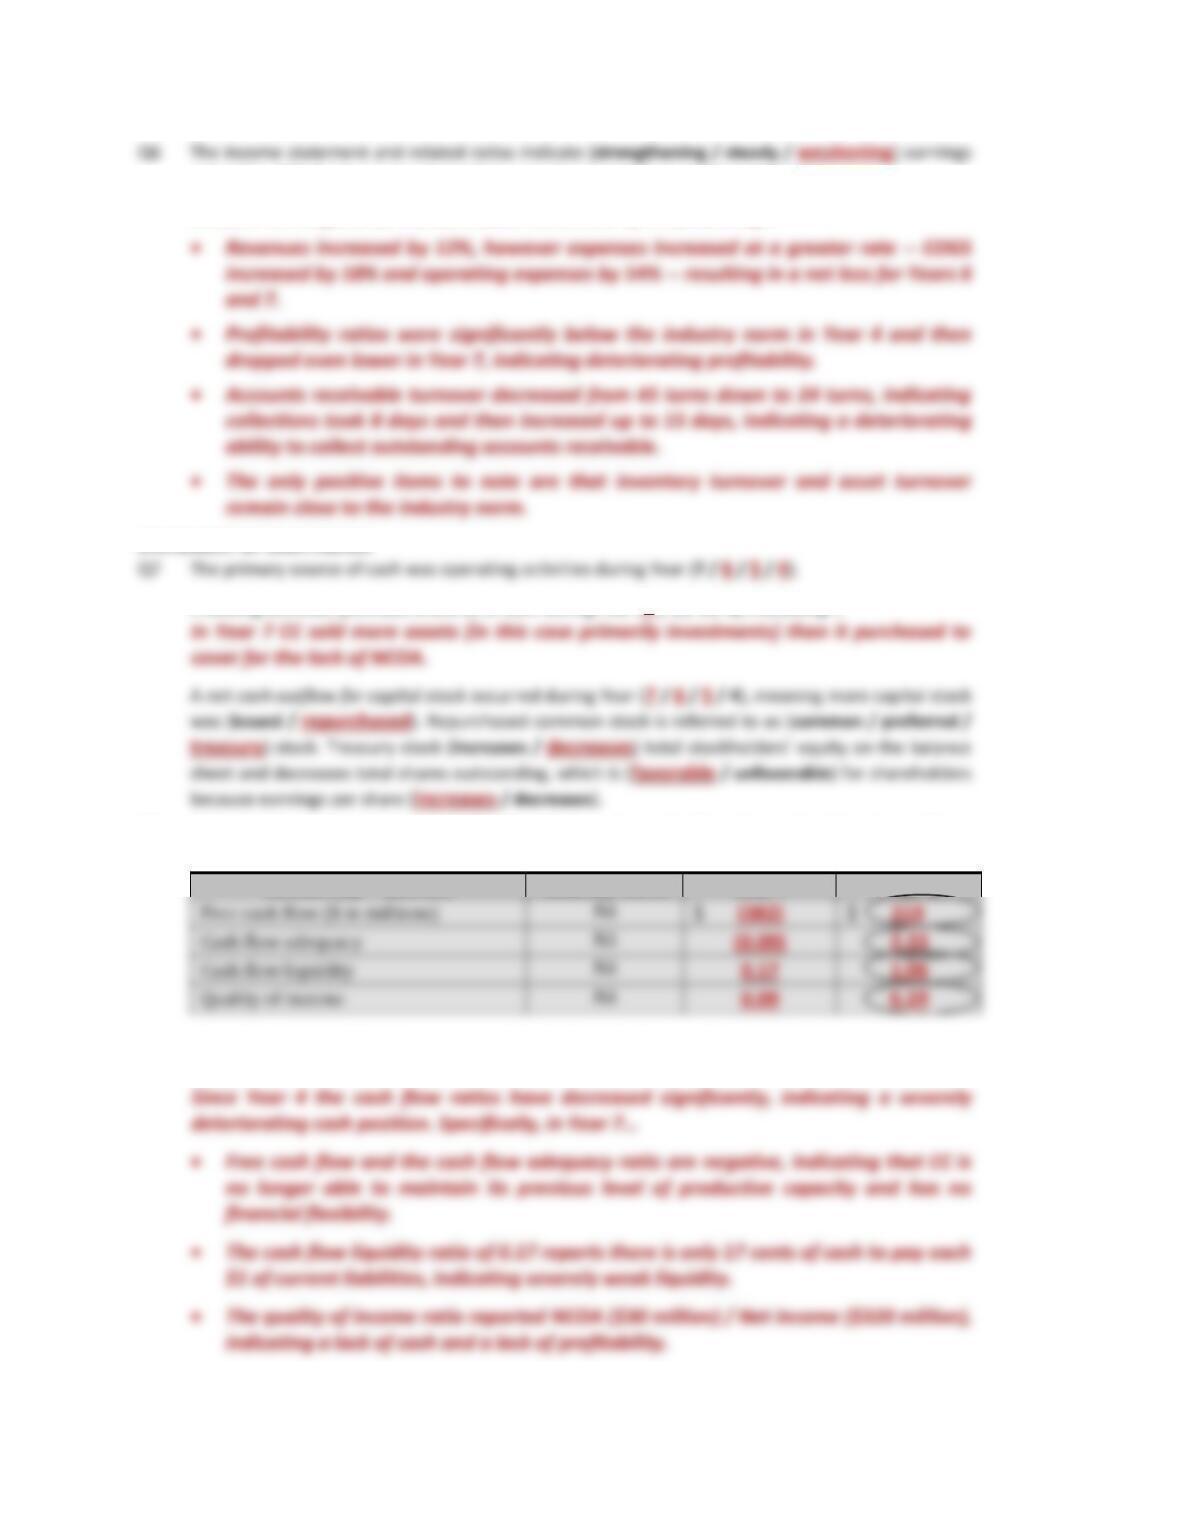
Investing activities provided a source of cash during Year (7 / 6 / 5 / 4), indicating …
Q8 Compute the ratios requested in the chart below. For ratio formulas and explanation refer to
Appendix B—Ratios.
Circuit City RATIOS
Industry Norm
Year 7
Year 4
For each ratio, (a) circle the company ratio with the least amount of risk and (b) comment on the
results.
Q9 The statement of cash flows and related information report a (strengthening / steady /
Answers will differ, but should include variations of the following.
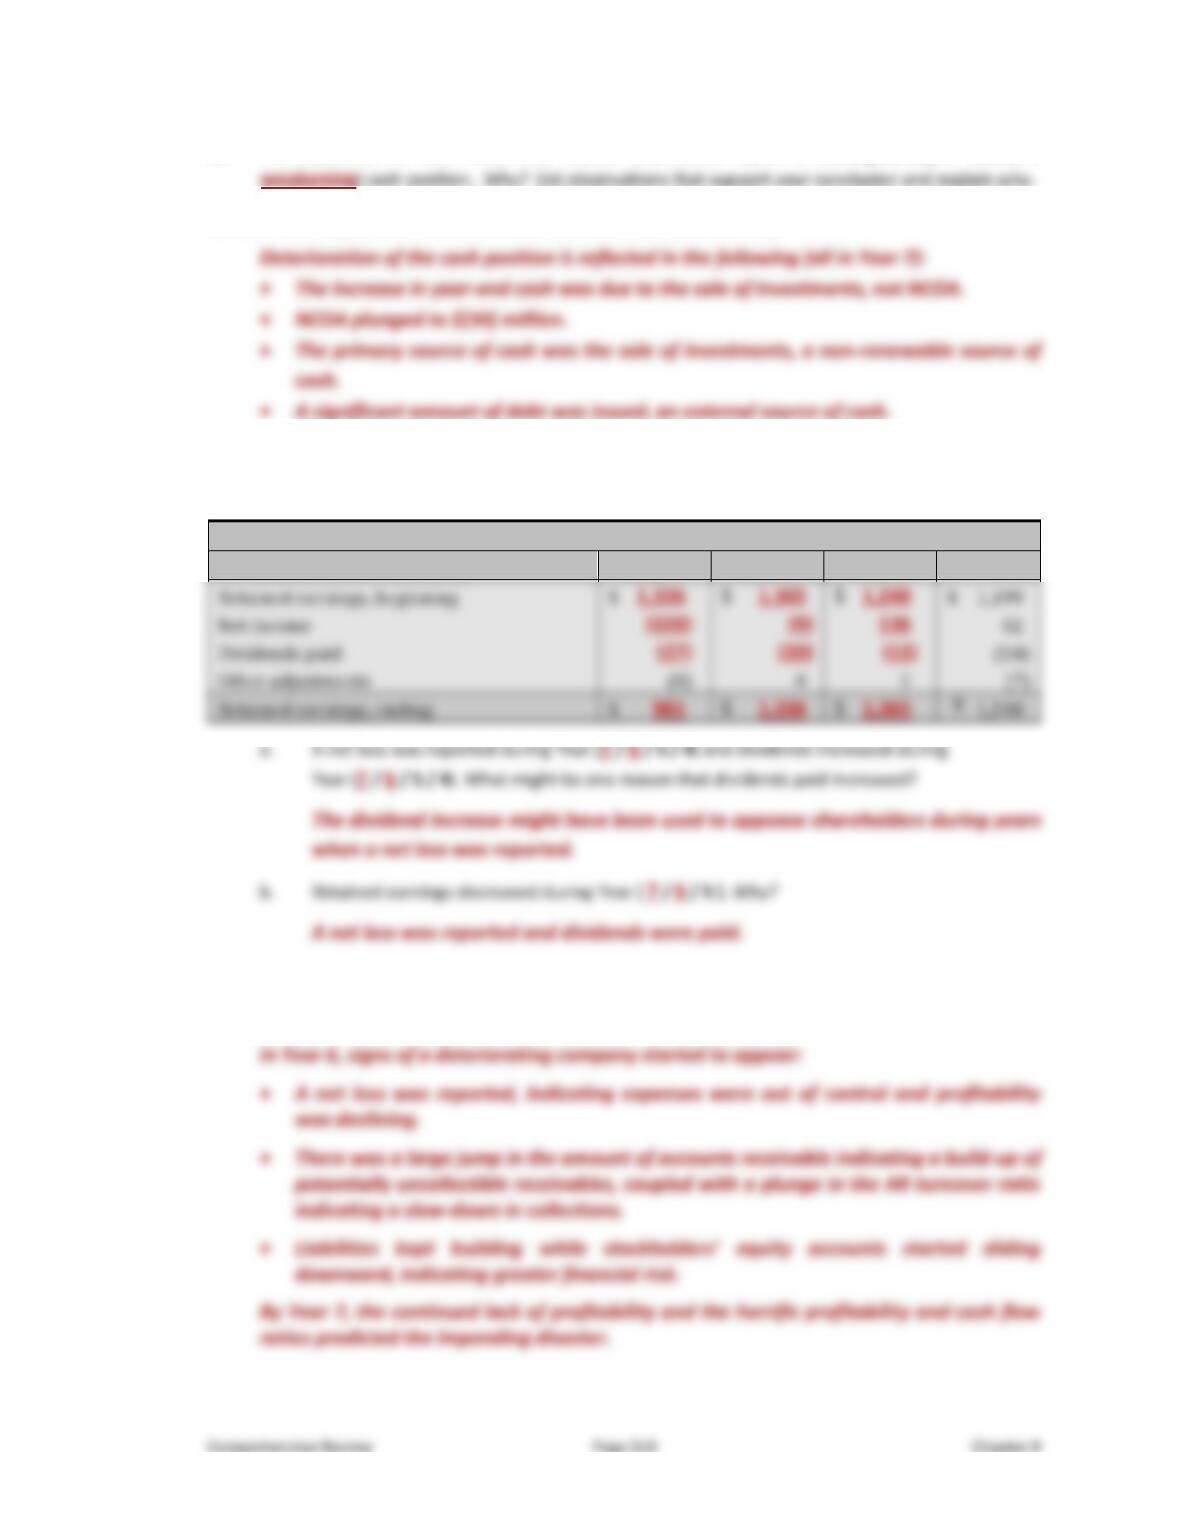
STATEMENT OF RETAINED EARNINGS
Q10 Complete the statement of retained earnings below.
Circuit City STATEMENT OF RETAINED EARNINGS ($ in millions)
For the years ended February 28,
Year 7
Year 6
Year 5
Year 4
OTHER
Q11 Circuit City filed for bankruptcy 6 months into Year 8. What signs of this impending bankruptcy do
you find in these financial statements? When did these signs start to appear?