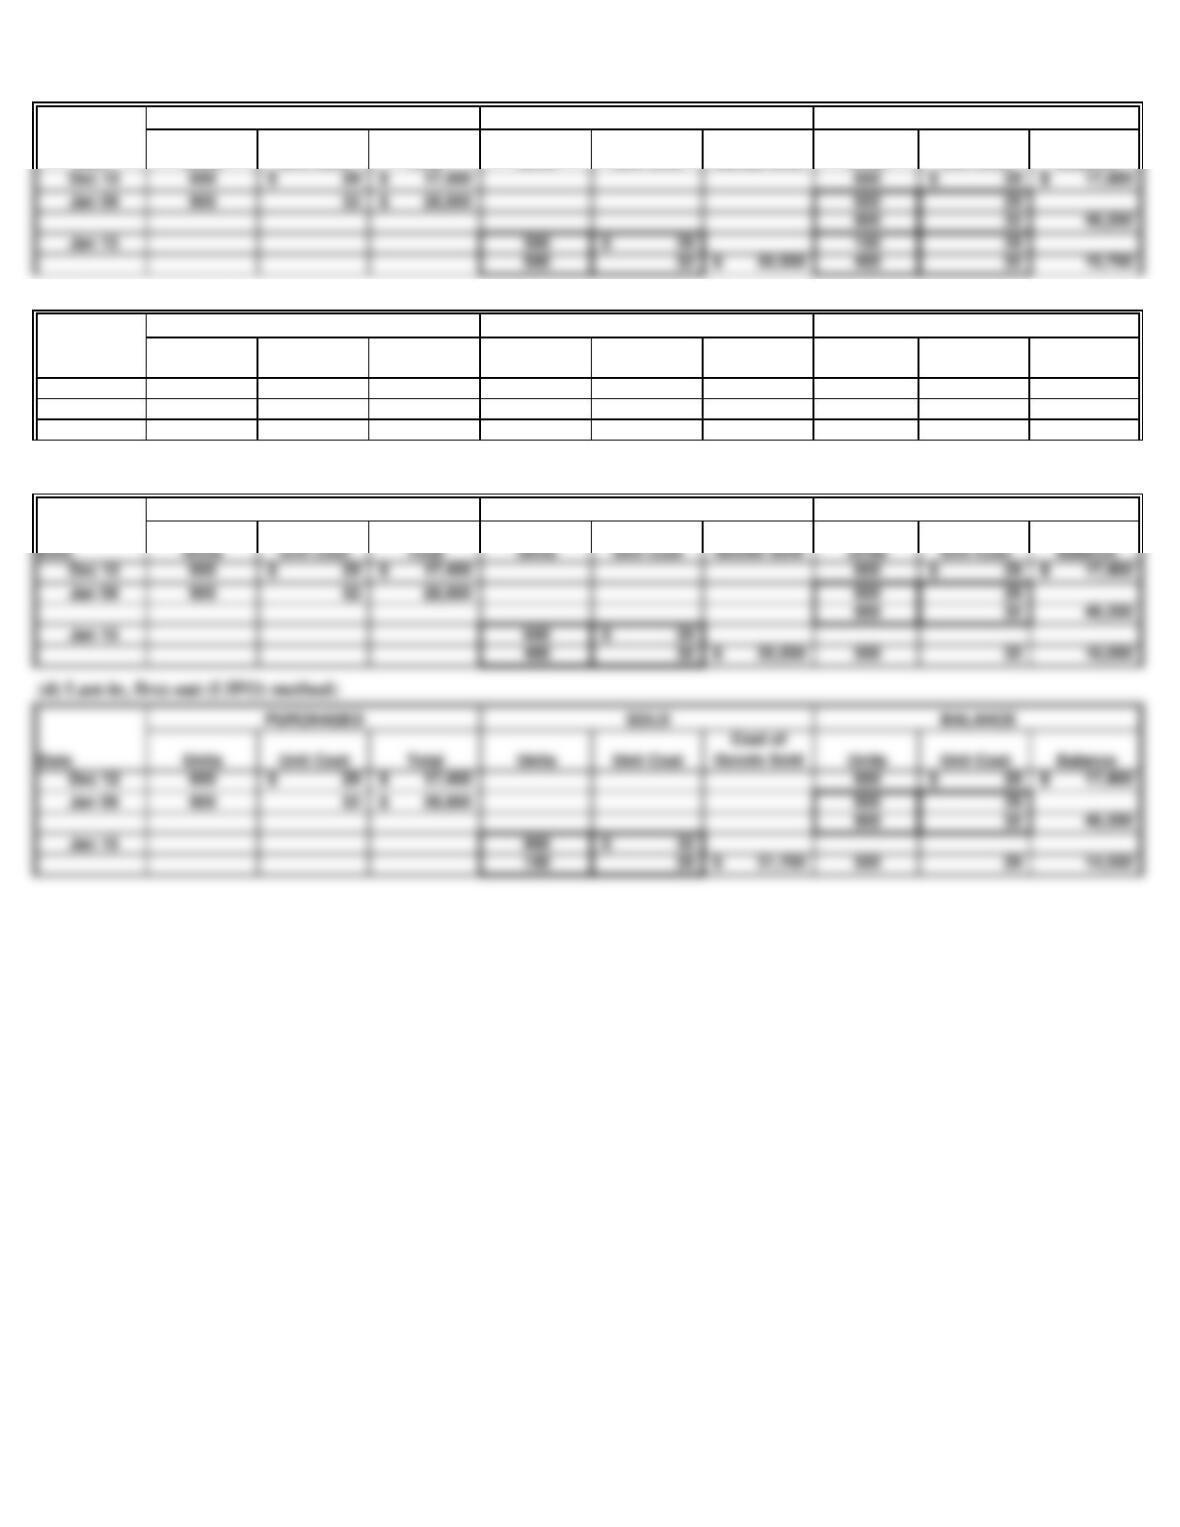
b. Inventory subsidiary ledger records:
(1) Specific identification method:
Date Units Unit Cost Total Units Unit Cost
Cost of
Goods Sold
Units Unit Cost Balance
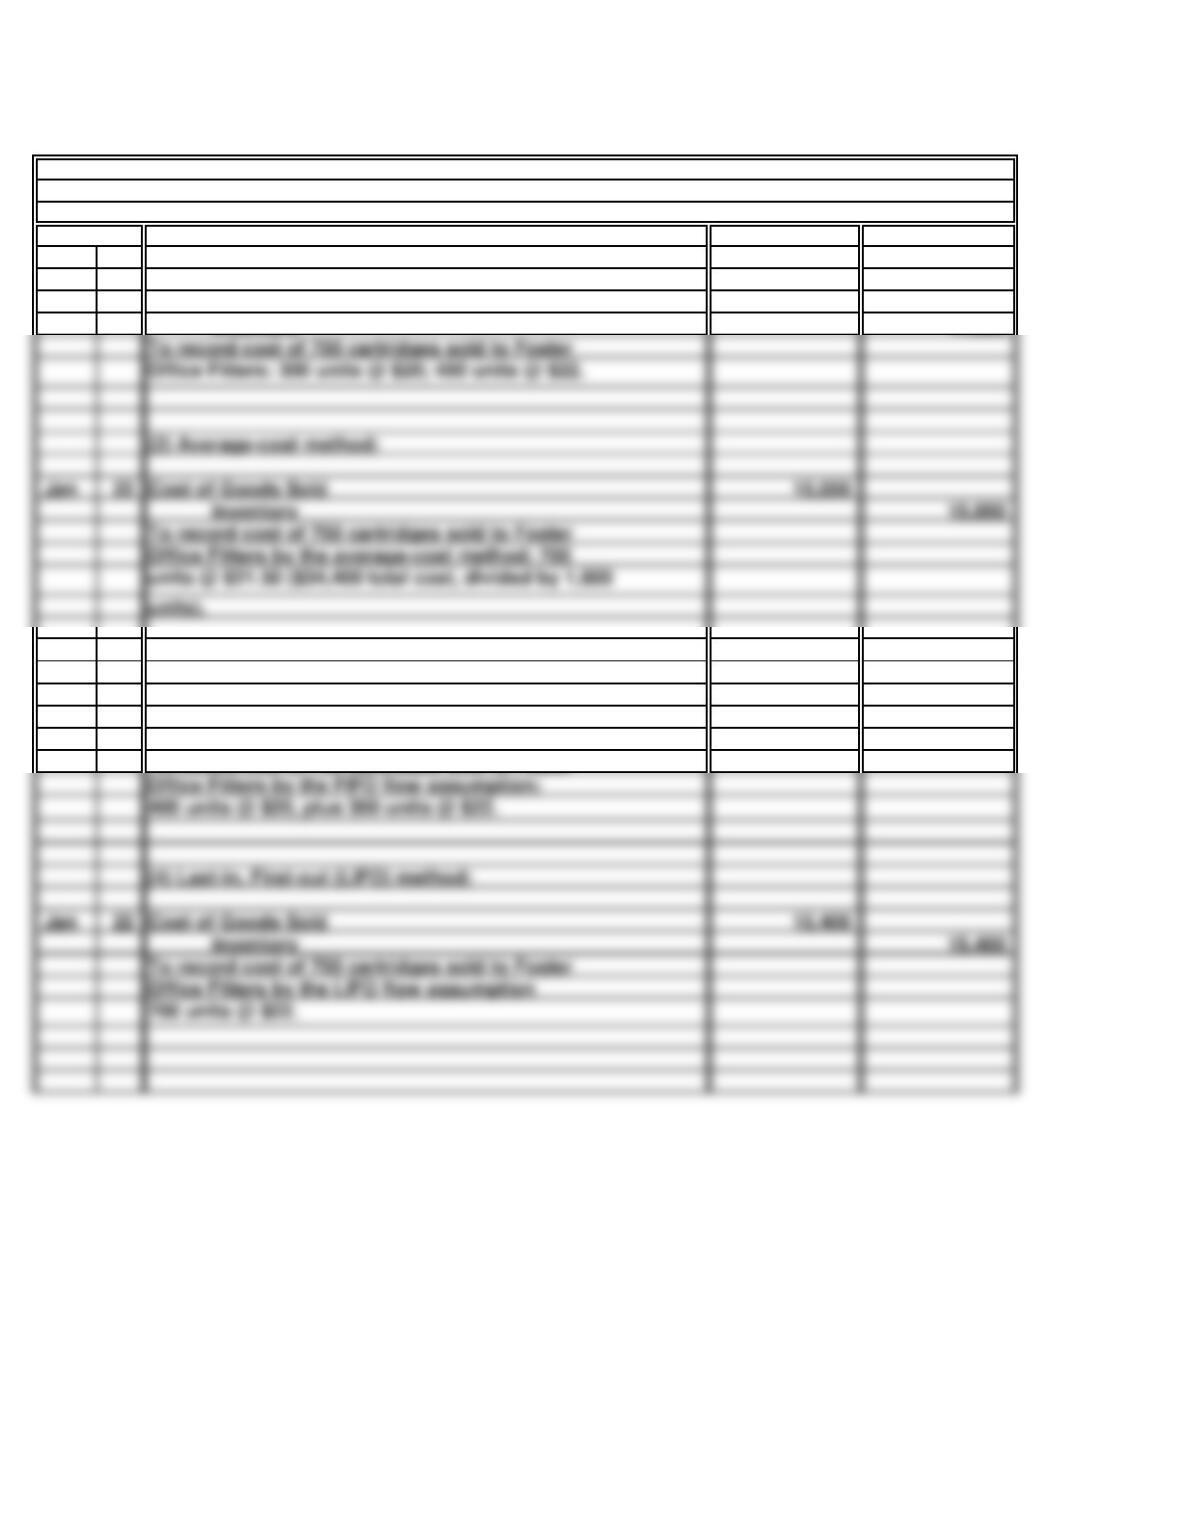
(2) Average-cost method:
Date Units Cost Total Units Cost
Cost of
Goods Sold
Goods Sold
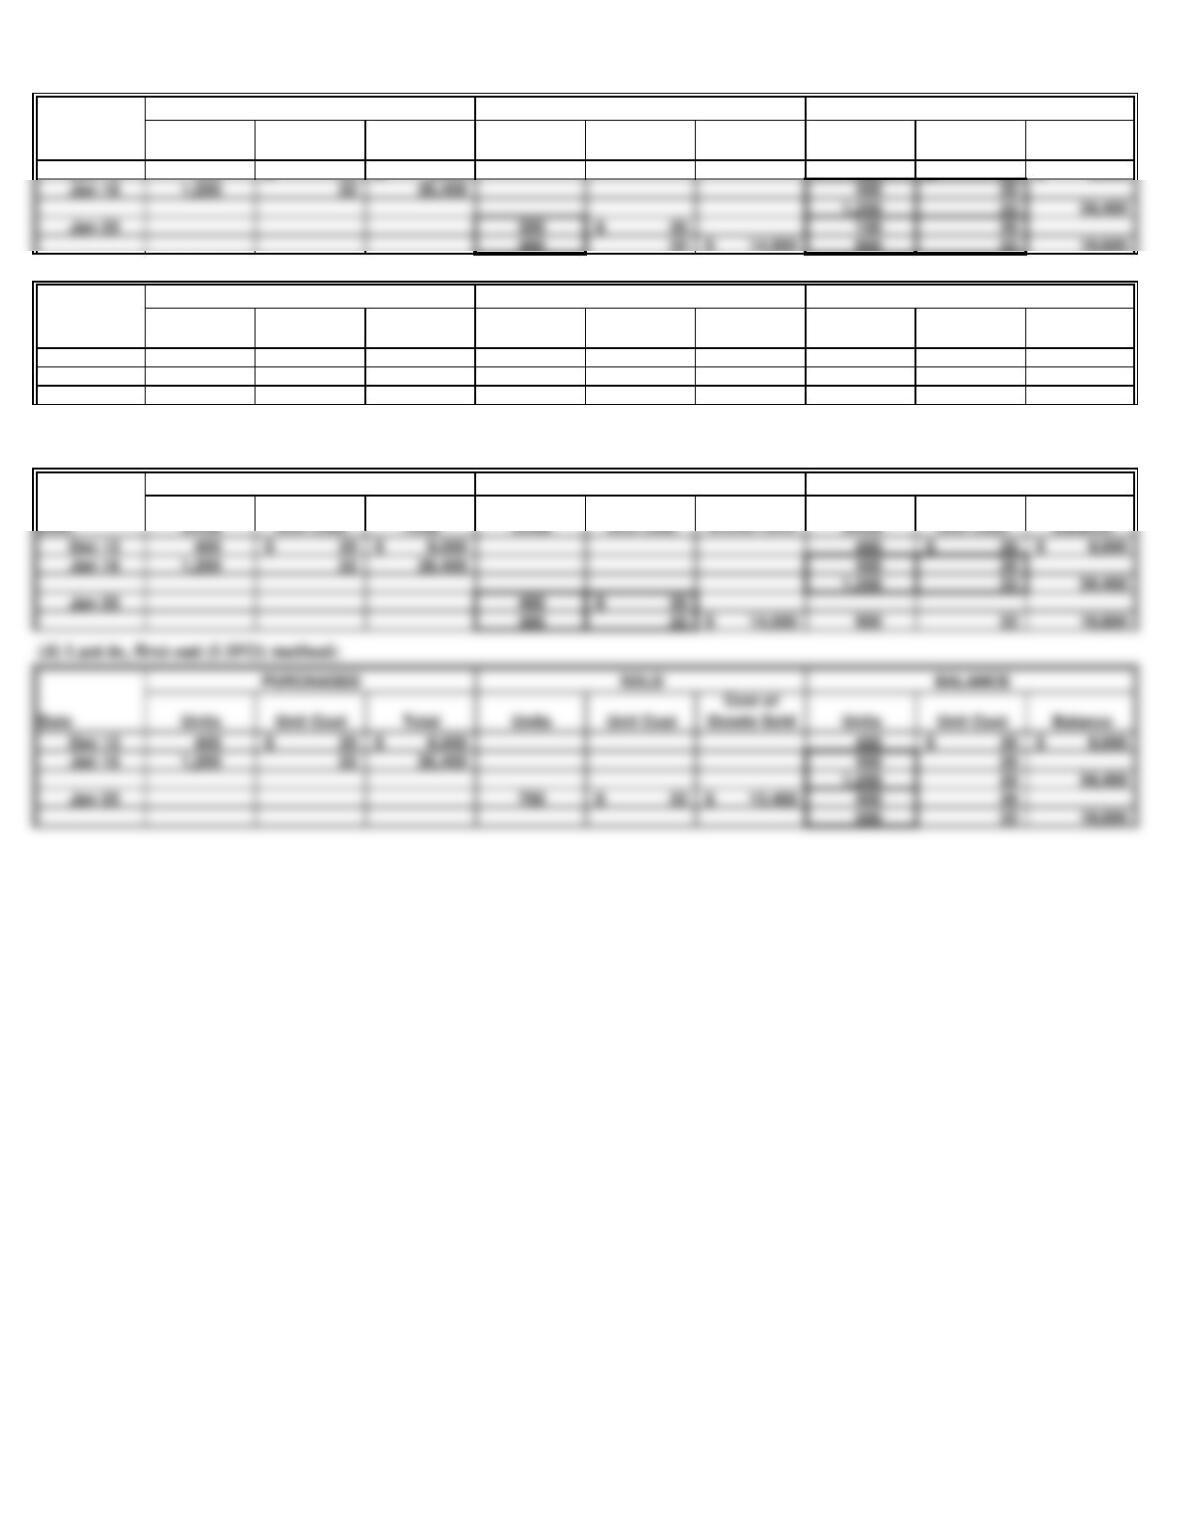
(4) Last-in, first-out (LIFO) method:
Cost of
Goods Sold
SOLD
BALANCE
PURCHASED
Units Cost Balance
Dec 12 600 29$ 17,400$ 600 29.00$ 17,400$
Jan 09 900 32 28,800 1,500 30.80 46,200
Jan 15 1,000 30.80$ 30,800$ 500 30.80 15,400
* $46,200 total cost ÷ 1,500 units = $30.80 average unit cost.
(3) First-in, first-out (FIFO) method:
Cost of
PROBLEM 8.1A
PURCHASED
SOLD
BALANCE
SPORTS WORLD (continued)
PURCHASED
SOLD
BALANCE
PURCHASED
SOLD
BALANCE

c.
PROBLEM 8.1A
SPORTS WORLD (concluded)
No. As shown in part a, the LIFO method resulted in the highest cost of goods sold figure, whereas
30 Minutes, Strong
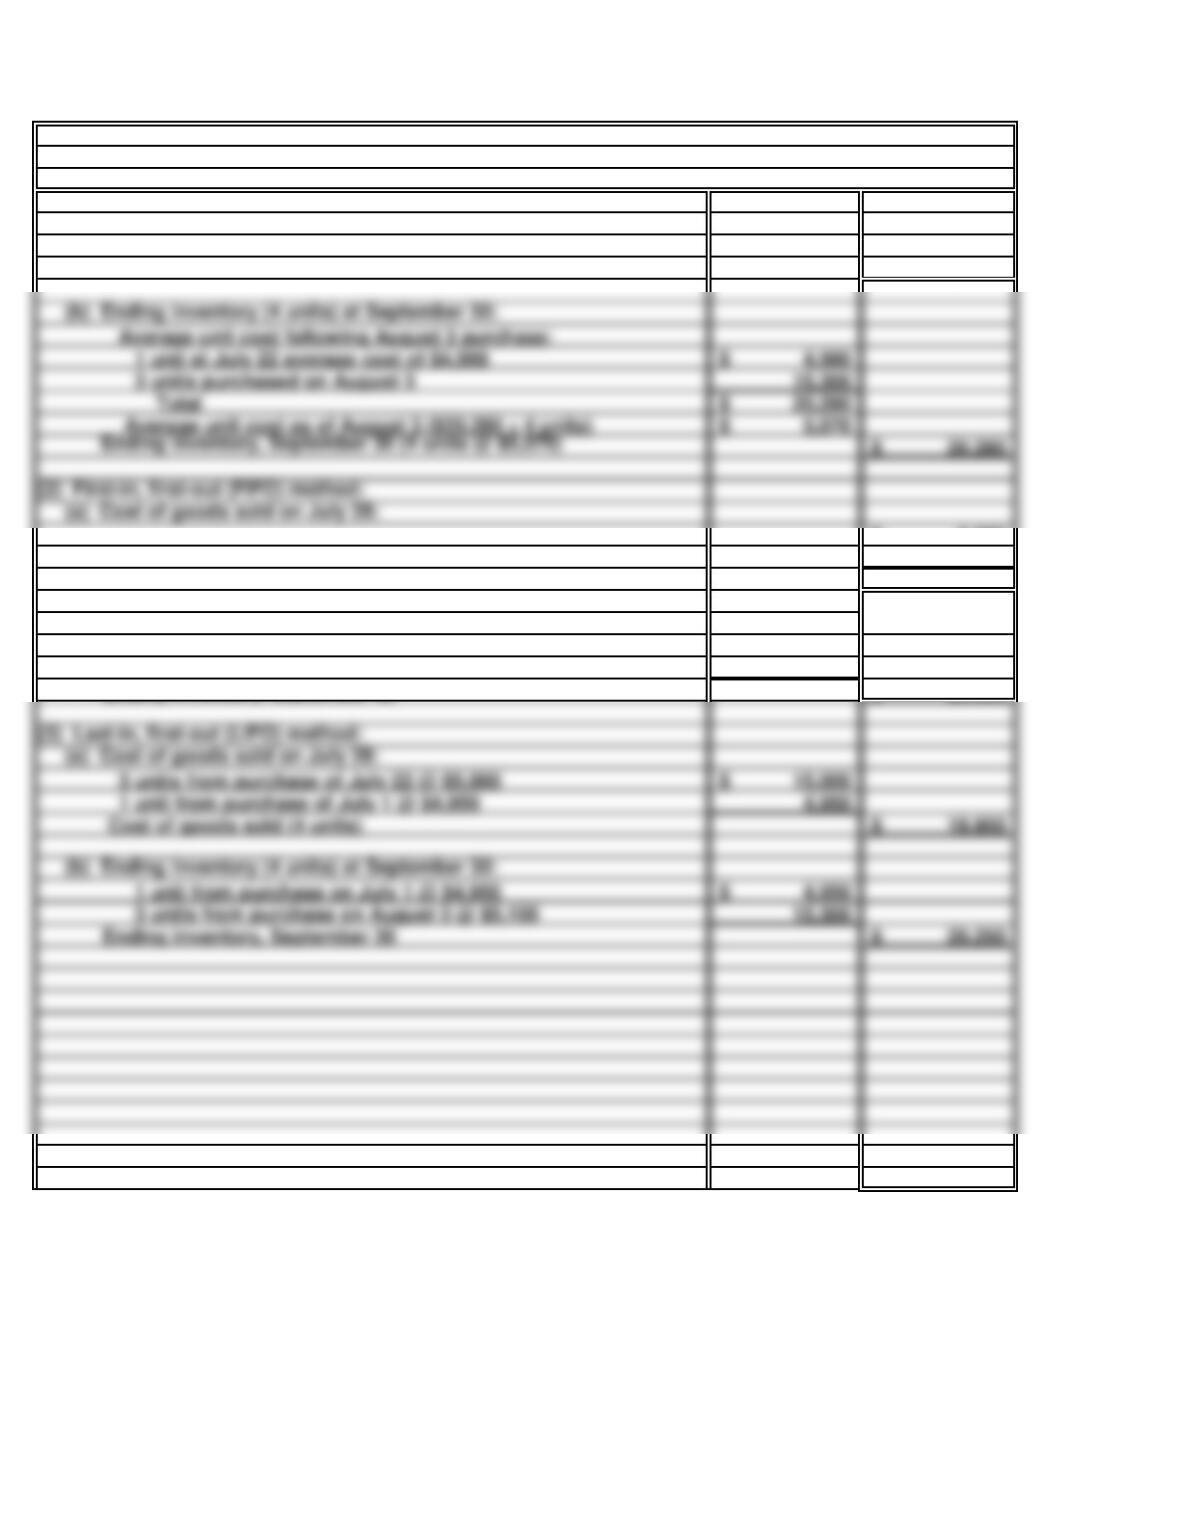
(1) Average-cost method:
(a) Cost of goods sold on July 28:
4,980$
19,920$
9,900$
10,000
19,900$
(b) Ending inventory (4 units) at September 30:
5,000$
15,300
20,300$
(3) Last-in, first-out (LIFO) method:
(a) Cost of goods sold on July 28:
19,950$
(b) Ending inventory (4 units) at September 30:
4,950$
15,300
20,250$
1 unit from purchase on July 1 @ $4,950
Cost of goods sold (4 units)
3 units from purchase of July 22 @ $5,000
1 unit from purchase of July 1 @ $4,950
3 units from purchase on August 3 @ $5,100
Ending inventory, September 30
Cost of goods sold (4 units)
PROBLEM 8.2A
a. Cost of goods sold and ending inventory
SPEED WORLD CYCLES: PERPETUAL SYSTEM
Average cost (as of July 22; $24,900 ÷ 5 units)
Cost of goods sold (4 units @ $4,980)
2 units from July 22 purchase @ $5,000
1 unit from July 22 purchase @$5,000
Ending inventory, September 30
3 units from August 3 purchase @ $5,100
(b) Ending inventory (4 units) at September 30:
4,980$
15,300
5,070$
(2) First-in, first-out (FIFO) method:
(a) Cost of goods sold on July 28:
Average unit cost as of August 3 ($20,280 ÷ 4 units)
3 units purchased on August 3
Total
Average unit cost following August 3 purchase:
1 unit at July 22 average cost of $4,980
b. (1)
(2)
(3)
In this situation, the LIFO method will minimize income taxes, as it assigns the most recent
No. Speed World may not use FIFO in its financial statements and LIFO in its income tax
PROBLEM 8.2A
SPEED WORLD CYCLES: PERPETUAL SYSTEM (concluded)
The FIFO method will result in the highest net income, as it assigns the oldest (lowest) costs to
20 Minutes, Medium
(1) Average-cost method:
Ending inventory at September 30:
5,025$
20,100$
(3) Last-in, first-out (LIFO) method:
Ending inventory at September 30:
9,900$
10,000
19,900$
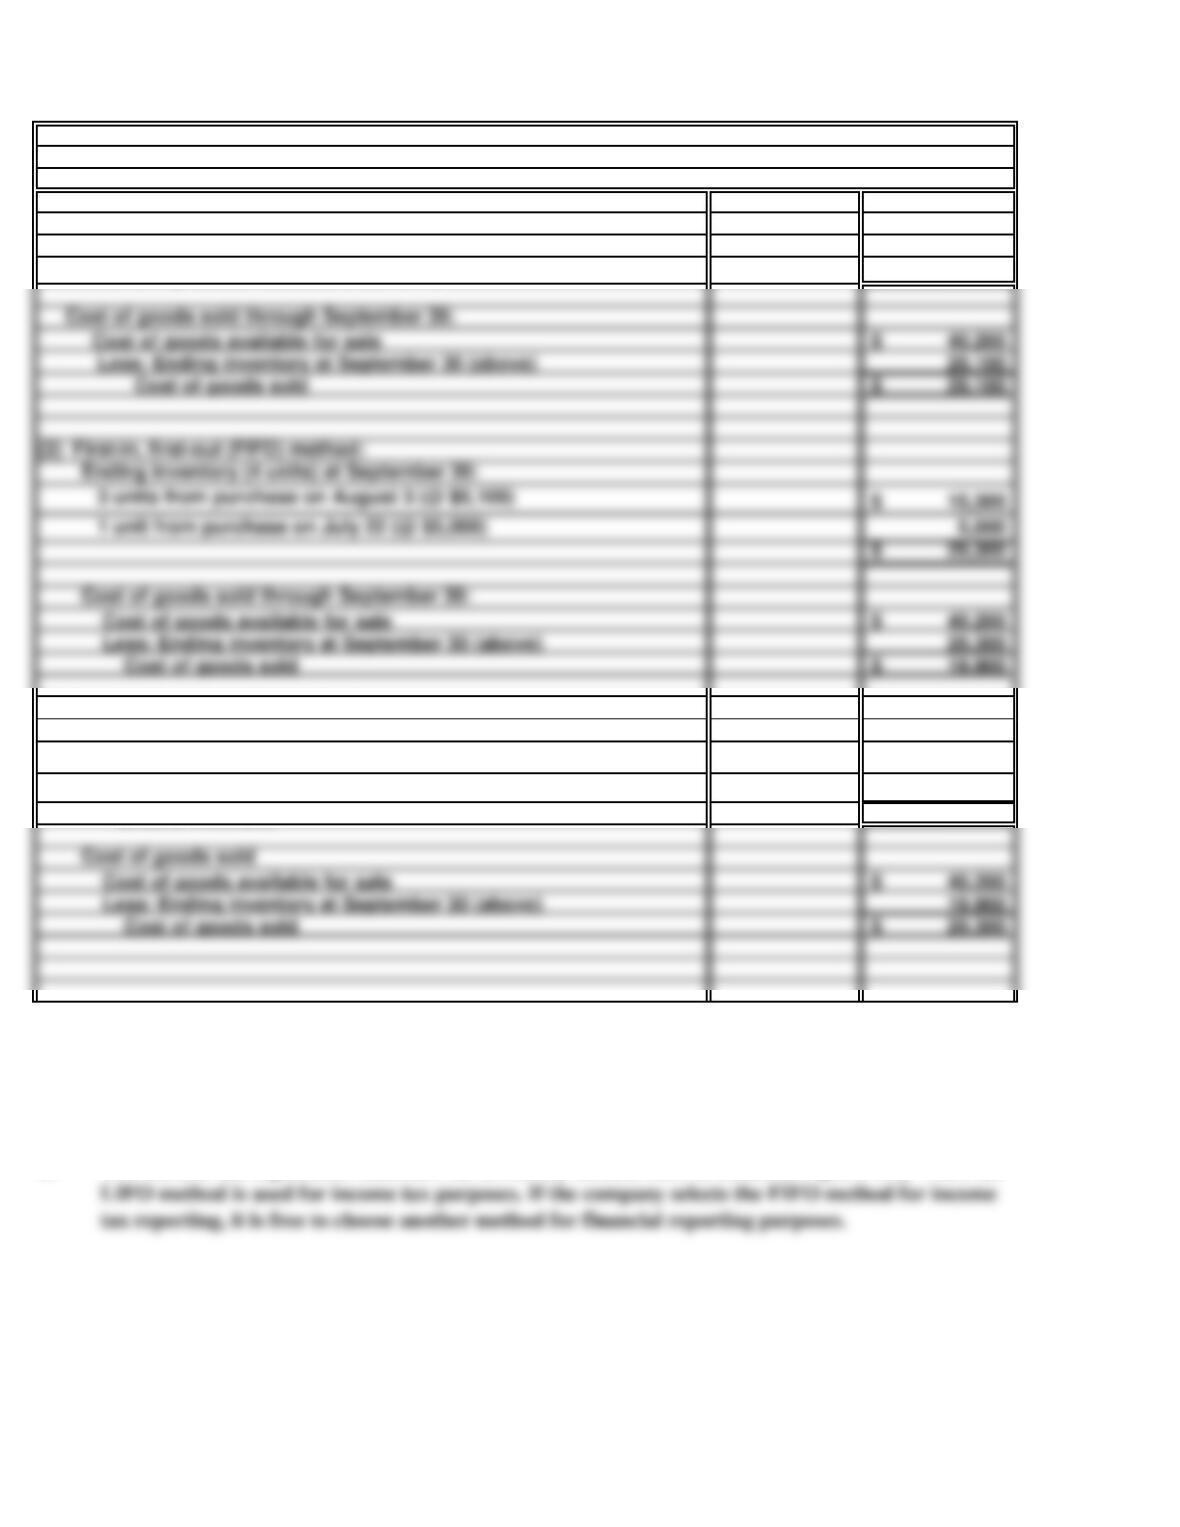
Cost of goods sold
Cost of goods available for sale
Less: Ending inventory at September 30 (above)
Cost of goods sold
b.
Yes. Income tax regulations influence the inventory method used in financial reports only when the
2 units from purchase on July 22 (@ $5,000)
Ending inventory
Note to instructor: Students may point out that ending inventory computed under LIFO is the same figure
as the cost of goods sold computed under FIFO. Likewise, the cost of goods sold figure computed under
LIFO is the same as the ending inventory figure computed under FIFO. The fact that these numbers are
the same is merely a coincidence.
PROBLEM 8.3A
a. Cost of goods sold and ending inventory
SPEED WORLD CYCLES: PERIODIC SYSTEM
Average cost ($40,200 ÷ 8 units)
Ending inventory (4 units @ $5,025)
2 units from purchase on July 1 (@ $4,950)
Cost of goods sold through September 30:
(2) First-in, first-out (FIFO) method:
Ending inventory (4 units) at September 30:
20,300$
Cost of goods sold through September 30:
Cost of goods available for sale
Less: Ending inventory at September 30 (above)
Cost of goods available for sale
Less: Ending inventory at September 30 (above)
Cost of goods sold
Cost of goods sold
20 Minutes, Medium
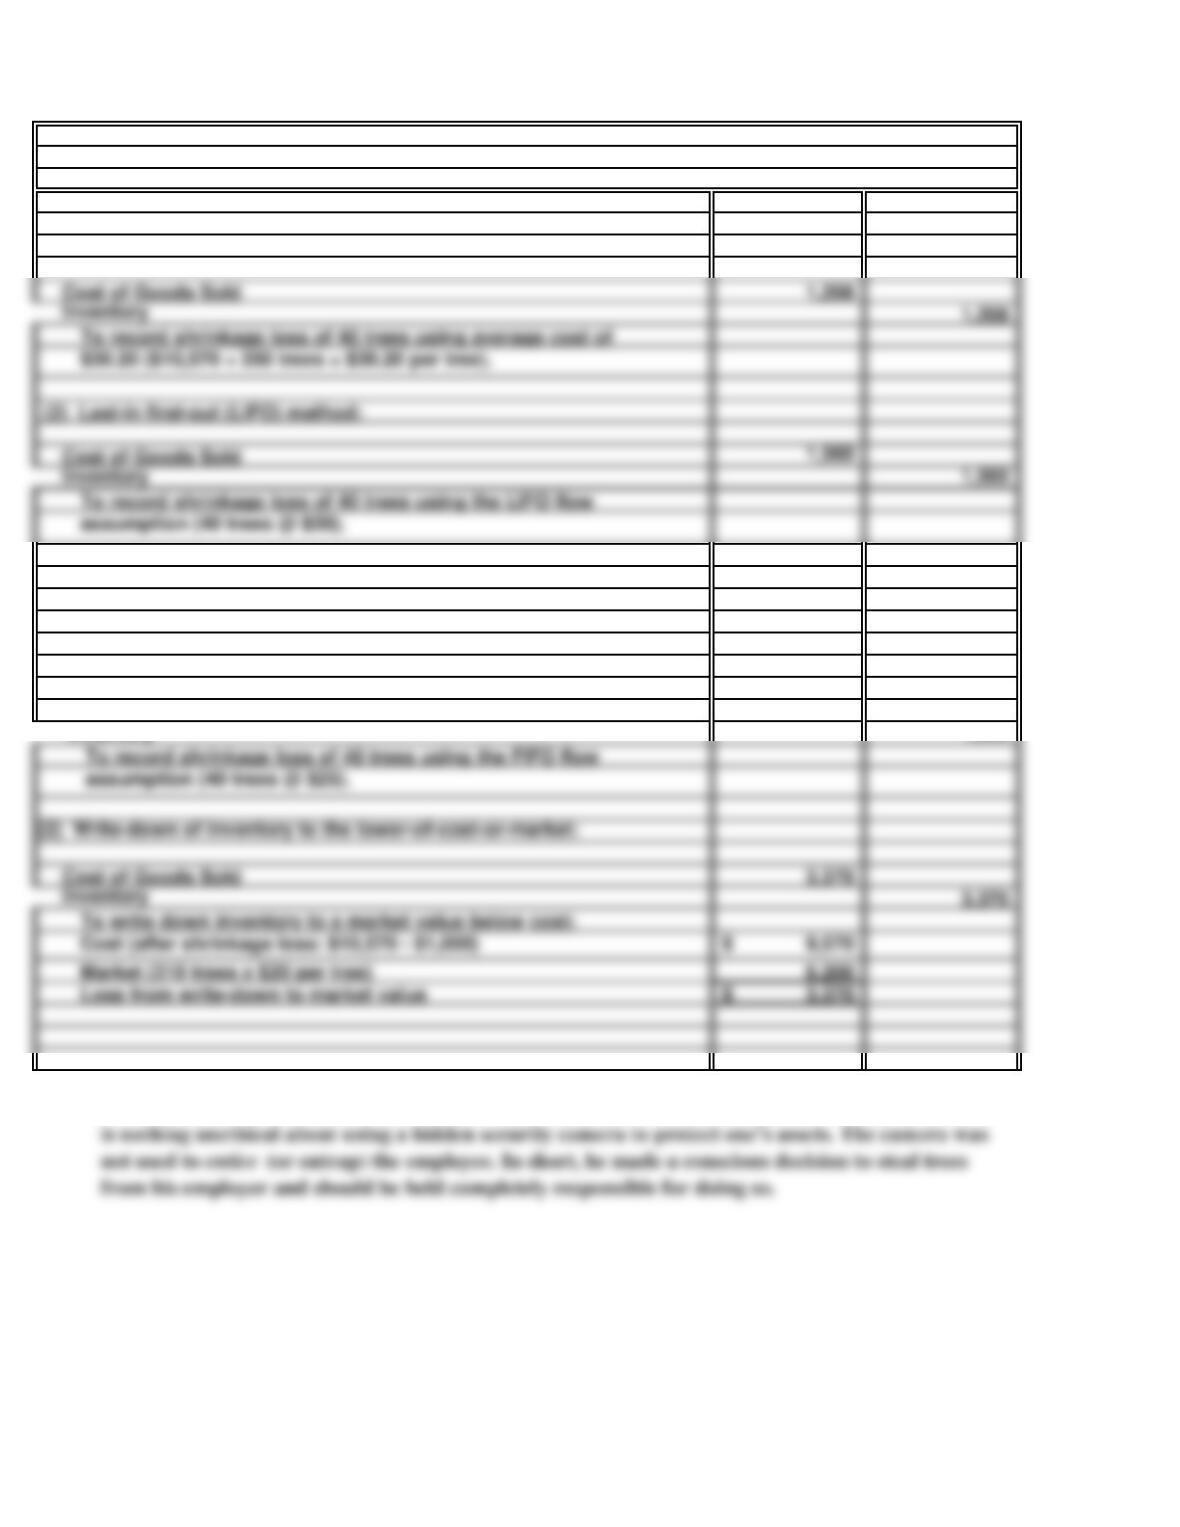
a. Shrinkage loss – 40 trees
1,000
Inventory 1,000
Inventory 3,370
(2) Write-down of inventory to the lower-of-cost-or-market:
Cost of Goods Sold
c.
(1) Average-cost method:
PROBLEM 8.4A
MARY’S NURSERY
b. Shrinkage loss and LCM adjustment
(1) Shrinkage loss, first-in, first-out (FIFO) method:
Cost of Goods Sold
The only unethical act in this situation was committed by the employee against his employer. There
Inventory 1,208
1,560
(2) Last-in first-out (LIFO) method:
Cost of Goods Sold
Cost of Goods Sold
25 Minutes, Easy
Units Unit Cost Total Cost
a. Inventory and cost of goods sold:
(1) FIFO:
(2) LIFO:
Beginning inventory 12 299$ 3,588$
First purchase (May 12) 10 306 3,060
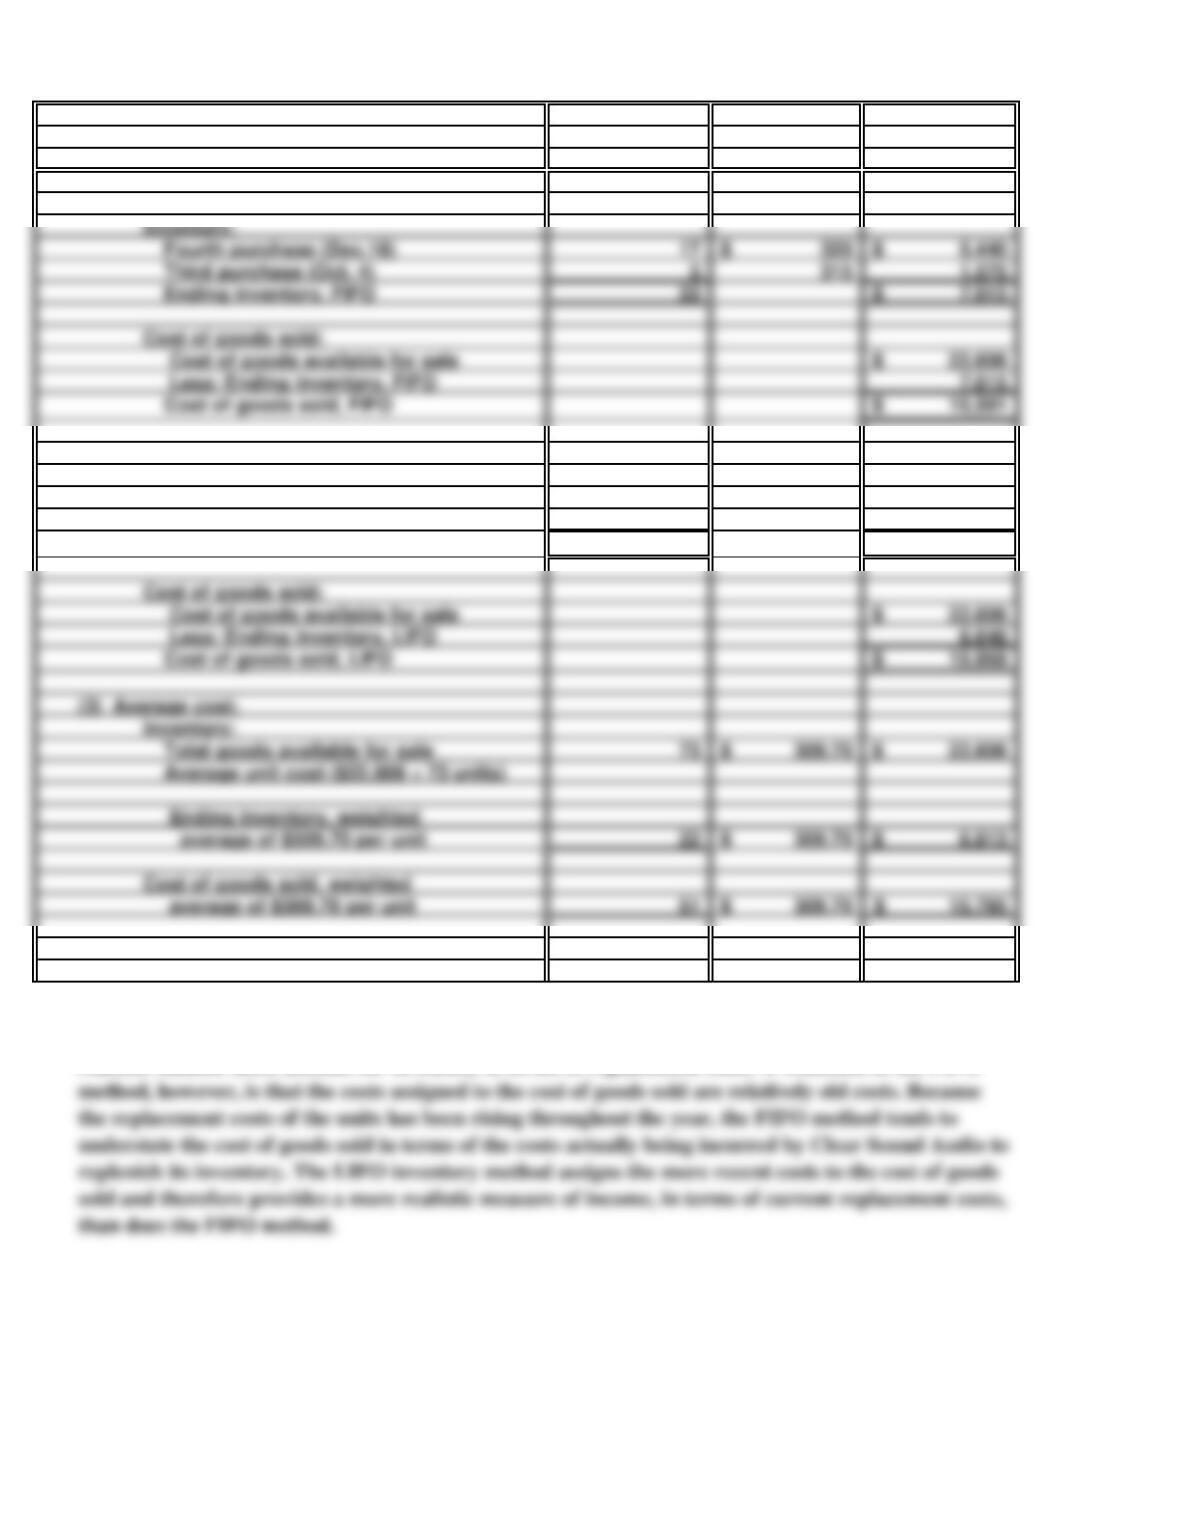
Ending inventory, LIFO 22 6,648$
Cost of goods available for sale 22,606$
Less: Ending inventory, LIFO 6,648
(3) Average cost:
Average unit cost ($22,606 ÷ 73 units)
Ending inventory, weighted
average of $309.70 per unit 22 309.70$ 6,813$
b.
PROBLEM 8.5A
CLEAR SOUND AUDIO
Inventory:
The FIFO method, by assigning the costs of the most recent purchases to inventory, provides the most
realistic balance sheet amount for inventory in terms of replacement costs. A weakness in the FIFO
Fourth purchase (Dec.18) 17 320$ 5,440$
Third purchase (Oct. 4) 5 315 1,575
Ending inventory, FIFO 22 7,015$
Cost of goods available for sale 22,606$
Less: Ending inventory, FIFO 7,015
20 Minutes, Medium
a.
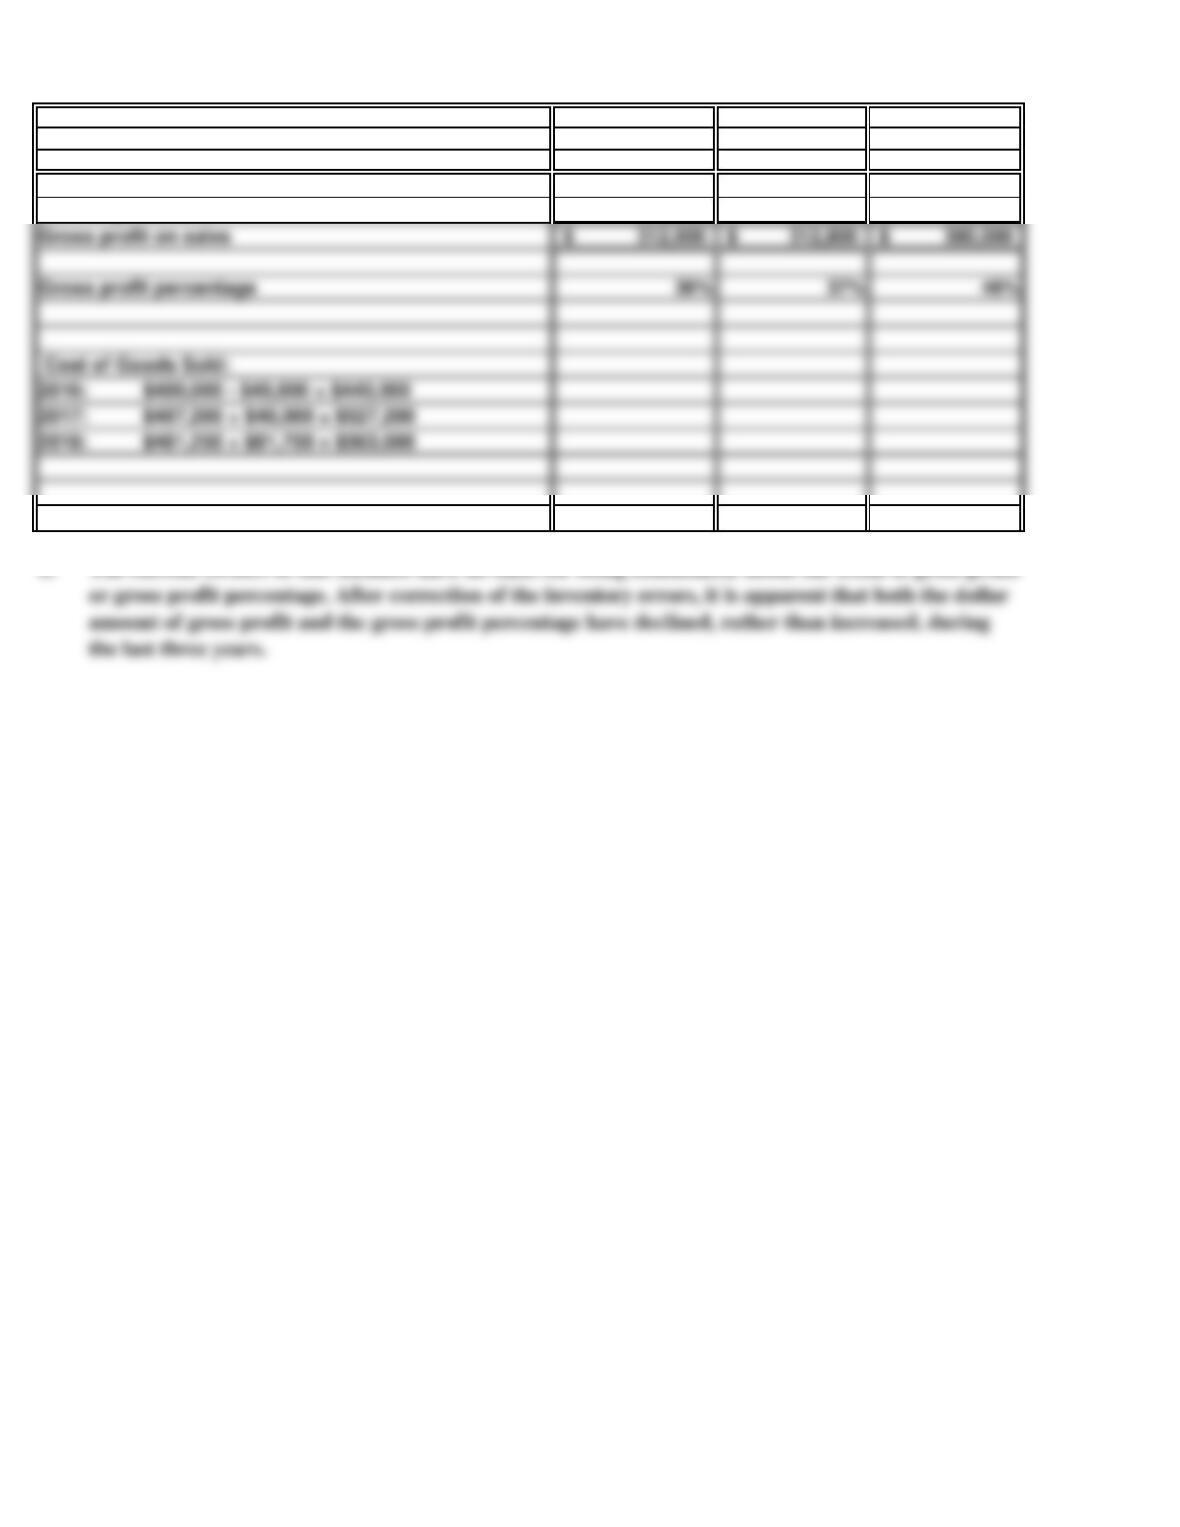
2018 2017 2016
Net sales 875,000$ 840,000$ 820,000$
Cost of goods sold 563,000 527,200 440,000$
b.
The current owners of this business have no basis for being enthusiastic about the trend of gross profit
PROBLEM 8.6A
HEALTH FOODS
25 Minutes, Medium
a.
b.
84,480$
55%
46,464$
52,800$
6,336$
744,000$
462,000$
46,464 415,536
Gross profit 328,464$
Cost of goods available for sale
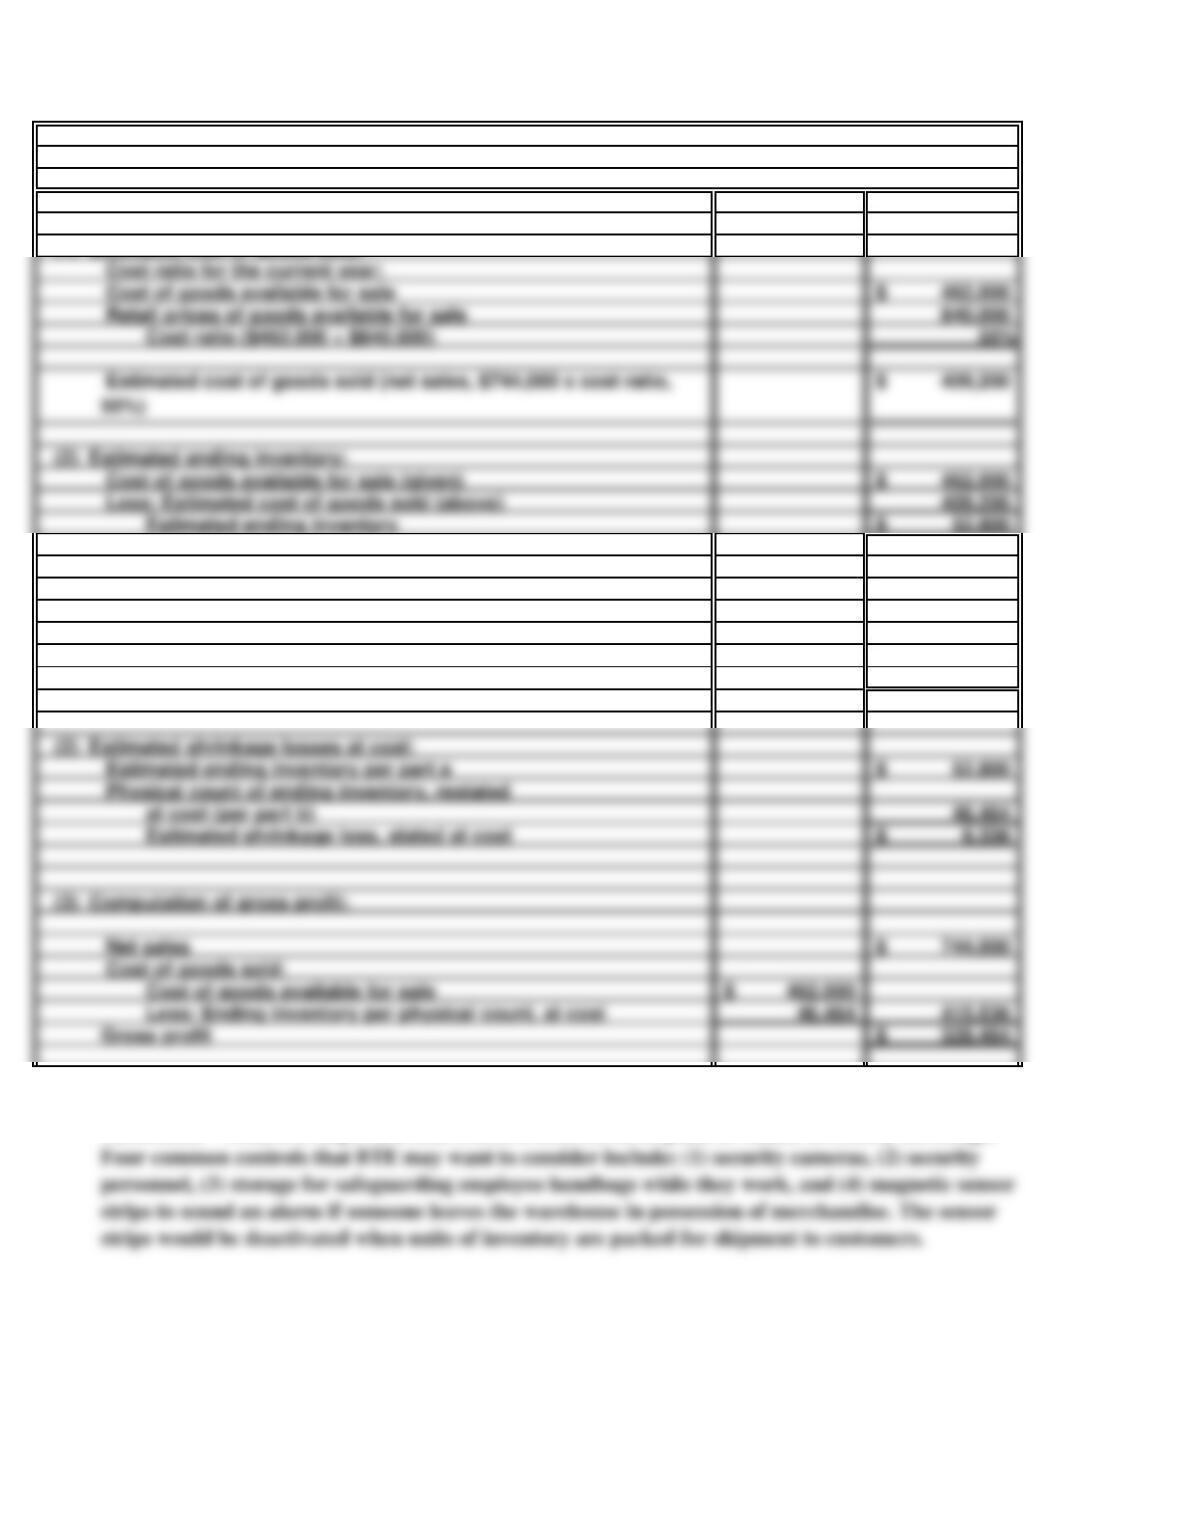
(3) Computation of gross profit:
Estimated shrinkage loss, stated at cost
at cost (per part b)
Net sales
Cost of goods sold:
Less: Ending inventory per physical count, at cost
(2) Estimated shrinkage losses at cost:
Estimated ending inventory per part a
Physical count of ending inventory, restated
c.
CDs and recorded music in other formats can easily fit into someone’s pocket and “walk out of the
warehouse.” Thus, it is important that effective controls be in place to reduce inventory shrinkage.
(1) Restating physical inventory from retail prices to cost:
Physical inventory stated in retail prices
Cost ratio (per part a, above)
Ending inventory at cost ($84,480 x 55%)
(1) Estimated cost of goods sold:
PROBLEM 8.7A
BETWEEN THE EARS
462,000$
840,000
55%
462,000$
409,200
52,800$
Cost ratio for the current year:
Less: Estimated cost of goods sold (above)
Estimated ending inventory
(2) Estimated ending inventory:
Cost of goods available for sale (given)
Cost of goods available for sale
Retail prices of goods available for sale
Cost ratio ($462,000 ÷ $840,000)
20 Minutes, Strong
a. Computations based on LIFO valuation of inventory:
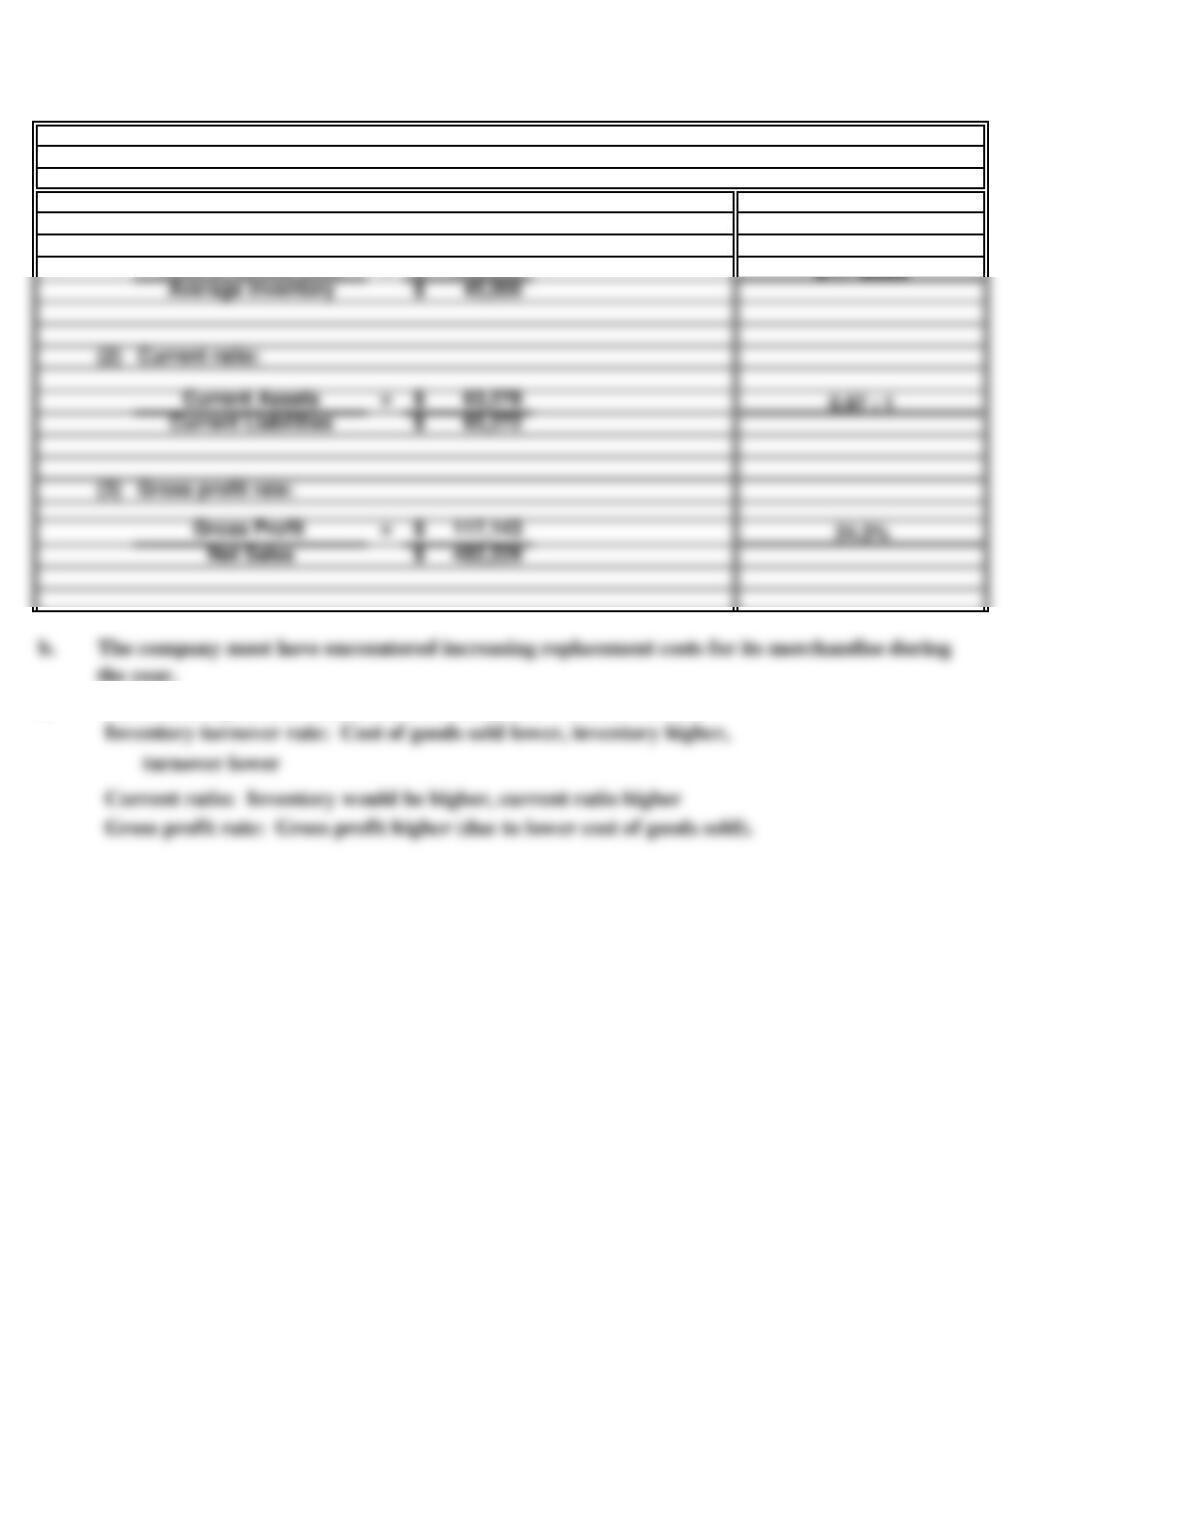
(1) Inventory turnover rate:
Cost of Goods Sold = 365,086$ 8.11 times
c. You would expect the ratios to be different under FIFO as follows:
the year.
PROBLEM 8.8A
WAL-MART
Average inventory 45,000$
(2) Current ratio:
Current Assets = 63,278$ 0.97 : 1
Current Liabilities 65,272$
(3) Gross profit rate:
Net Sales 482,229$
35 Minutes, Medium
Jan 22 14,800
Inventory 14,800
Jan 22 14,600
Inventory 14,600
Jan 22 15,400
Inventory 15,400
(4) Last-in, First-out (LIFO) method:
Cost of Goods Sold
To record cost of 700 cartridges sold to Foster
Office Fitters by the FIFO flow assumption:
Office Fitters by the LIFO flow assumption
SOLUTIONS TO PROBLEMS SET B
PROBLEM 8.1B
DOBBINS SUPPLY, INC.
Cost of Goods Sold
a.
2018
General Journal
(1) Specific identification method:
(3) First-in, First-out (FIFO) method:
Cost of Goods Sold
To record cost of 700 cartridges sold to Foster
Jan 22 15,050
Inventory 15,050
Cost of Goods Sold
Office Fitters by the average-cost method: 700
To record cost of 700 cartridges sold to Foster
To record cost of 700 cartridges sold to Foster
(2) Average-cost method:
b. Inventory subsidiary ledger records:
(1) Specific identification method:
DOBBINS SUPPLY INC. (cont.)
Date Units Unit Cost Total Units Unit Cost
Cost of
Goods Sold
Units Unit Cost Balance
Dec 12 400 20$ 8,000$ 400 20$ 8,000$
400 22 14,800$ 800 22 19,600
(2) Average-cost method:
Date Units Cost Total Units Unit Cost
Cost of
Goods Sold
Units Cost Balance
Dec 12 400 20$ 8,000$ 400 20.00$ 8,000$
Jan 16 1,200 22 26,400 1,600 21.50 34,400
Jan 22 700 21.50$ 15,050$ 900 21.50 19,350
* $34,400 total cost ÷ 1,600 units = $21.50 average unit cost.
(3) First-in, first-out (FIFO) method:
Goods Sold
Dec 12 400 20$ 8,000$ 400 20$ 8,000$
Jan 16 1,200 22 26,400 400 20
1,200 22 34,400
Jan 22 400 20$
300 22 14,600$ 900 22 19,800
(4) Last-in, first-out (LIFO) method:
Cost of
Dec 12 400 20$ 8,000$ 400 20$ 8,000$
Jan 16 1,200 22 26,400 400 20
1,200 22 34,400
Jan 22 700 22$ 15,400$ 400 20
500 22 19,000
PURCHASED
SOLD
BALANCE
Cost of
PROBLEM 8.1B
PURCHASED
SOLD
BALANCE
PURCHASED
SOLD
BALANCE
PURCHASED
SOLD
BALANCE
Jan 16 1,200 22 26,400 400 20
1,200 22 34,400
Jan 22 300 20$ 100 20

c.
PROBLEM 8.1B
DOBBINS SUPPLY, INC. (concluded)
Yes. As shown in part a, the LIFO method resulted in the highest cost of goods sold figure, whereas