146
HYPOTHESIS TESTING:
TWO SAMPLE
INFERENCE
8.2 Test the hypothesis versus . We have the test statistic
8.4 First compute the pooled variance estimate:
Compute the test statistic
8.5 The p-value is given by
2uPr(t
63
1.314) 2uP(t
63
!1.314).
If there were 60 df, then since
714 975
338 0296
,,. ..
H01
2
2
2
:
VV
H11
2
2
2
:
VV
z
CHAPTER 8/HYPOTHESIS TESTING: TWO SAMPLE INFERENCE 147
8.6 The 95% confidence interval is given by
x
1
x
2
rt
63, .975
s
2
1
n
1
n
§
©
¨
¨
·
¹
¸
¸
. We use R to estimate as follows:
8.7 We assume that the true mean difference = observed mean difference We have the
sample-size formula
8.8 Use the sample-size formula
V
1
2
V
2
2
z1
D
z1
E
2
8.9 Use the following sample-size formula for the sample size for the below-poverty-level group (group 1)
t
63 975,.
()‘ 680 656 024.. ..
148 CHAPTER 8/HYPOTHESIS TESTING: TWO SAMPLE INFERENCE
8.10 We use Equation 8.28 (in Chapter 8, text) to compute the power as follows
8.11 If a one-sided test is used, then we use Equation 8.28 (in Chapter 8, text) with replaced by
D
,
whereby
8.12 We use Equation 8.28 (in Chapter 8, text) with parameters ,
21 2
50, 0.64, 0.76n
V
V
.
8.13 If a one-sided test is used, the power is given by
8.14 There are 6 persons who received a bacterial culture with mean WBC of 9.50 and standard deviation of
D
/2
‘ 024.n125 ,
CHAPTER 8/HYPOTHESIS TESTING: TWO SAMPLE INFERENCE 149
8.19 We wish to test the hypothesis versus , where change in ocular pressure is
normally distributed with mean and variance . We use the paired ttest to analyze these data with test
statistic
t
t
8.20 We have the test statistic . Since , and
8.21 A 95% CI for the mean change in pressure in the methazolamide and topical drug group is
8.22 We wish to test the hypothesis versus . We will use a two-sample t test to assess
the results. First, an F test for the equality of two variances is performed using the test statistic
H
00:‘
H
10:‘z di
‘
V
d
2
tt
07
21 30
07
0 383 183 29
.
./
.
..~
t
29 95 1699
,. .
t
29 975 2045
,. .
H
01 2
:
P
P
H
11 2
:
P
P
z
t
t
t
150 CHAPTER 8/HYPOTHESIS TESTING: TWO SAMPLE INFERENCE
is .22.
8.23 We first perform an F test for the equality of two variances to determine if the t test for equal or
unequal variances should be used. We test the hypothesis versus . We have
H01
2
2
2
:
VV
H11
2
2
2
:
VV
z
CHAPTER 8/HYPOTHESIS TESTING: TWO SAMPLE INFERENCE 151
8.25 Test the hypothesis versus . Use the F test with test statistic
8.26 Test the hypothesis , versus , . Use the two-sample t test with
unequal variances because was rejected in Problem 8.31.
We have the test statistic
x
x
H
8.27 A 95% CI for the true mean difference in CO is given by
8.28 We wish to test the hypothesis versus
H
11 2
:
P
P
z. Since the samples are not matched, we
8.29 We first perform the F test using the test statistic
H
F
F
H01
2
2
2
:
VV
H11
2
2
2
:
VV
z
H
01 2
:
P
P
VV
1
2
2
2
z
H
11 2
:
P
P
z
VV
1
2
2
2
z
H0
H
01 2
:
P
P
F
F
F
152 CHAPTER 8/HYPOTHESIS TESTING: TWO SAMPLE INFERENCE
We then have the test statistic
8.30 A 99% confidence interval for the mean difference in gray level is given by
8.32 We must use an F test to decide whether to use the t test with equal or unequal variances. We have the
8.33 The test statistic is
The appropriate df is given by
c
d
CHAPTER 8/HYPOTHESIS TESTING: TWO SAMPLE INFERENCE 153
8.35 We refer to the sample size formula in Equation 8.27 (in Chapter 8, text). We have that ,
V
8.36 We use Equation 8.27 (in Chapter 8, text) substituting
D
for and obtain
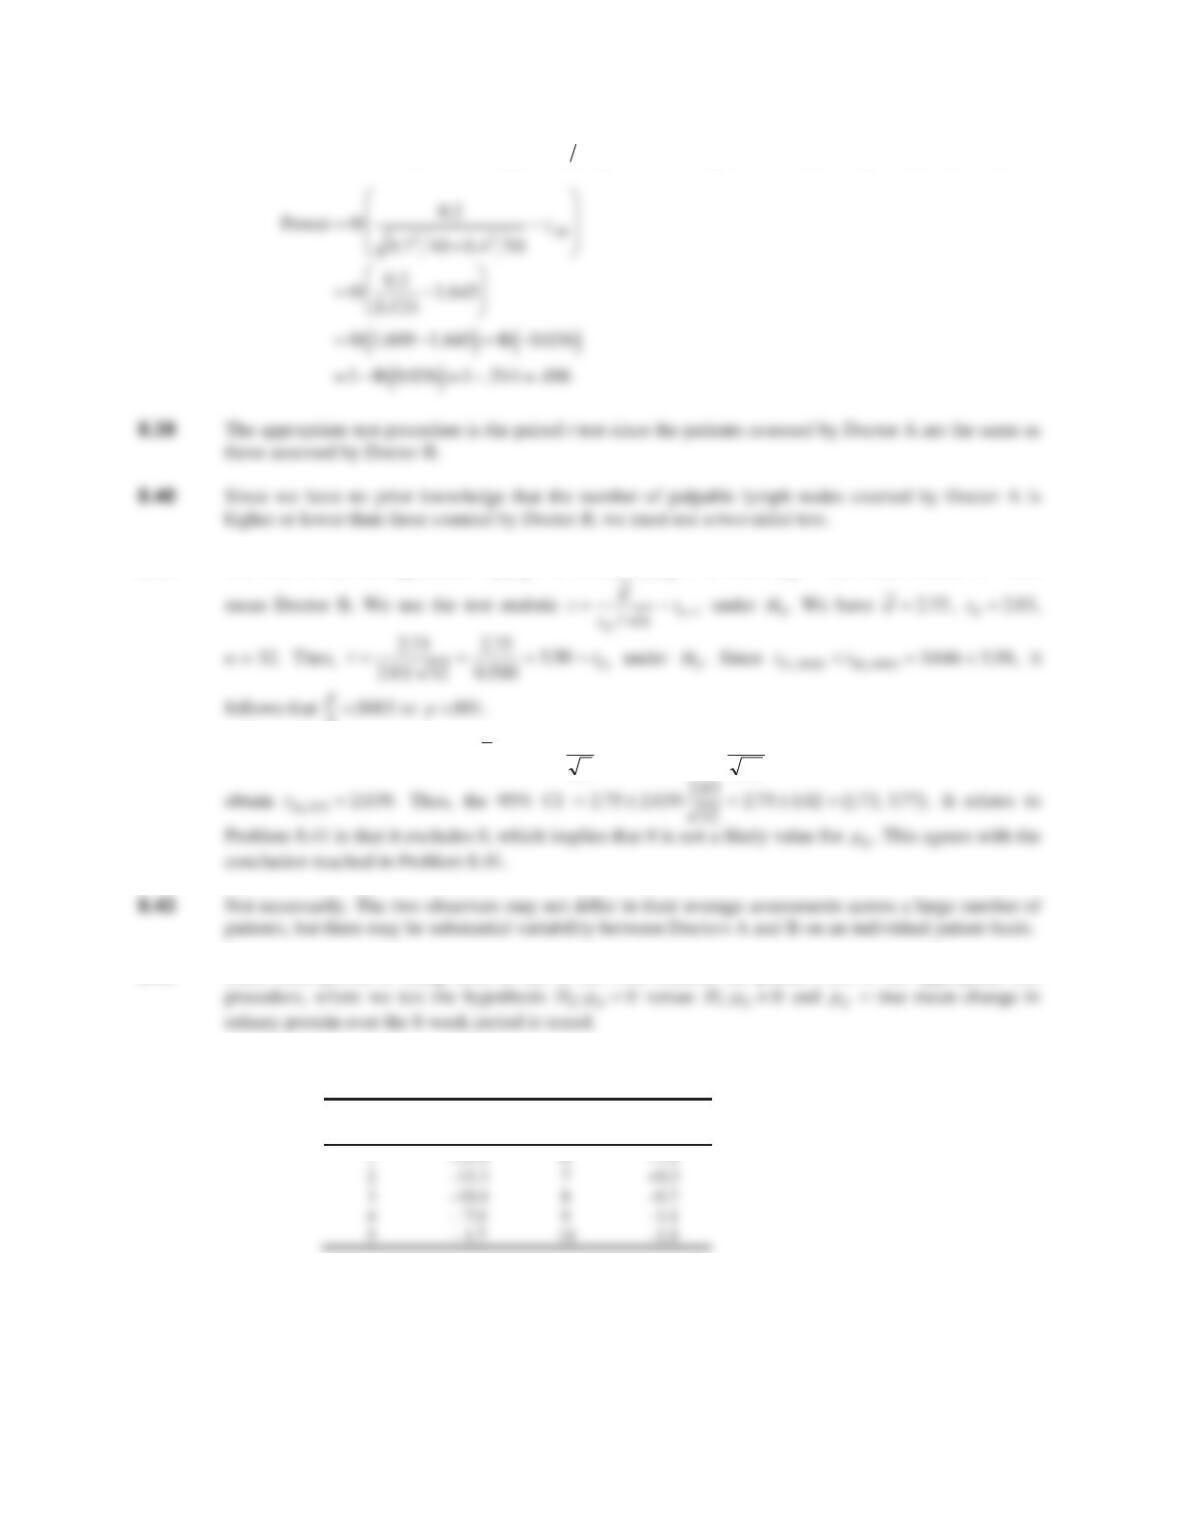
8.37 We use the power formula in Equation 8.28 (in Chapter 8, text) as follows
V
V
V
107 .
D
2
154 CHAPTER 8/HYPOTHESIS TESTING: TWO SAMPLE INFERENCE
8.38 If a one-sided test is used, then we replace by
D
and use Equation 8.28 (in Chapter 8, text). Thus,
8.41 We wish to test the hypothesis
H
d
00:
P
versus , where true mean Doctor A true
H
s
H
t
t
8.42 A 95% CI for is given by dt
s
nt
n
d
r ru
1 975 31 975
275 283
32
,. ,.
... We estimate using R and
t
P
8.44 Since each person is being used as his or her own control, the paired t test is the appropriate test
H
P
H
P
P
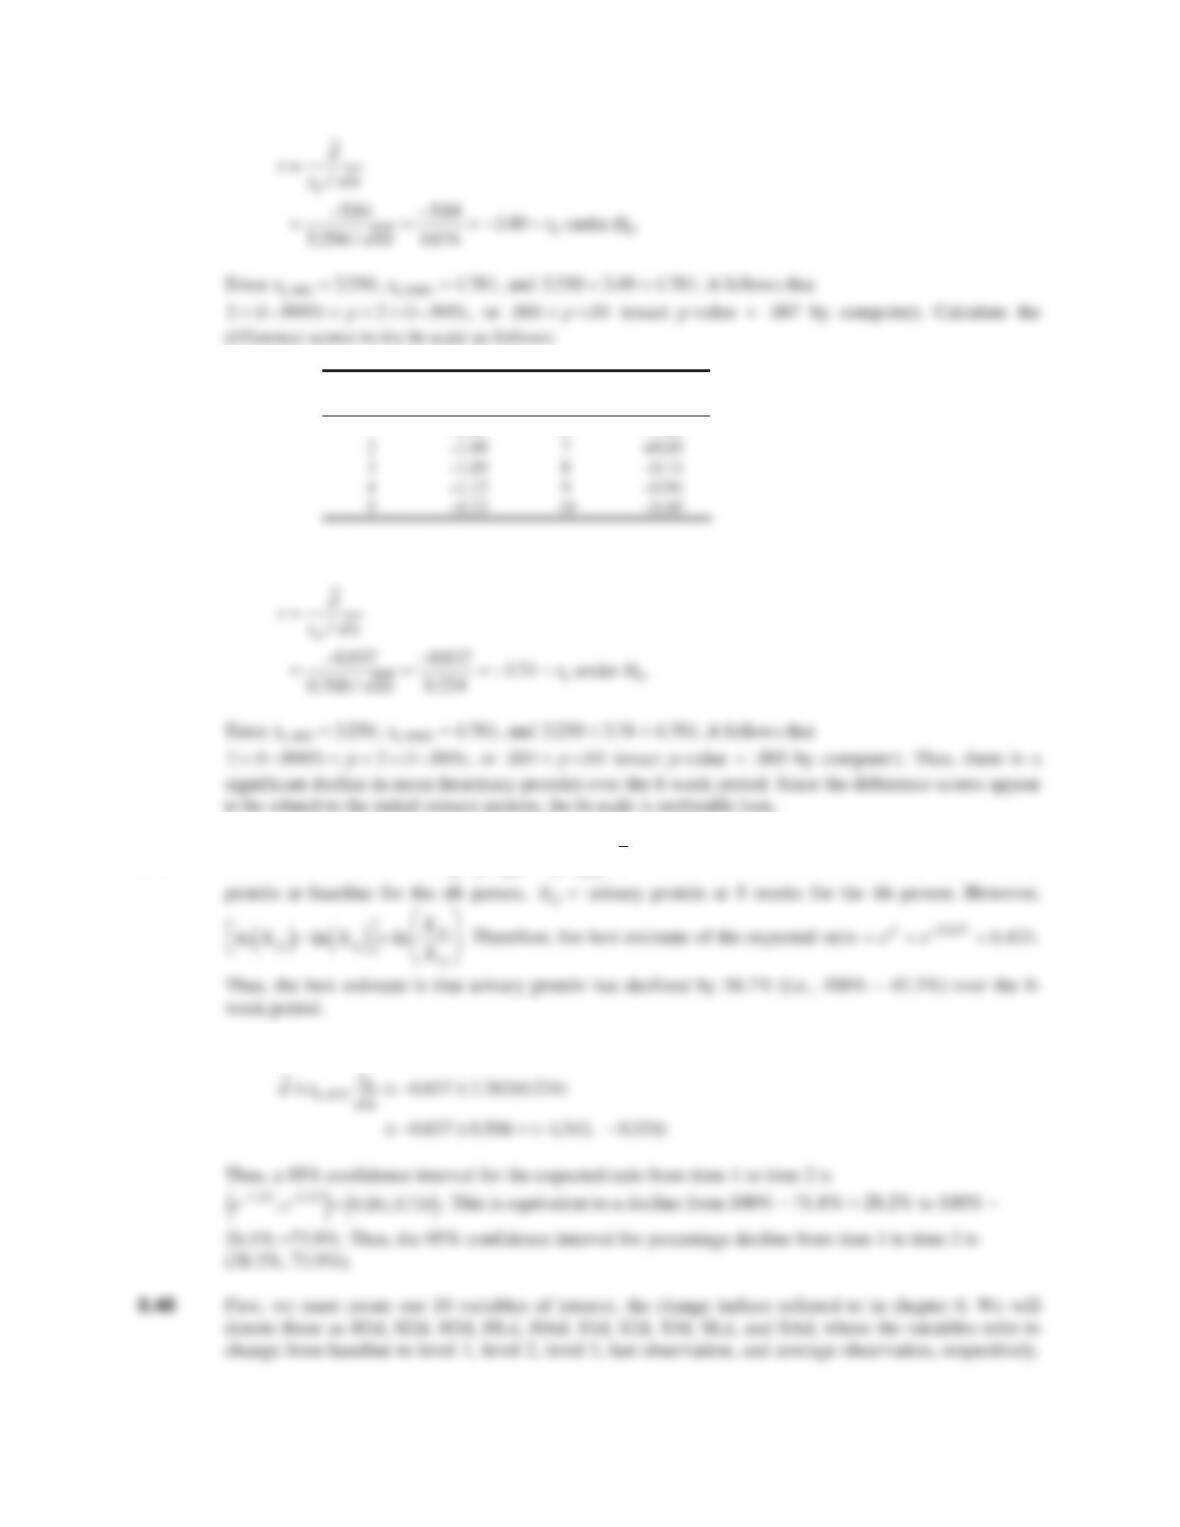
8.45 Calculate the difference scores in the raw scale as follows:
Difference scores in the raw scale
ii
Then compute the test statistic:
D
2
H
d
10:
P
z
P
d
20005.p.001
P
d
t
31 975,.
didi
CHAPTER 8/HYPOTHESIS TESTING: TWO SAMPLE INFERENCE 155
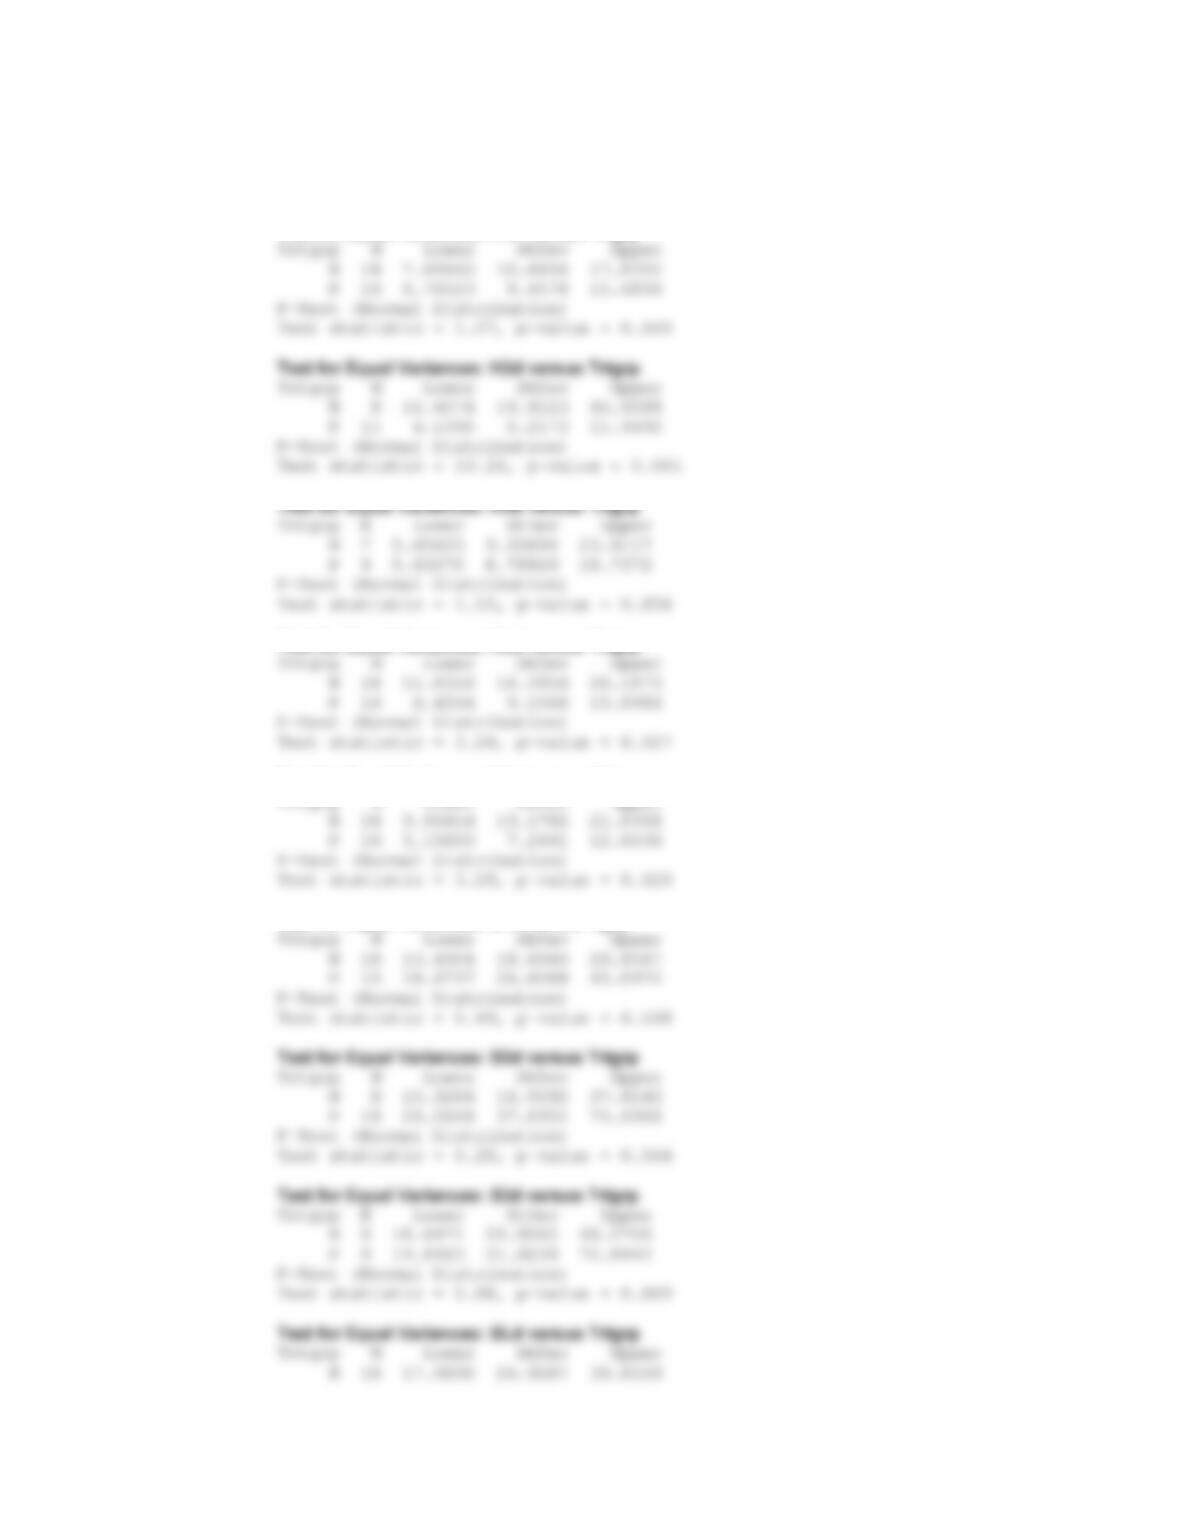
Difference scores in the ln scale
Person(i) Person(i)
1 –0.93 6 –2.43
Then compute the test statistic:
t
t
8.46 The best estimate of mean
ln X
2i
ln X
1i
ª
¼
¼ d 0.837
from Problem 8.55, where urinary
X
8.47 A 95% confidence interval for in the ln scale is given by
s
didi
X
i1
P
d
t
t
156 CHAPTER 8/HYPOTHESIS TESTING: TWO SAMPLE INFERENCE
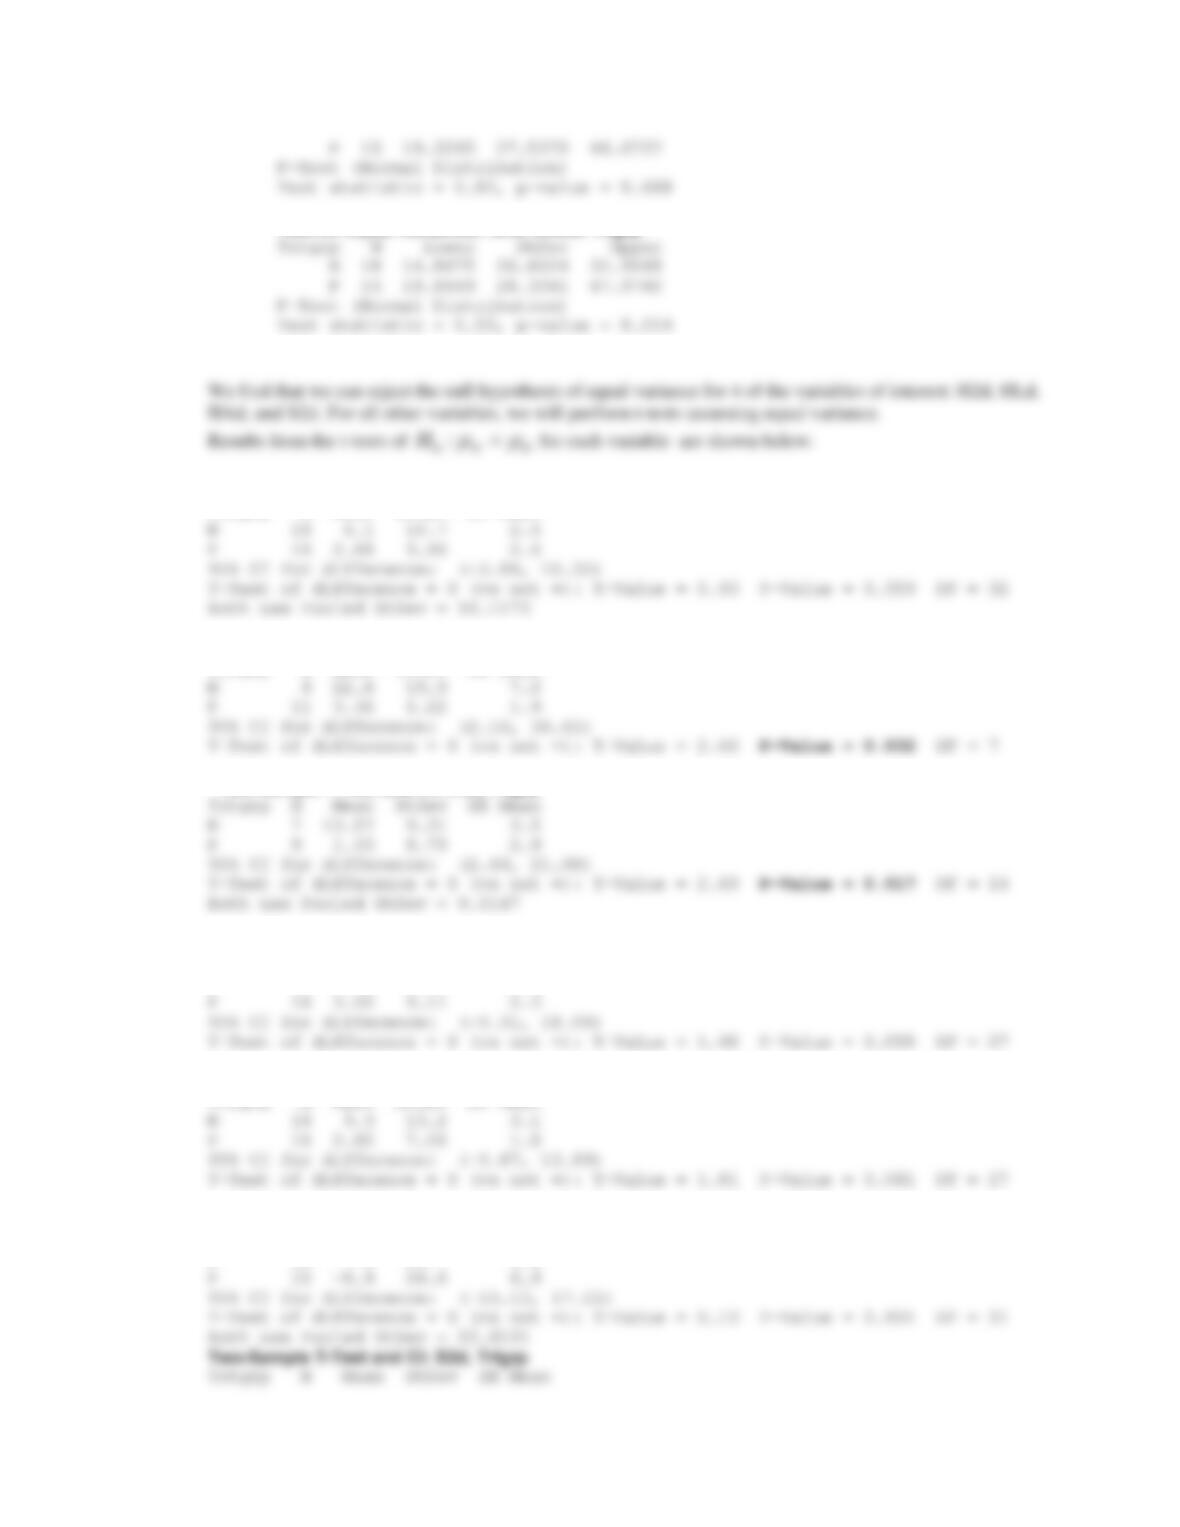
Next, we need to test for equality of variances in order to know which type of t-test to use. MINITAB
will perform these tests for us, and we show the output for each of the F-tests of
H
0
:
V
1
2
V
2
2
Test for Equal Variances: H1d versus Trtgrp
Test for Equal Variances: HLd versus Trtgrp
Test for Equal Variances: HAd versus Trtgrp
Test for Equal Variances: S1d versus rtgrp
CHAPTER 8/HYPOTHESIS TESTING: TWO SAMPLE INFERENCE 157
Test for Equal Variances: SAd versus Trtgrp
Two-Sample T-Test and CI: H1d, Trtgrp
Trtgrp N Mean StDev SE Mean
Two-Sample T-Test and CI: H2d, Trtgrp
Trtgrp N Mean StDev SE Mean
Two-Sample T-Test and CI: H3d, Trtgrp
Two-Sample T-Test and CI: HLd, Trtgrp
Trtgrp N Mean StDev SE Mean
N 18 11.9 16.4 3.9
Two-Sample T-Test and CI: HAd, Trtgrp
Two-Sample T-Test and CI: S1d, Trtgrp
Trtgrp N Mean StDev SE Mean
N 18 -7.9 18.7 4.4
158 CHAPTER 8/HYPOTHESIS TESTING: TWO SAMPLE INFERENCE
Two-Sample T-Test and CI: SLd, Trtgrp
Trtgrp N Mean StDev SE Mean
Two-Sample T-Test and CI: SAd, Trtgrp
8.50 The hypotheses are as stated in Problem 8.63. The test statistic is
CHAPTER 8/HYPOTHESIS TESTING: TWO SAMPLE INFERENCE 159
women do not represent 48 independent observations.
8.53 We wish to test the hypothesis versus , where
P
P
8.54 The test statistic for the unequal variance t test is given by
H
01 2
:
P
P
H
11 2
:
P
P
z
H
t
t
H
160 CHAPTER 8/HYPOTHESIS TESTING: TWO SAMPLE INFERENCE
8.57 We have the test statistic:
8.58 We wish to test the hypothesis:
8.59-8.60 The pooled variance estimate is given by:
CHAPTER 8/HYPOTHESIS TESTING: TWO SAMPLE INFERENCE 161
8.61 We have the power formula:
8.62 We should use a two sample t test with either equal or unequal variances. To assess which specific test to
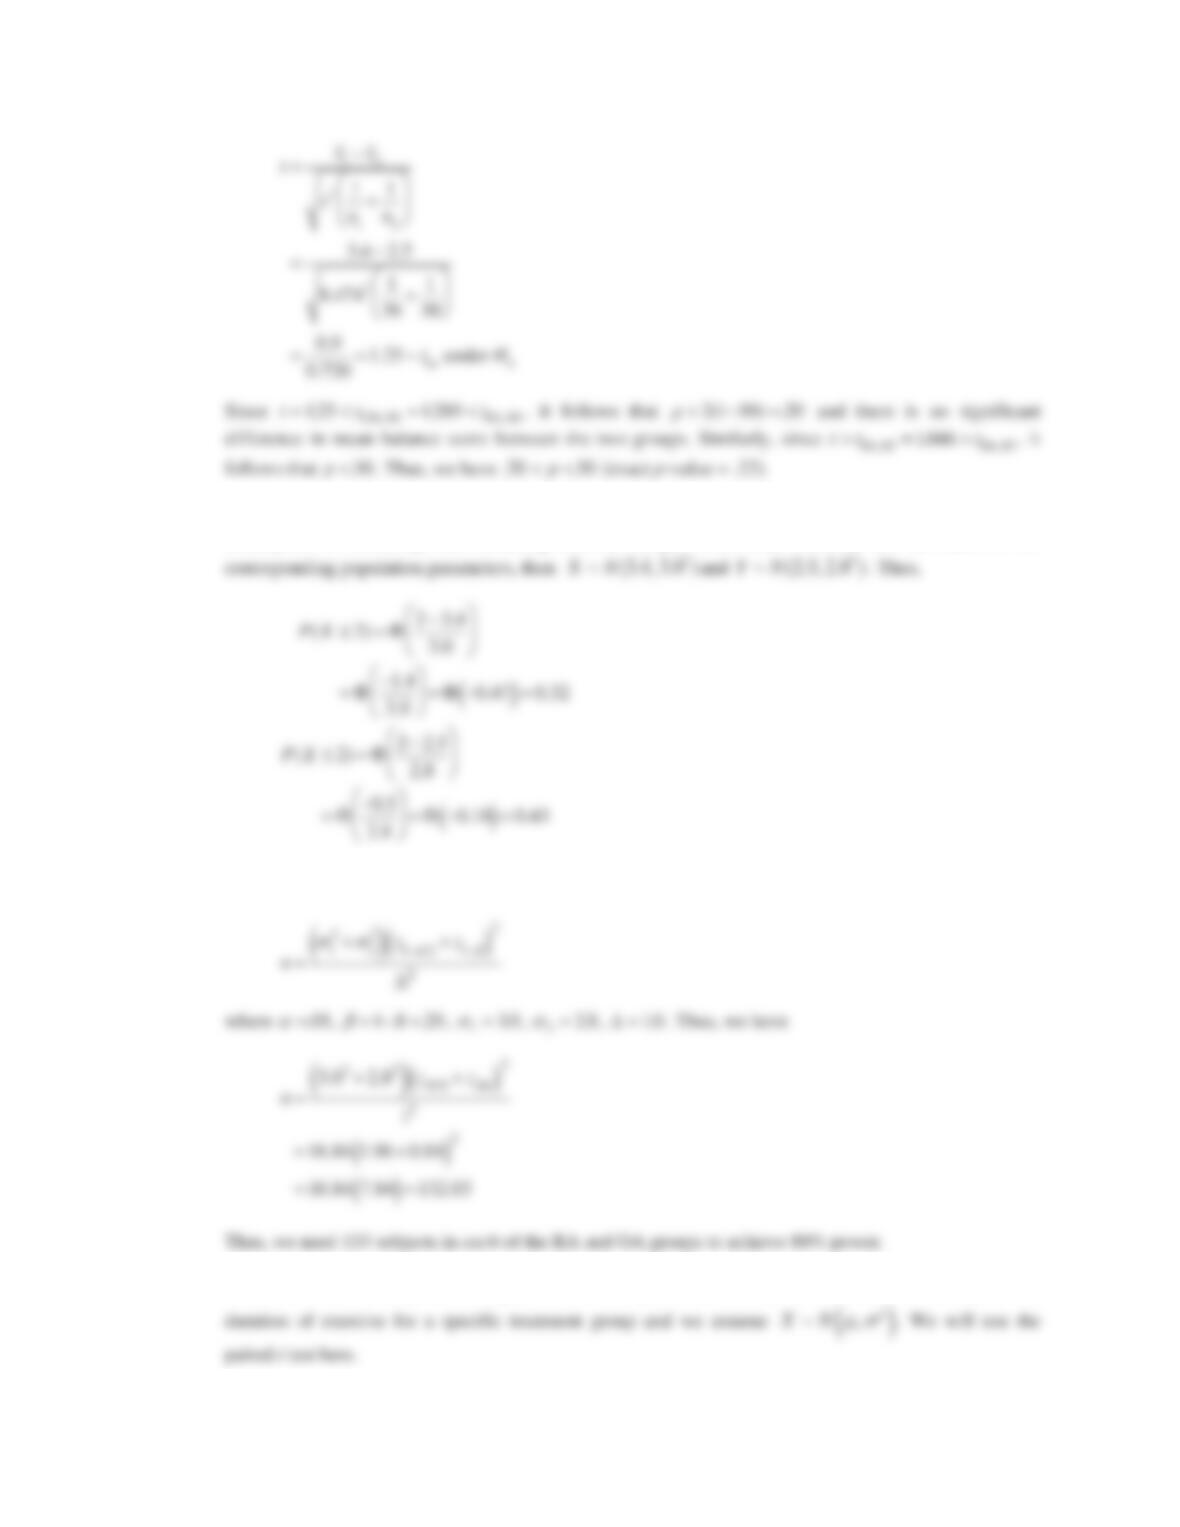
8.63 We wish to test the hypothesis versus . We compute the
pooled variance estimate as follows
H01 2 1
2
2
2
:,
P
P
V
V
H11 2 1
2
2
2
:,
P
P
V
V
z
162 CHAPTER 8/HYPOTHESIS TESTING: TWO SAMPLE INFERENCE
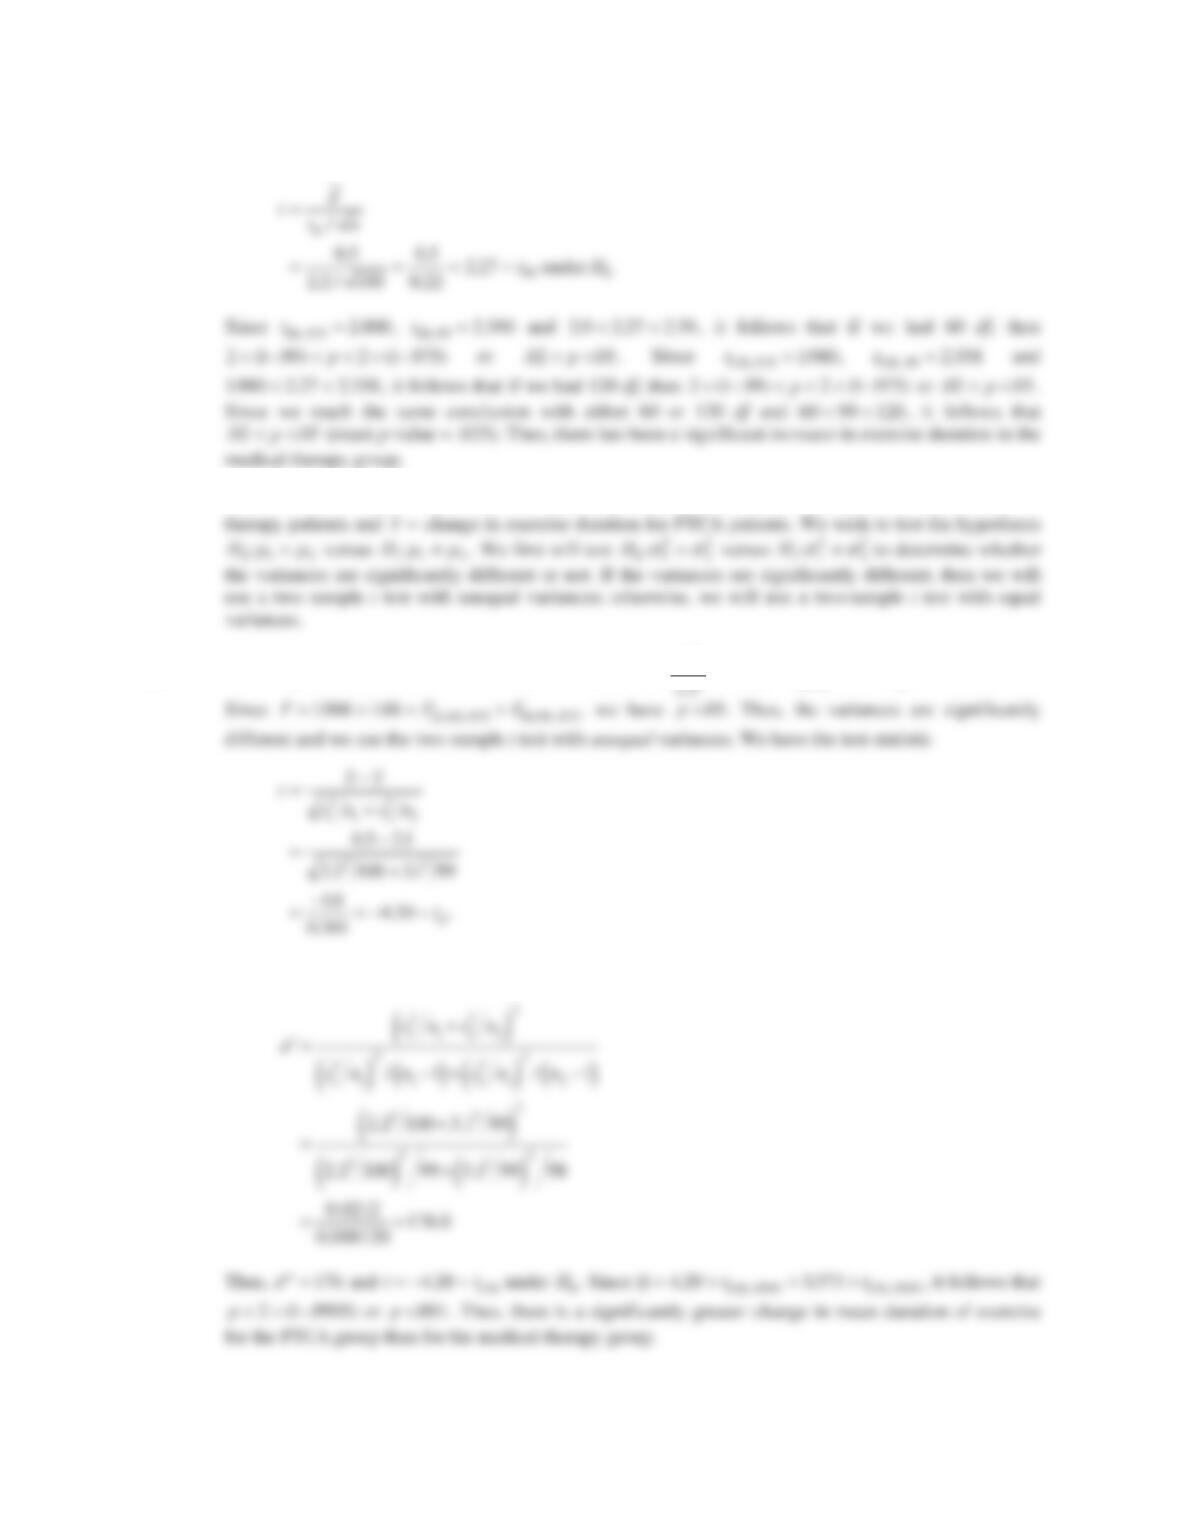
8.64 If X, Y are random variables representing balance scores in the RA and OA group, then under the
assumption of normality, and assuming that the sample means and variances are the same as the
8.65 We use the sample size formula given in Equation 8.27 (in Chapter 8, text),
E
V
V
8.66 We wish to test the hypothesis versus , where is the true mean change in the
H
00:
P
H
10:
P
z
P
t
t
t
t
t
t
CHAPTER 8/HYPOTHESIS TESTING: TWO SAMPLE INFERENCE 163
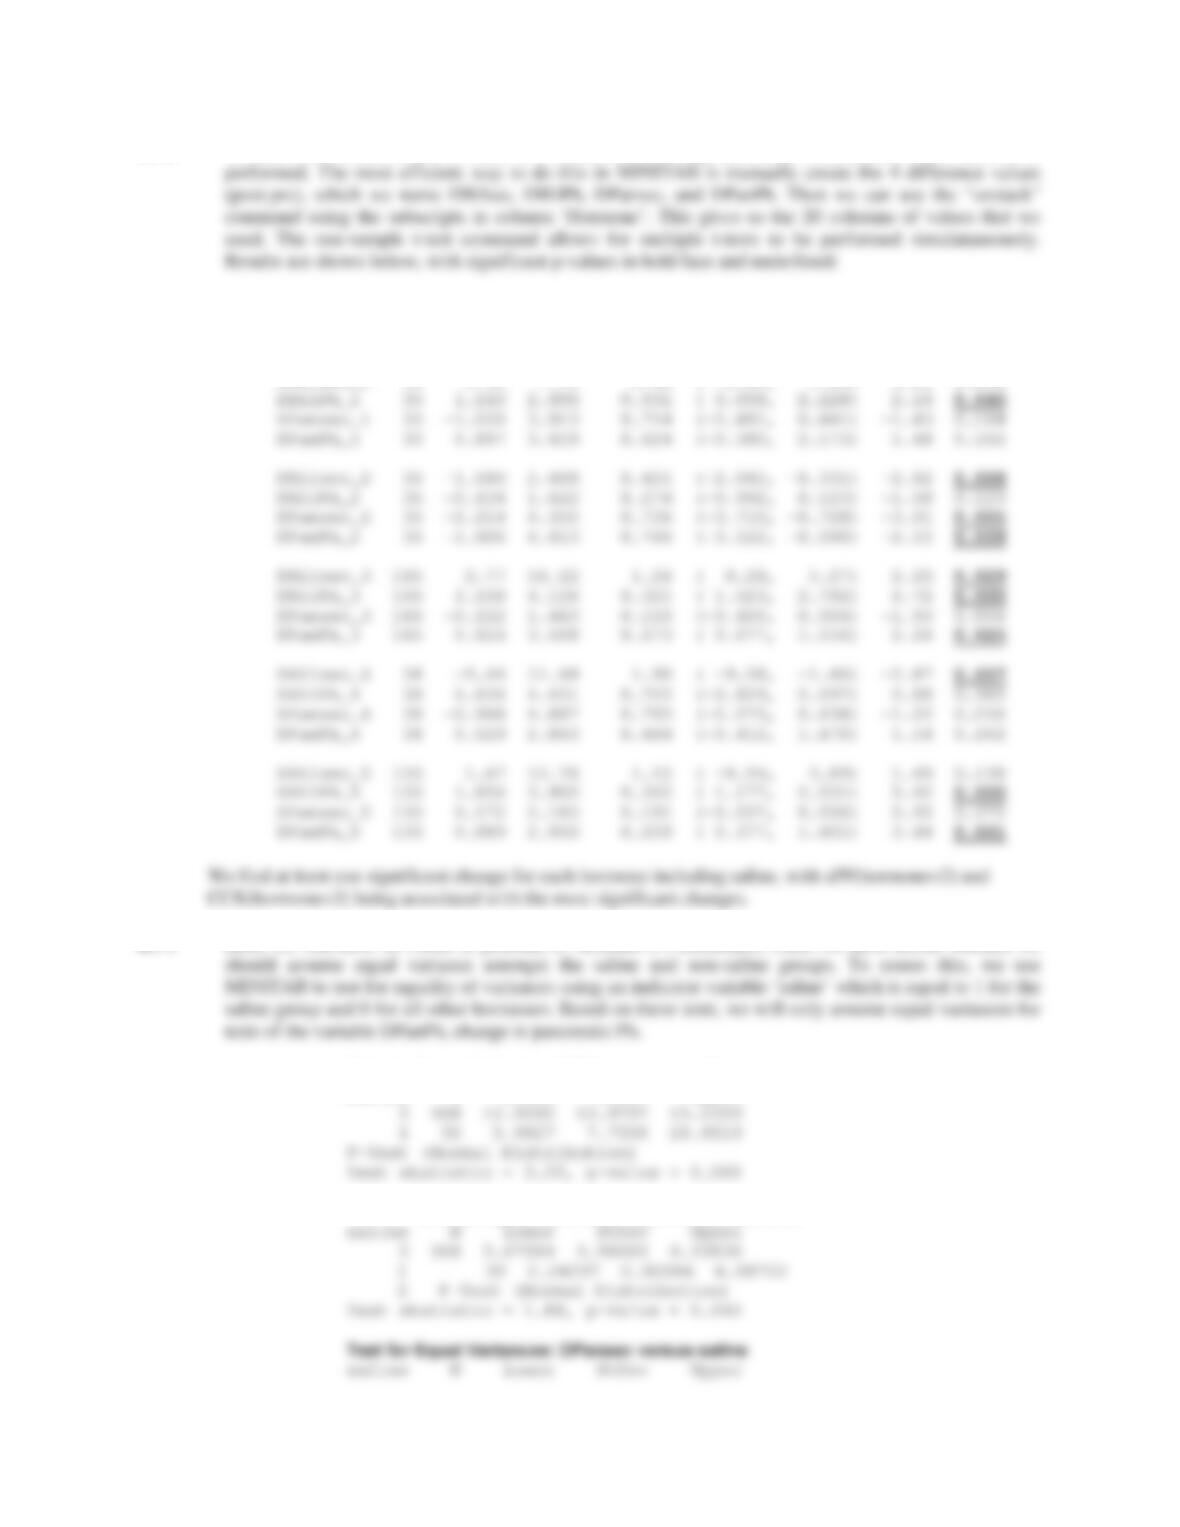
8.67 We have the test statistic
8.68 We assume
X~N
P
1
,
V
1
2
and
Y~N
P
2
,
V
2
2
where change in exercise duration for medical
H
H
8.69 We first perform the F test. We have the test statistic under .
F
F
F
To determine , we use the Satterthwaite approximation.
X
FF
31
2
298 99
.
,
H
0
cc
d
t
t
t
164 CHAPTER 8/HYPOTHESIS TESTING: TWO SAMPLE INFERENCE
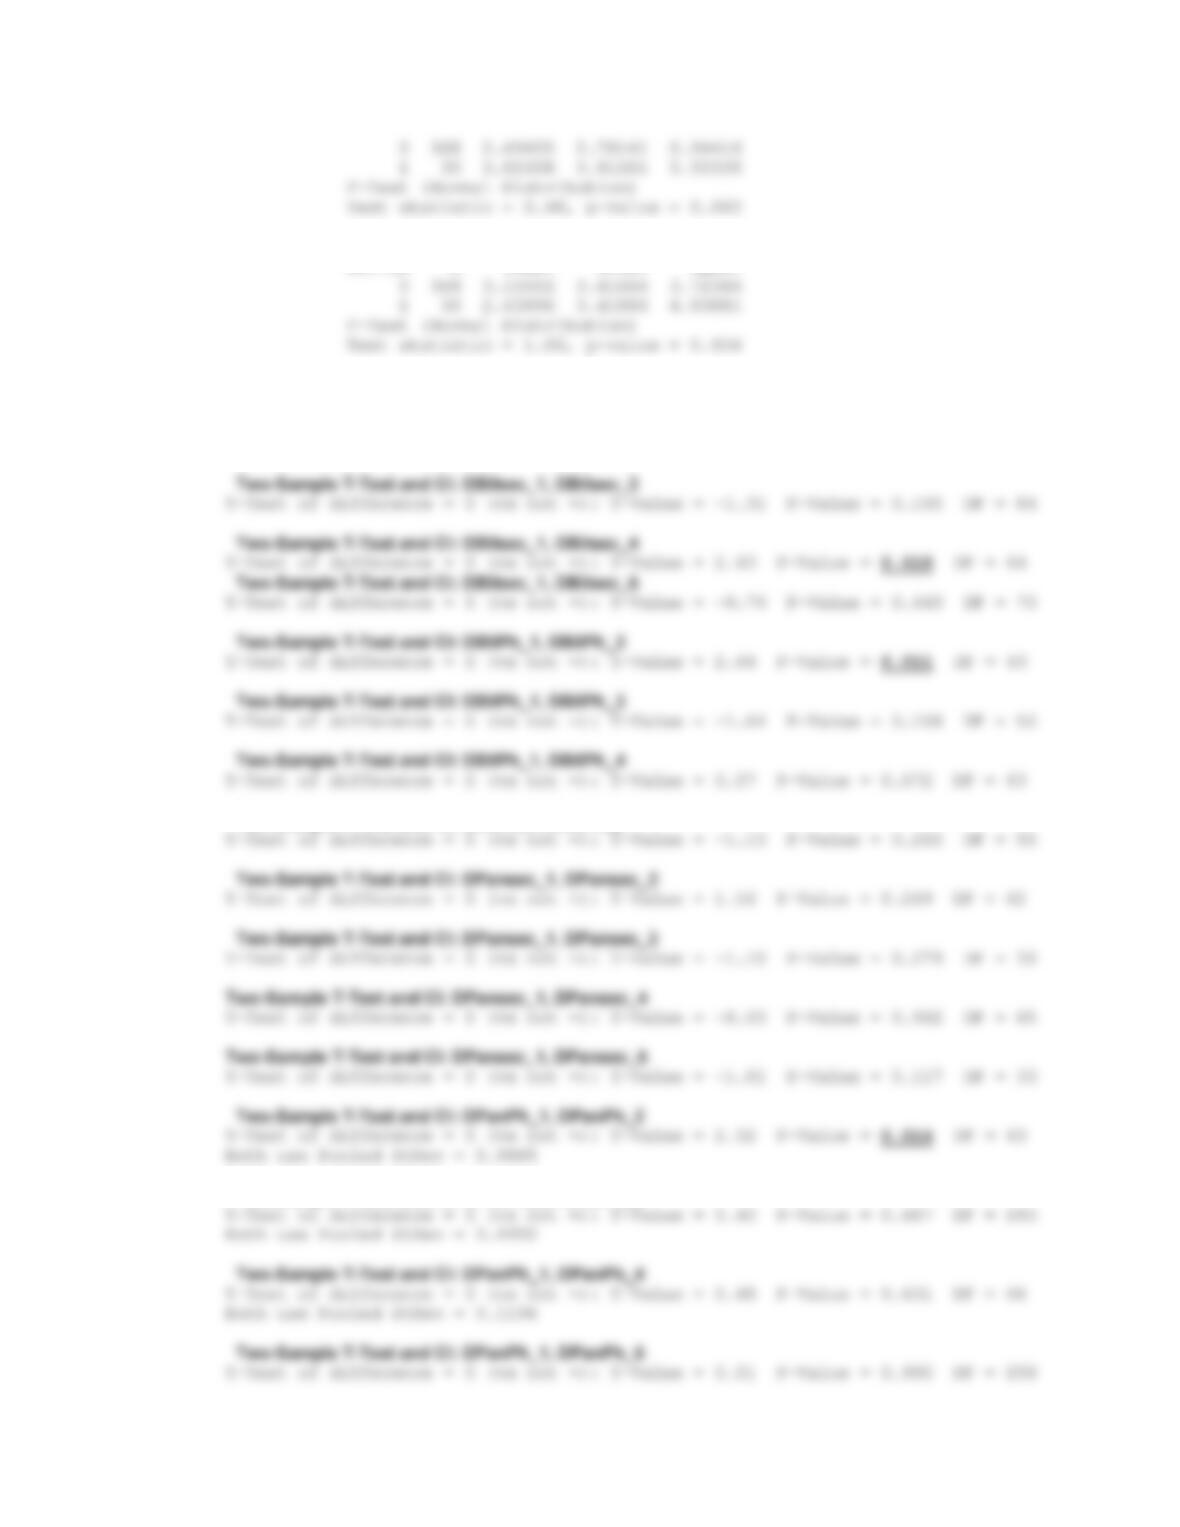
8.70 We have 4 variables to test for each of 5 hormones, meaning that a total of 20 paired t-tests need to be
One-Sample T: DBilsec_1, DBilPh_1, DPansec_1, DPanPh_1, DBilsec_2, …
Test of mu = 0 vs not = 0
Variable N Mean StDev SE Mean 95% CI T P
DBilsec_1 30 0.30 7.75 1.42 ( -2.60, 3.19) 0.21 0.835
8.71 Here, we will have 16 t-tests to perform (4 variables x 4 hormones). First, we must decide whether we
Test for Equal Variances: DBilsec versus saline
saline N Lower StDev Upper
Test for Equal Variances: DBilPh versus saline
CHAPTER 8/HYPOTHESIS TESTING: TWO SAMPLE INFERENCE 165
Test for Equal Variances: DPanPh versus saline
saline N Lower StDev Upper
Results for T-tests are shown below, with significant p-values in bold and underlined:
Two-Sample T-Test and CI: DBilsec_1, DBilsec_2
T-Test of difference = 0 (vs not =): T-Value = 1.00 P-Value = 0.322 DF = 34
Two-Sample T-Test and CI: DBilPh_1, DBilPh_5
Two-Sample T-Test and CI: DPanPh_1, DPanPh_3