CHAPTER 22 (FIN MAN); CHAPTER 8 (MAN)
BUDGETING
DISCUSSION QUESTIONS
1. The three major objectives of budgeting are (1) to establish specific goals for future
operations, (2) to execute plans to achieve the goals, and (3) to periodically compare
actual results with the goals.
4. Conflicting goals can cause employees or department managers to act in their own self-
interests to the detriment of the organization’s objectives.
5. A static budget is most appropriate in situations where costs are not variable to an underlying
activity level. As a result, it is reasonable to plan spending on the basis of a fixed quantity of
resources for the year. This will occur in some administrative functions, such as human
resources, accounting, or public relations.
8. Purchases of direct materials should be closely coordinated with the production budget so
that inventory levels can be maintained within reasonable limits.
9. a. The cash budget contributes to effective cash planning. This involves advance planning
so that a cash shortage does not arise and excess cash is not permitted to remain “idle.”
CHAPTER 22 (FIN MAN); CHAPTER 8 (MAN) Budgeting
BASIC EXERCISES
BE 22–1 (FIN MAN); BE 8–1 (MAN)
Variable cost:
Direct labor (2,350 hours × $30* per hour) ………………………………………
$70,500
Fixed cost:
BE 22–2 (FIN MAN); BE 8–2 (MAN)
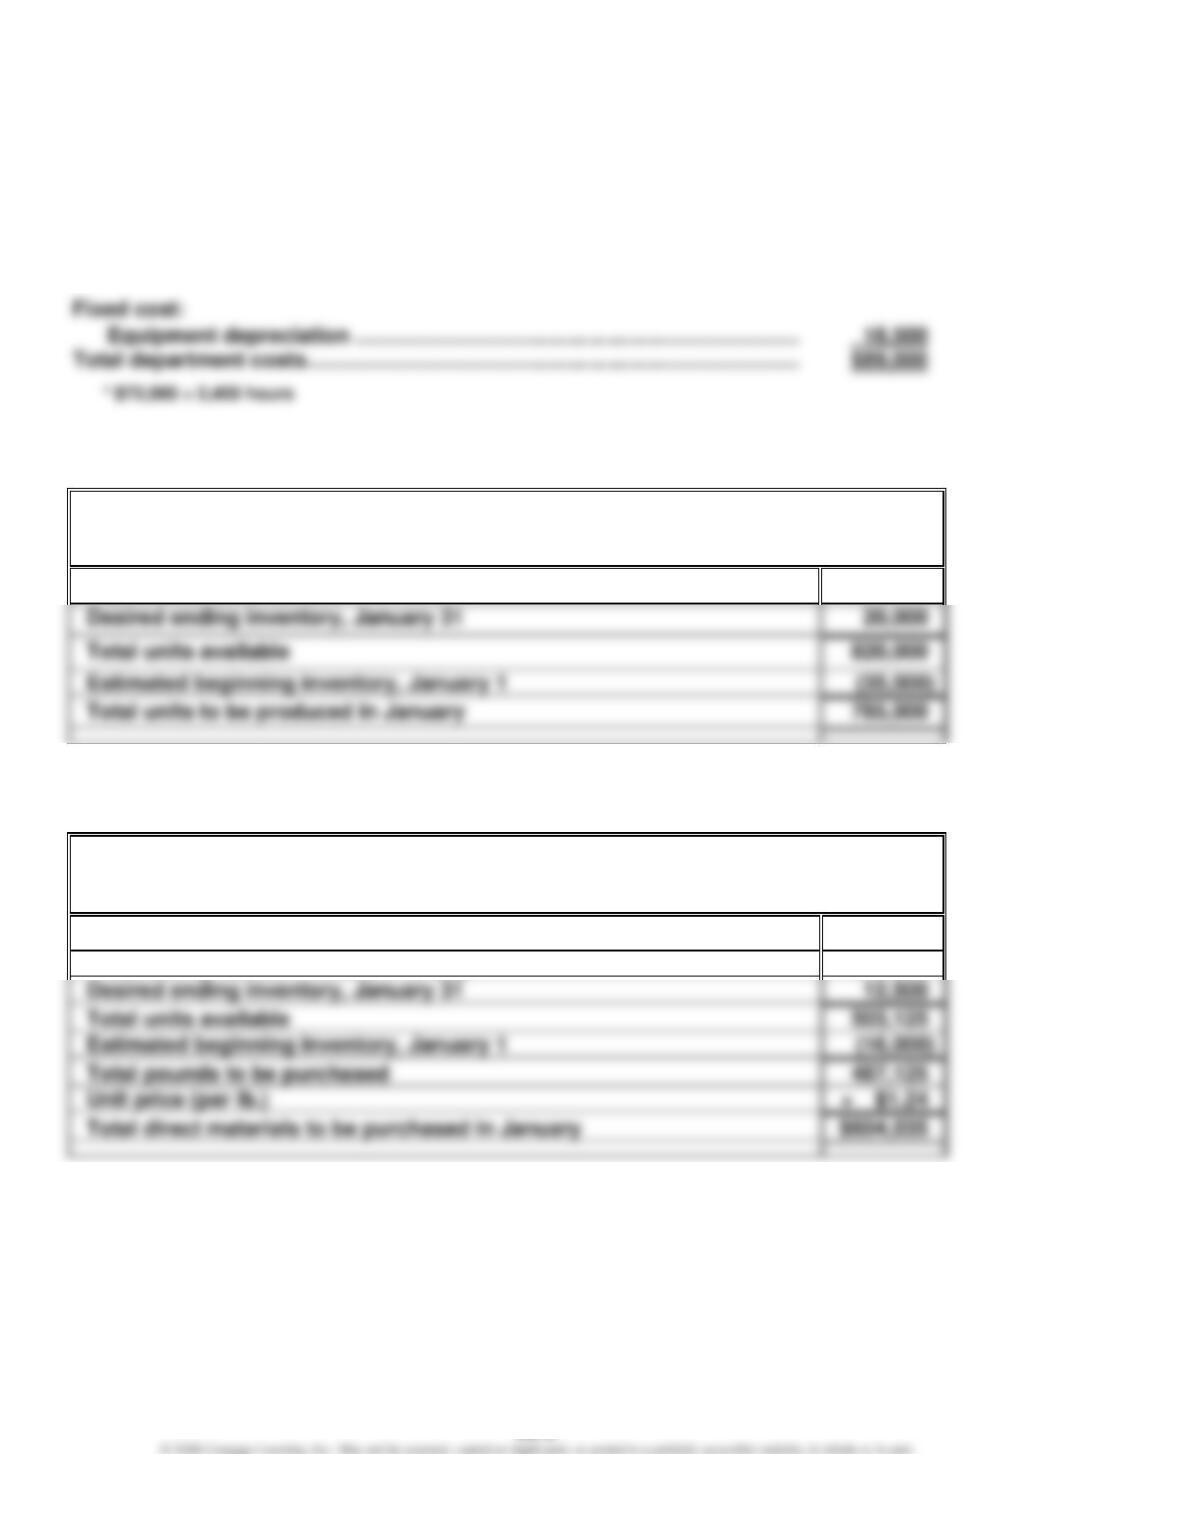
Pasadena Candle Inc.
Production Budget
For the Month Ending January 31
Expected units to be sold
800,000
Total units to be produced in January
785,000
BE 22–3 (FIN MAN); BE 8–3 (MAN)
Pasadena Candle Inc.
Direct Materials Purchases Budget
For the Month Ending January 31
Pounds of wax required for production:
Candles [(785,000 × 10 oz.) ÷ 16 oz.]
490,625
503,125
CHAPTER 22 (FIN MAN); CHAPTER 8 (MAN) Budgeting
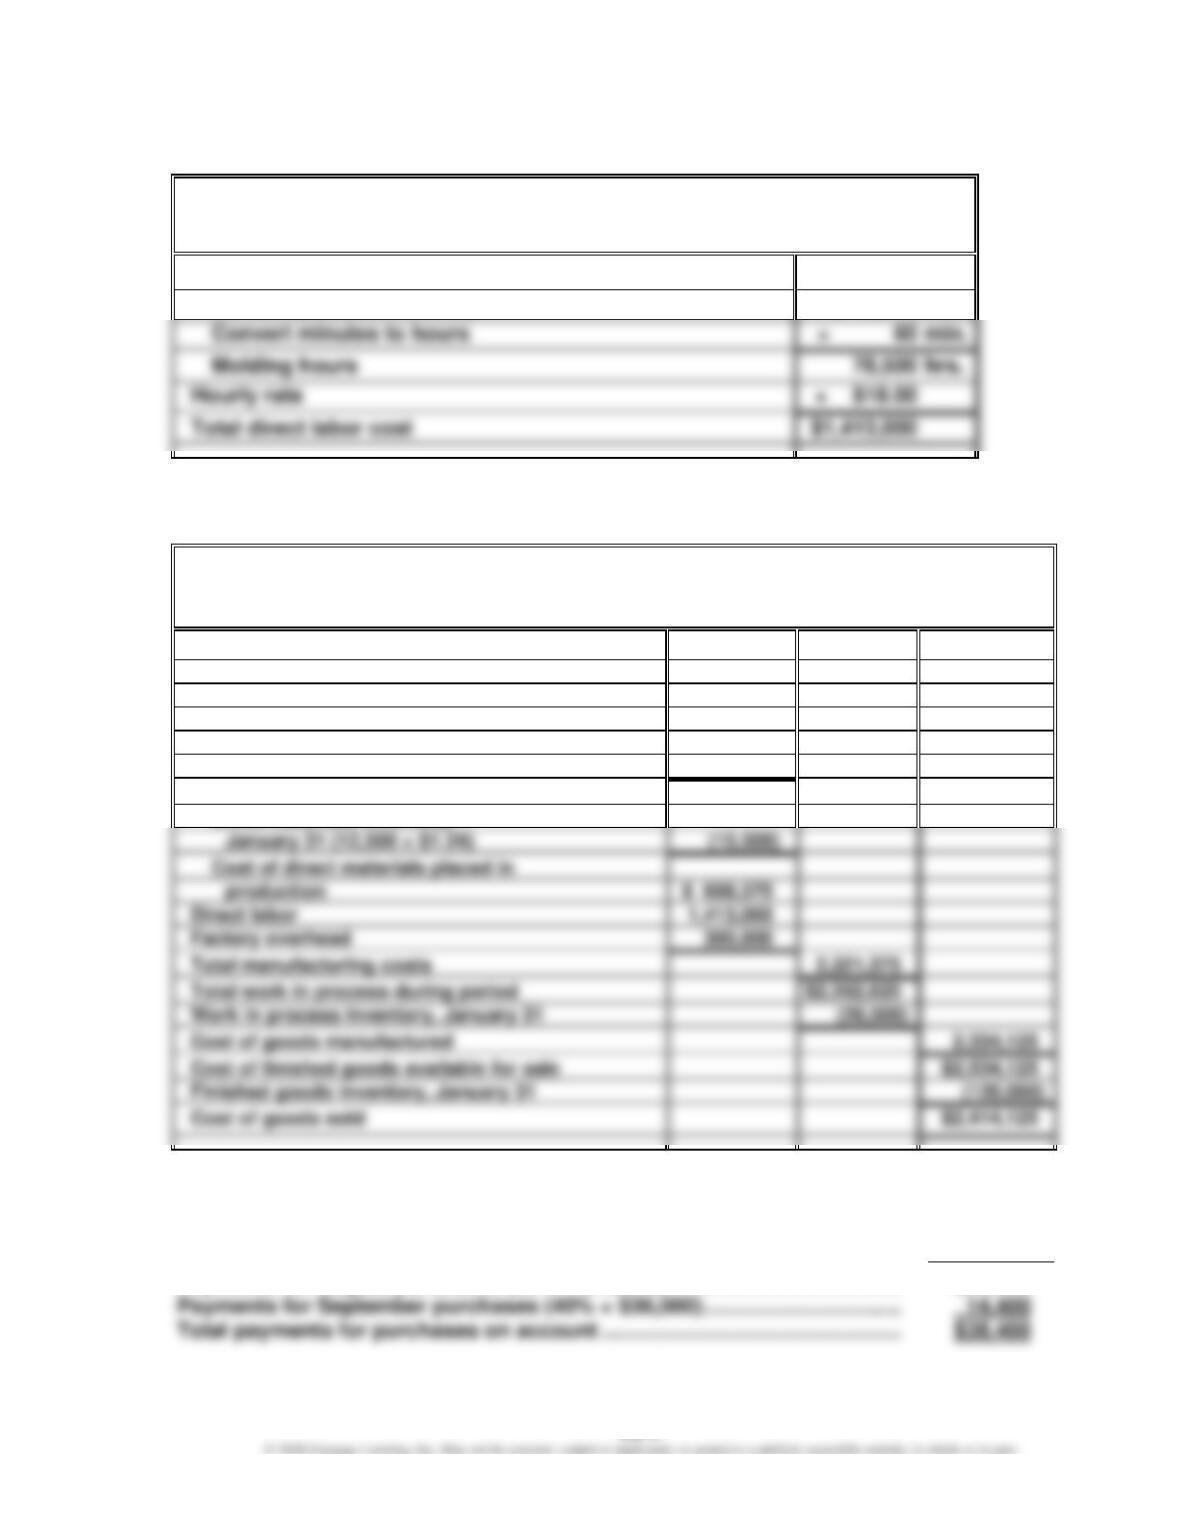
BE 22–4 (FIN MAN); BE 8–4 (MAN)
Pasadena Candle Inc.
Direct Labor Cost Budget
For the Month Ending January 31
Hours required for assembly:
Candles (785,000 × 6 min.)
4,710,000
min.
Molding hours
hrs.
BE 22–5 (FIN MAN); BE 8–5 (MAN)
Pasadena Candle Inc.
Cost of Goods Sold Budget
For the Month Ending January 31
Finished goods inventory, January 1
$ 200,000
Work in process inventory, January 1
$ 41,250
Direct materials:
Direct materials inventory, January 1
(16,000 × $1.24)
$ 19,840
Direct materials purchases
604,035
Cost of direct materials available for use
$ 623,875
Direct materials inventory,
January 31 (12,500 × $1.24)
Cost of direct materials placed in
$ 608,375
Direct labor
Factory overhead
300,000
Total manufacturing costs
Total work in process during period
$2,362,625
Work in process inventory, January 31
Cost of goods manufactured
Cost of finished goods available for sale
$2,534,125
Finished goods inventory, January 31
BE 22–6 (FIN MAN); BE 8–6 (MAN)
September
Payments for August purchases (60% × $40,000) …………………………………
$24,000
Payments for September purchases (40% × $36,000) …………………………...
CHAPTER 22 (FIN MAN); CHAPTER 8 (MAN) Budgeting
EXERCISES
Ex. 22–1 (FIN MAN); Ex. 8–1 (MAN)
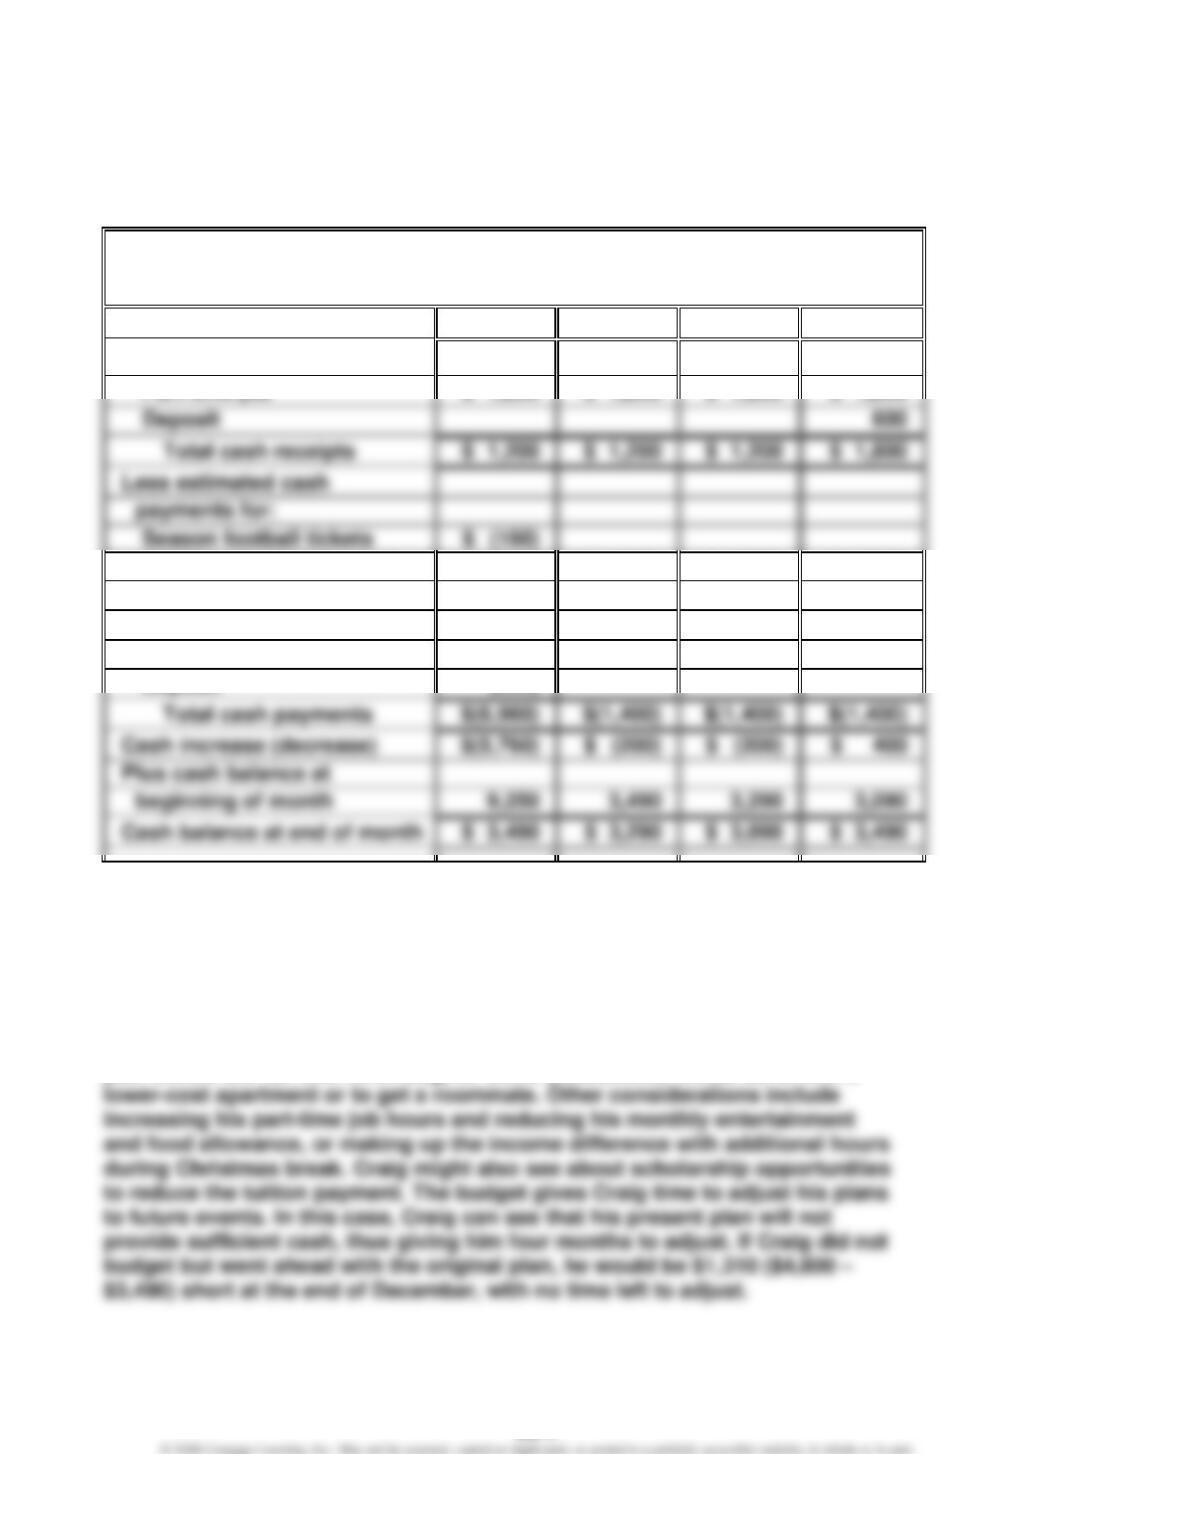
a.
Craig Kovar
Cash Budget
For the Four Months Ending December 31
September
October
November
December
Estimated cash receipts from:
Season football tickets
Additional entertainment
(250)
$ (250)
$ (250)
$ (250)
Tuition
(4,800)
Rent
(600)
(600)
(600)
(600)
Food
(550)
(550)
(550)
(550)
(600)
$ (200)
$ (200)
3,090
b. The four-month budgets do not change with any identified activity level; thus,
they are static budgets.
c. While Craig’s budget might first appear satisfactory, Craig must earn enough
cash in order to pay for the spring semester tuition. His present budget shows
that he will be $1,310 short of the tuition amount ($4,800 – $3,490) by the time
he needs to pay his spring tuition. Thus, Craig will likely need to adjust the
plan before the fall term even begins. Some possibilities would be to rent a
CHAPTER 22 (FIN MAN); CHAPTER 8 (MAN) Budgeting
Ex. 22–2 (FIN MAN); Ex. 8–2 (MAN)
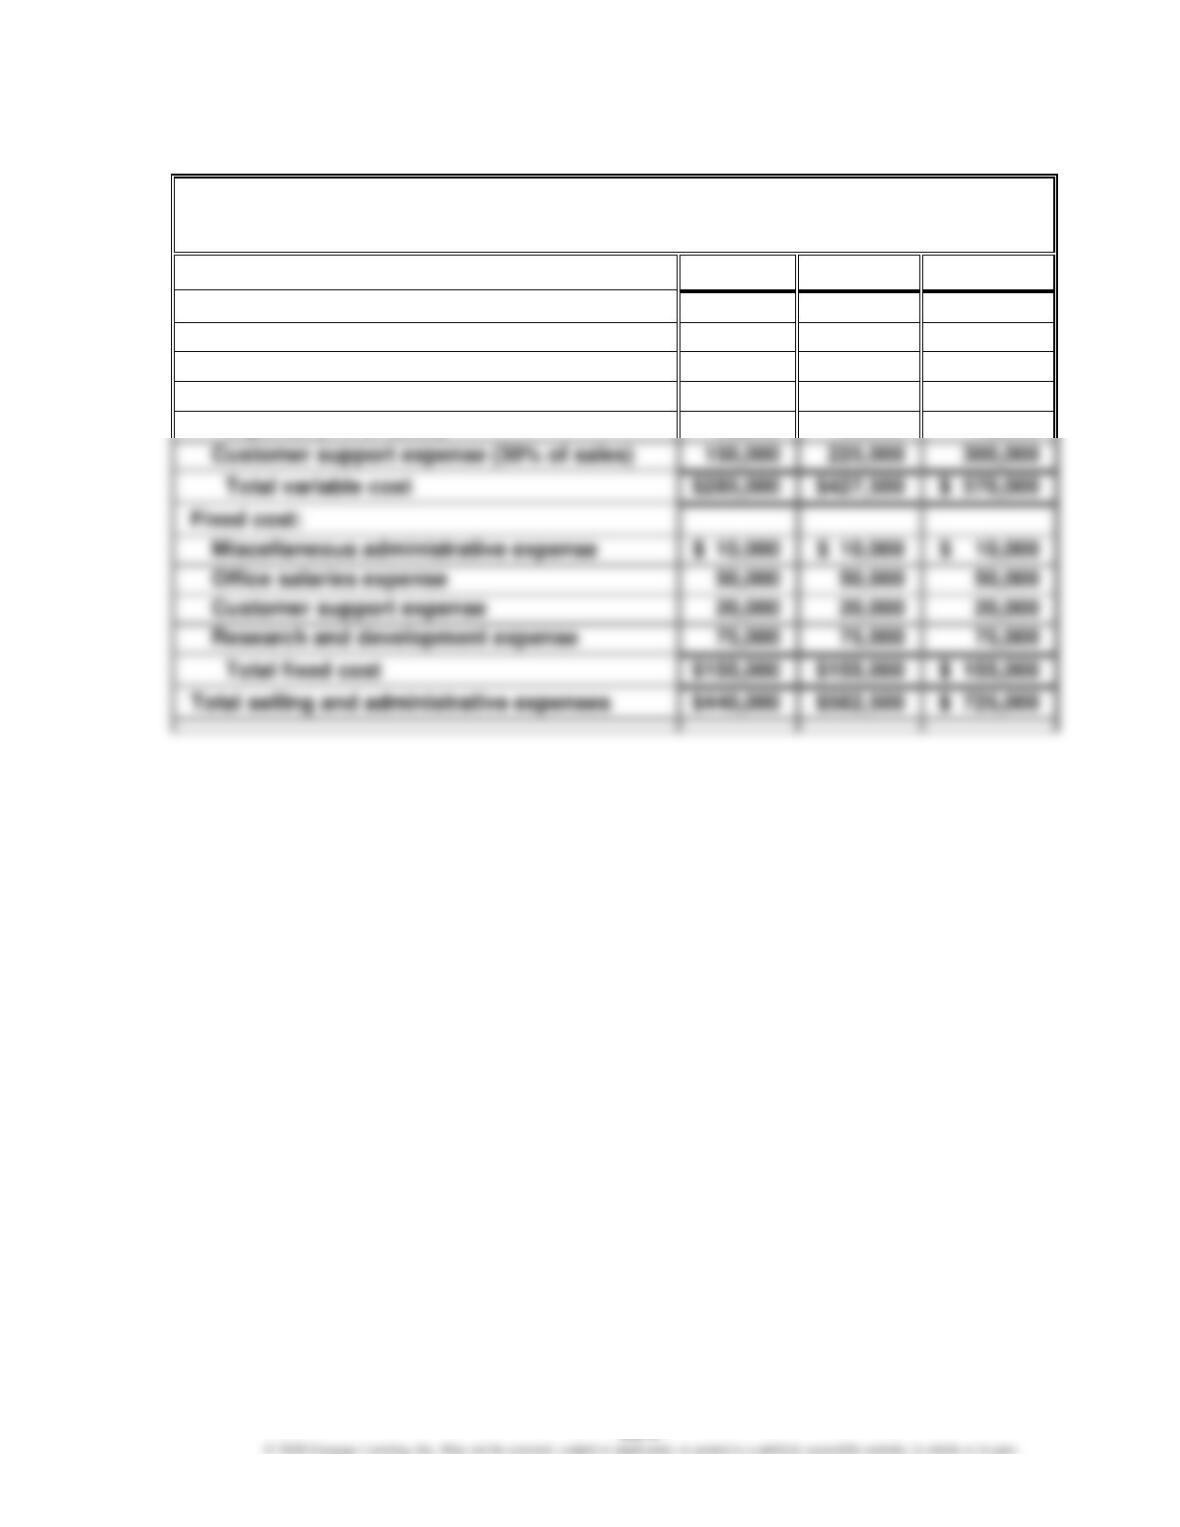
Digital Solutions Inc.
Flexible Selling and Administrative Expenses Budget
For the Month Ending October 31
Total sales
$500,000
$750,000
$1,000,000
Variable cost:
Sales commissions (8% of sales)
$ 40,000
$ 60,000
$ 80,000
Advertising expense (15% of sales)
75,000
112,500
150,000
Miscellaneous administrative
expense (4% of sales)
20,000
30,000
40,000
Customer support expense (30% of sales)
$ 570,000
Fixed cost:
Miscellaneous administrative expense
$ 10,000
Office salaries expense
Customer support expense
20,000
20,000
20,000
CHAPTER 22 (FIN MAN); CHAPTER 8 (MAN) Budgeting
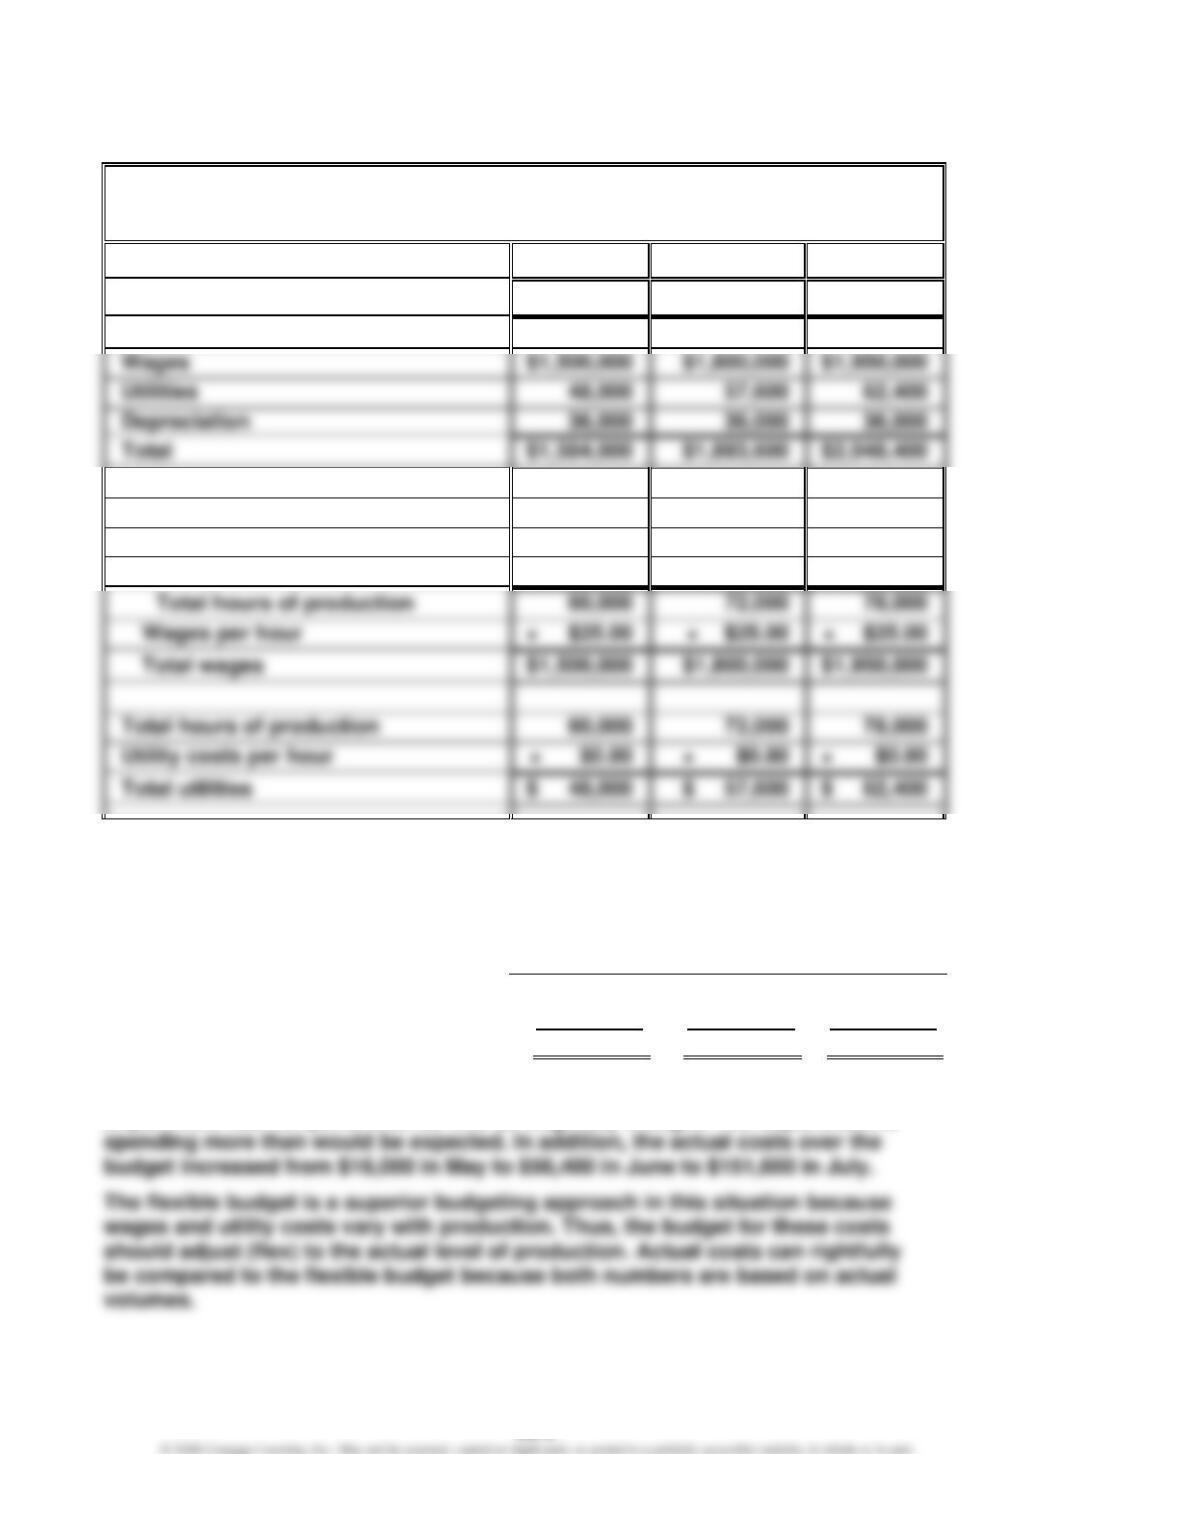
Ex. 22–3 (FIN MAN); Ex. 8–3 (MAN)
a.
Hagerstown Company
Machining Department Budget
For the Three Months Ending July 31
May
June
July
Units of production
40,000
48,000
52,000
Supporting calculations:
Units of production
40,000
48,000
52,000
Hours per unit
× 1.50
× 1.50
× 1.50
Wages per hour
× $25.00
Total hours of production
Utility costs per hour
Depreciation is a fixed cost, so it does not “flex” with changes in production.
Because it is the only fixed cost, the variable and fixed costs are not classified in
the budget.
b.
May
June
July
Total flexible budget …………………………..
$ 1,584,000
$ 1,893,600
$ 2,048,400
Actual cost …………………………………………..
(1,600,000)
(1,950,000)
(2,200,000)
Excess of actual cost over budget …………
$ (16,000)
$ (56,400)
$ (151,600)
The excess of actual cost over the flexible budget suggests that the Machining
Department has not performed as well as originally thought. The department is
CHAPTER 22 (FIN MAN); CHAPTER 8 (MAN) Budgeting
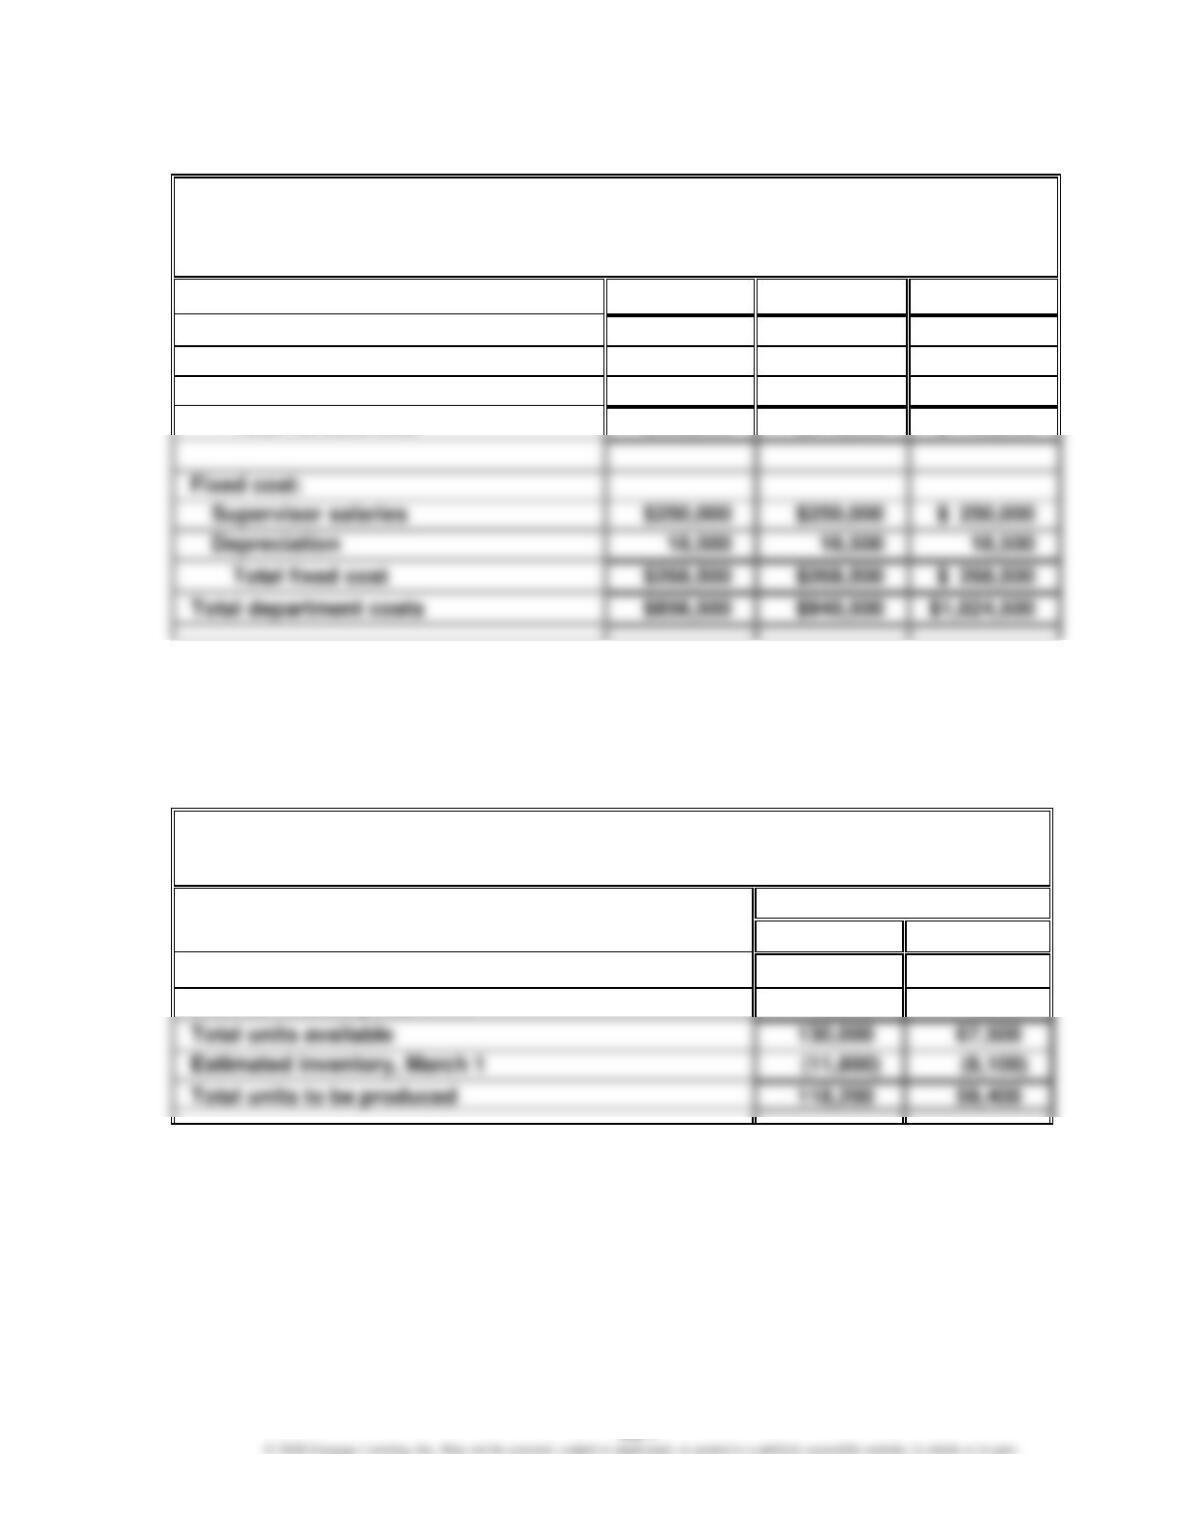
Ex. 22–4 (FIN MAN); Ex. 8–4 (MAN)
Steelcase Inc.
Assembly Department Budget
For the Month Ending February 28
(assumed data)
Units of production
70,000
80,000
90,000
Variable cost:
Direct labor
$588,0001
$672,0002
$ 756,0003
Total variable cost
$588,000
$672,000
$ 756,000
Supervisor salaries
$250,000
$ 250,000
18,500
1 70,000 × 18/60 min. × $28
2 80,000 × 18/60 min. × $28
3 90,000 × 18/60 min. × $28
Ex. 22-5 (FIN MAN); Ex. 8-5 (MAN)
Healthy Measures Inc.
Production Budget
For the Month Ending March 31
Units
Bath Scale
Gym Scale
Expected units to be sold
115,000
60,000
Desired inventory, March 31
15,000
7,500
Total units available
CHAPTER 22 (FIN MAN); CHAPTER 8 (MAN) Budgeting
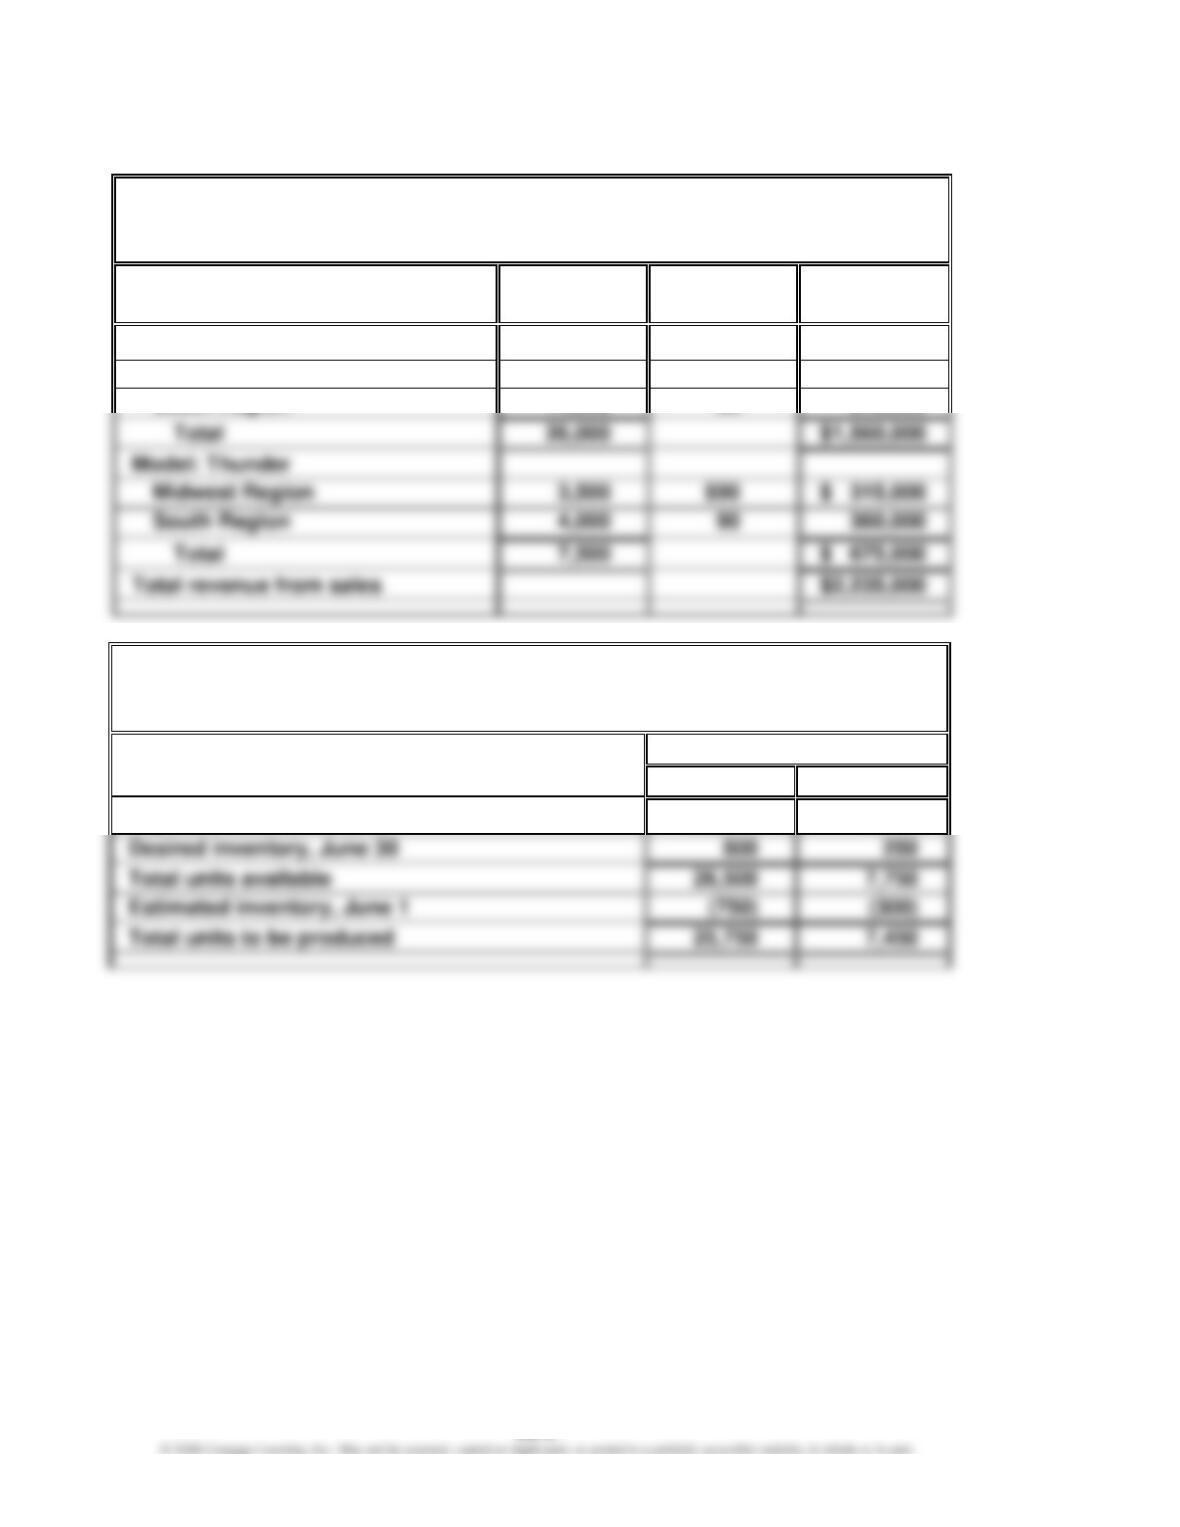
Ex. 22–6 (FIN MAN); Ex. 8–6 (MAN)
a.
Sonic Inc.
Sales Budget
For the Month Ending June 30
Product and Area
Unit Sales
Volume
Unit Selling
Price
Total Sales
Model: Rumble
Midwest Region
12,000
$60
$ 720,000
South Region
14,000
26,000
$ 675,000
b.
Sonic Inc.
Production Budget
For the Month Ending June 30
Units
Rumble
Thunder
Expected units to be sold
26,000
7,500
26,500
25,750
CHAPTER 22 (FIN MAN); CHAPTER 8 (MAN) Budgeting
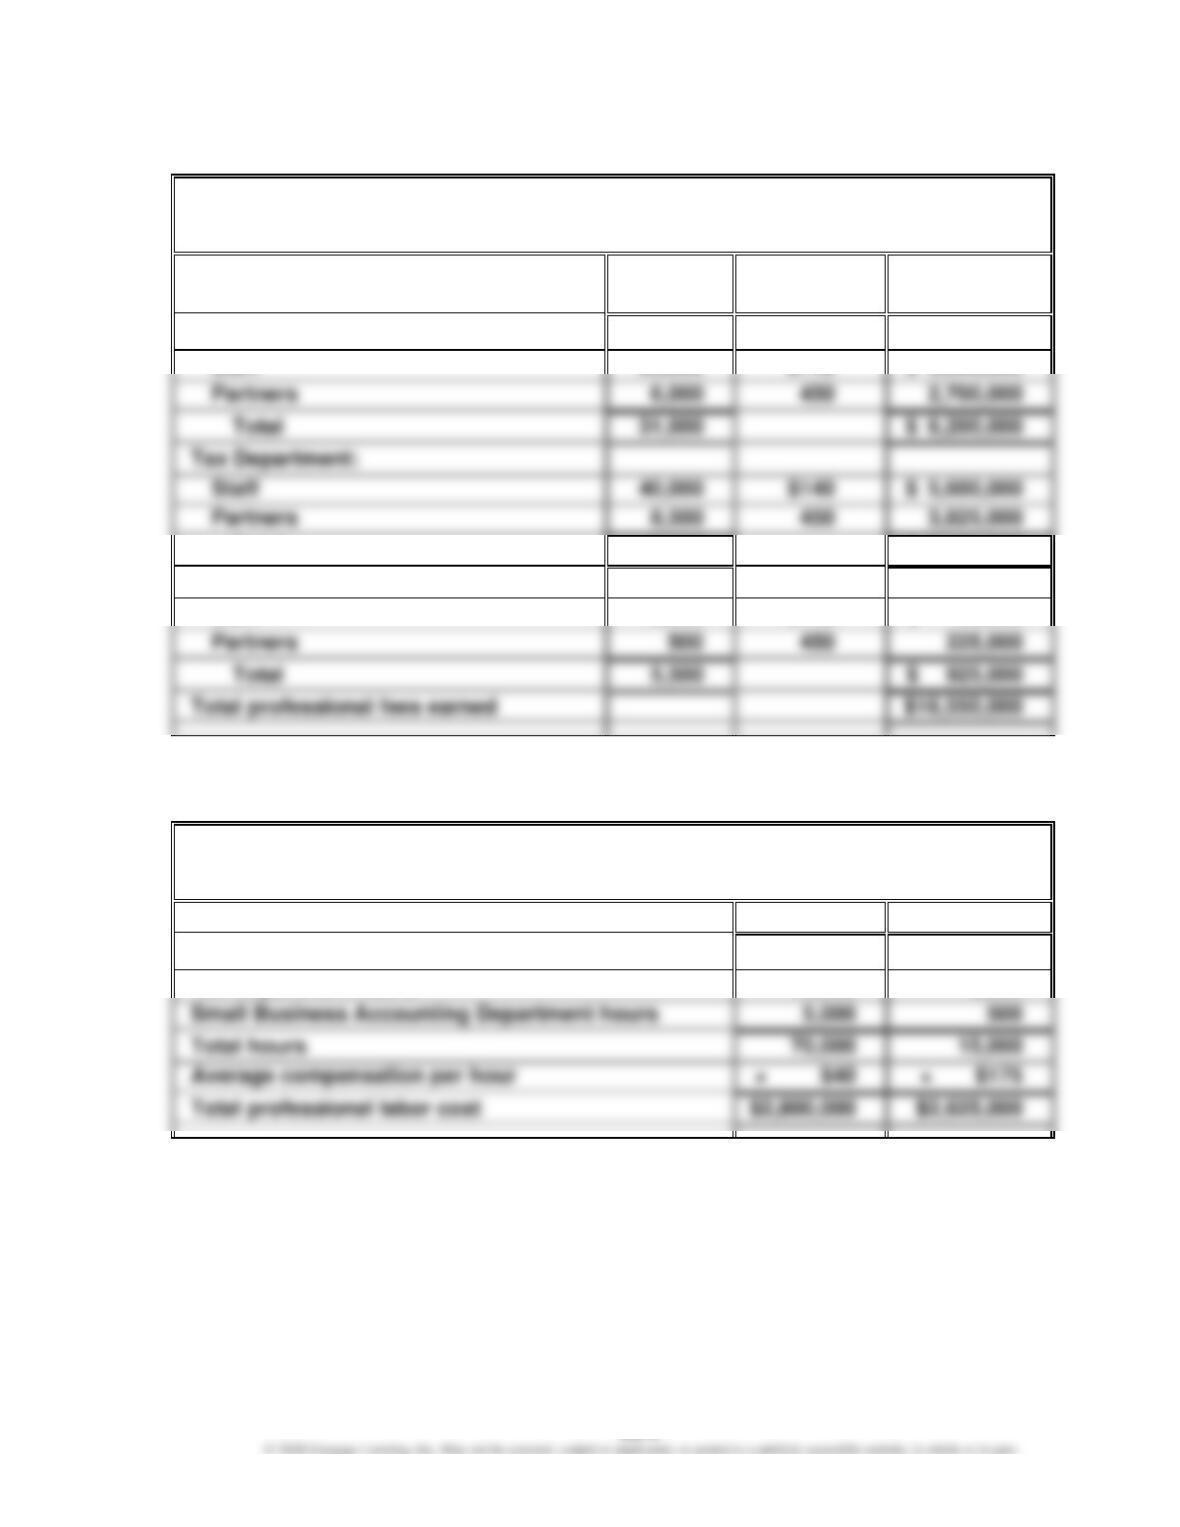
Ex. 22–7 (FIN MAN); Ex. 8–7 (MAN)
Lundquist & Fretwell, CPAs
Professional Fees Earned Budget
For the Year Ending May 31, 20Y8
Billable
Hours
Hourly
Rate
Total
Revenue
Audit Department:
Staff
$140
Partners
6,000
Total
31,000
$ 6,200,000
40,000
$ 5,600,000
Partners
8,500
Total
48,500
$ 9,425,000
Small Business Accounting Department:
Staff
5,000
$140
$ 700,000
Partners
Total
Ex. 22–8 (FIN MAN); Ex. 8–8 (MAN)
Lundquist & Fretwell, CPAs
Professional Labor Cost Budget
For the Year Ending December 31, 20Y8
Staff
Partners
Audit Department hours
25,000
6,000
Tax Department hours
40,000
8,500
Small Business Accounting Department hours
Total hours
70,000
Average compensation per hour
× $40
CHAPTER 22 (FIN MAN); CHAPTER 8 (MAN) Budgeting
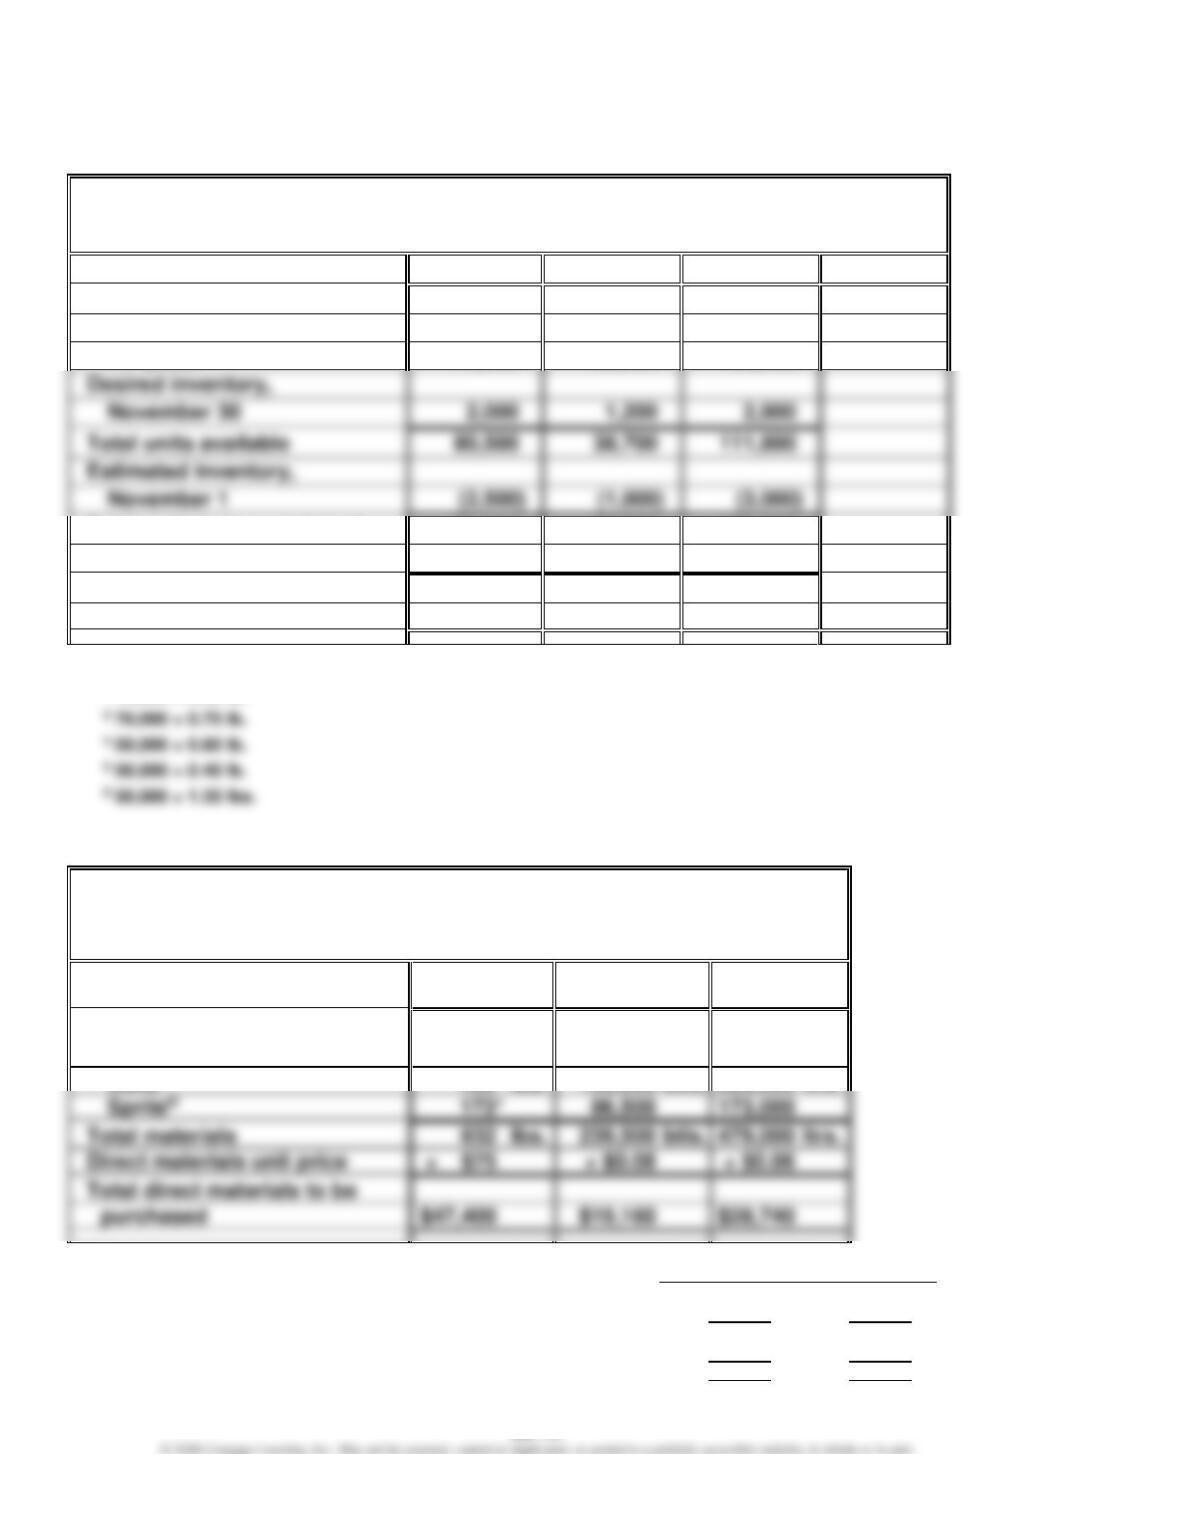
Ex. 22–9 (FIN MAN); Ex. 8–9 (MAN)
Tobin’s Frozen Pizza Inc.
Direct Materials Purchases Budget
For the Month Ending November 30
Dough
Tomato
Cheese
Total
Units required for production:
12″ pizza
38,5001
17,5002
49,0003
16″ pizza
40,0004
20,0005
60,0006
Desired inventory,
November 30
Total units available
80,500
38,700
111,800
Estimated inventory,
November 1
Total units to be purchased
78,000
37,700
108,800
Unit price
× $0.50
× $0.60
× $0.85
Total direct materials to
be purchased
$39,000
$22,620
$92,480
$154,100
1 70,000 × 0.55 lb.
2 70,000 × 0.25 lb.
Ex. 22–10 (FIN MAN); Ex. 8–10 (MAN)
Coca-Cola Enterprises—Wakefield Plant
Direct Materials Purchases Budget
For the Month Ending May 31
(assumed data)
Concentrate
2-Liter
Bottles
Carbonated
Water
Materials required for
production:
Coke®
Sprite®
* Production in liters (bottles × 2 liters/bottle) ………………………….
306,000
173,000
Divide by 100 ……………………………………………………………………….
÷ 100
÷ 100
3,060
1,730
Multiply by concentrate pounds per 100 liters ……………………….
× 0.15
× 0.10
Concentrate pounds required for production ………………………..
459
173
CHAPTER 22 (FIN MAN); CHAPTER 8 (MAN) Budgeting
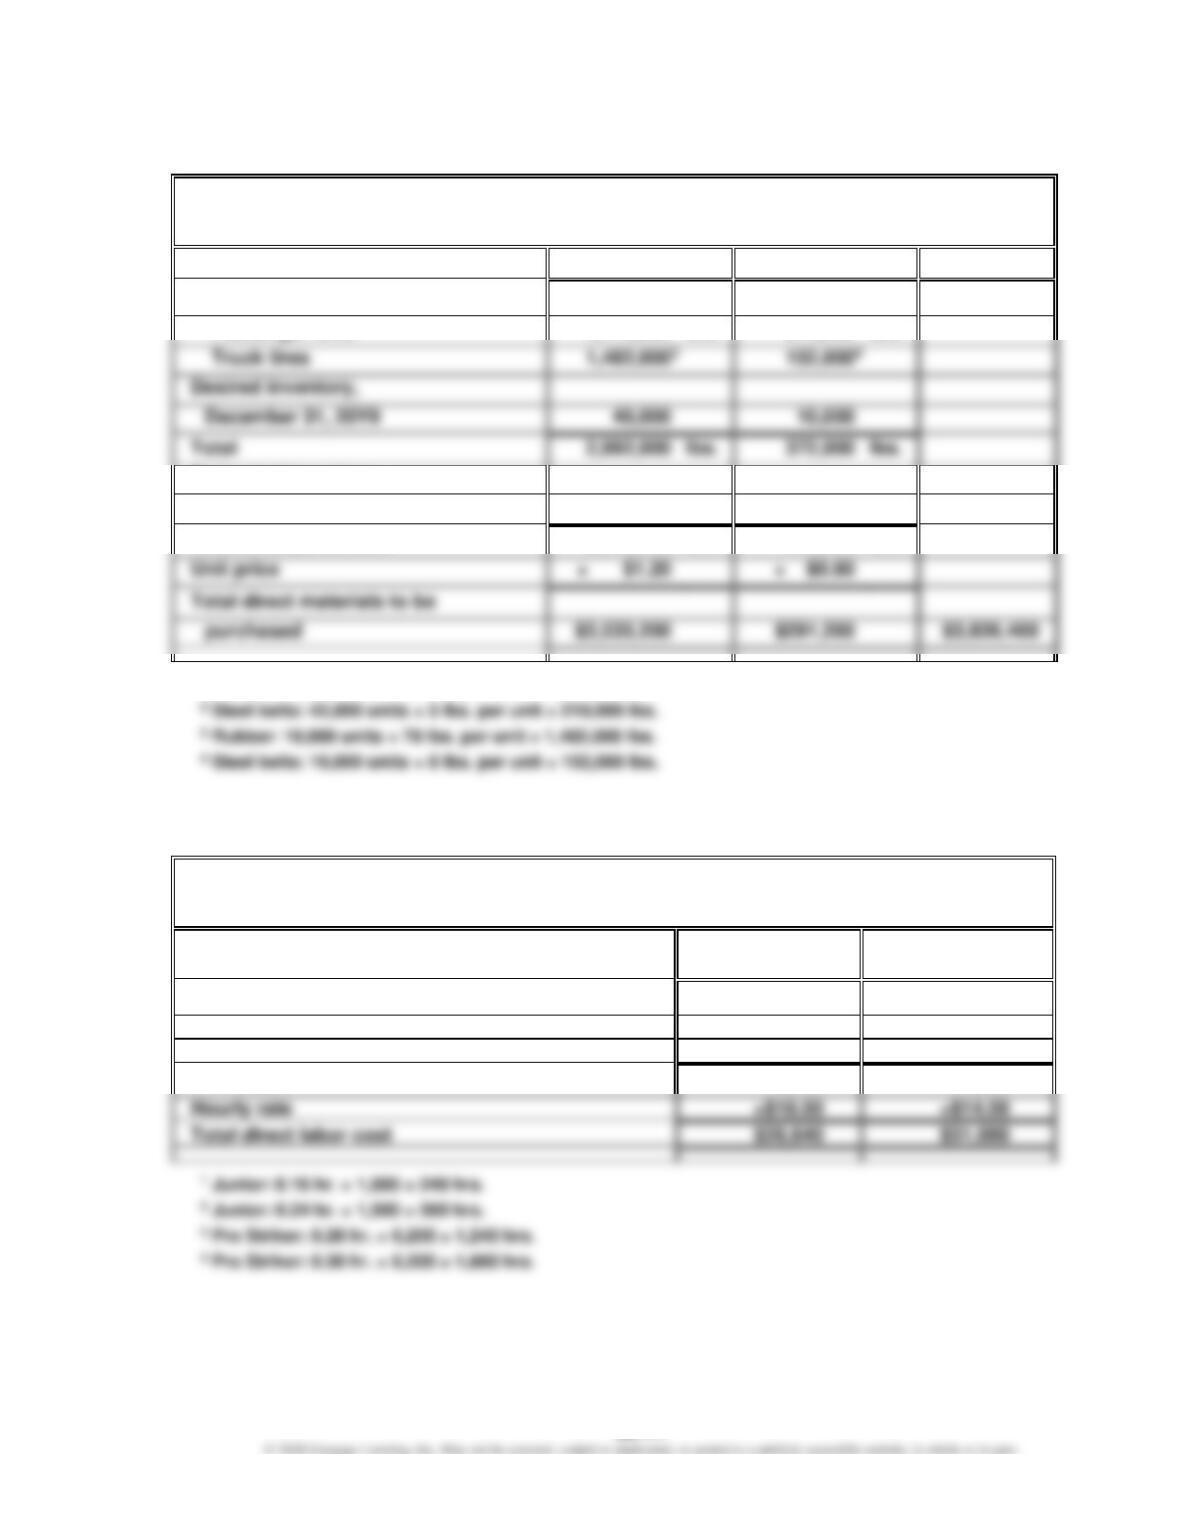
Ex. 22–11 (FIN MAN); Ex. 8–11 (MAN)
Safety Grip Company
Direct Materials Purchases Budget
For the Year Ending December 31, 20Y9
Rubber
Steel Belts
Total
Pounds required for production:
Passenger tires
1,470,000
lbs.1
210,000
lbs.2
1,482,0003
152,0004
Desired inventory,
2,992,000
lbs.
372,000
lbs.
Estimated inventory,
January 1, 20Y9
(46,000)
(8,000)
Total units purchased
2,946,000
lbs.
364,000
lbs.
Total direct materials to be
1 Rubber: 42,000 units × 35 lbs. per unit = 1,470,000 lbs.
Ex. 22–12 (FIN MAN); Ex. 8–12 (MAN)
Ace Racket Company
Direct Labor Cost Budget
For the Month Ending July 31
Forming
Department
Assembly
Department
Hours required for production:
Junior
2401
3602
Pro Striker
1,2403
1,8604
Total
1,480
2,220
CHAPTER 22 (FIN MAN); CHAPTER 8 (MAN) Budgeting
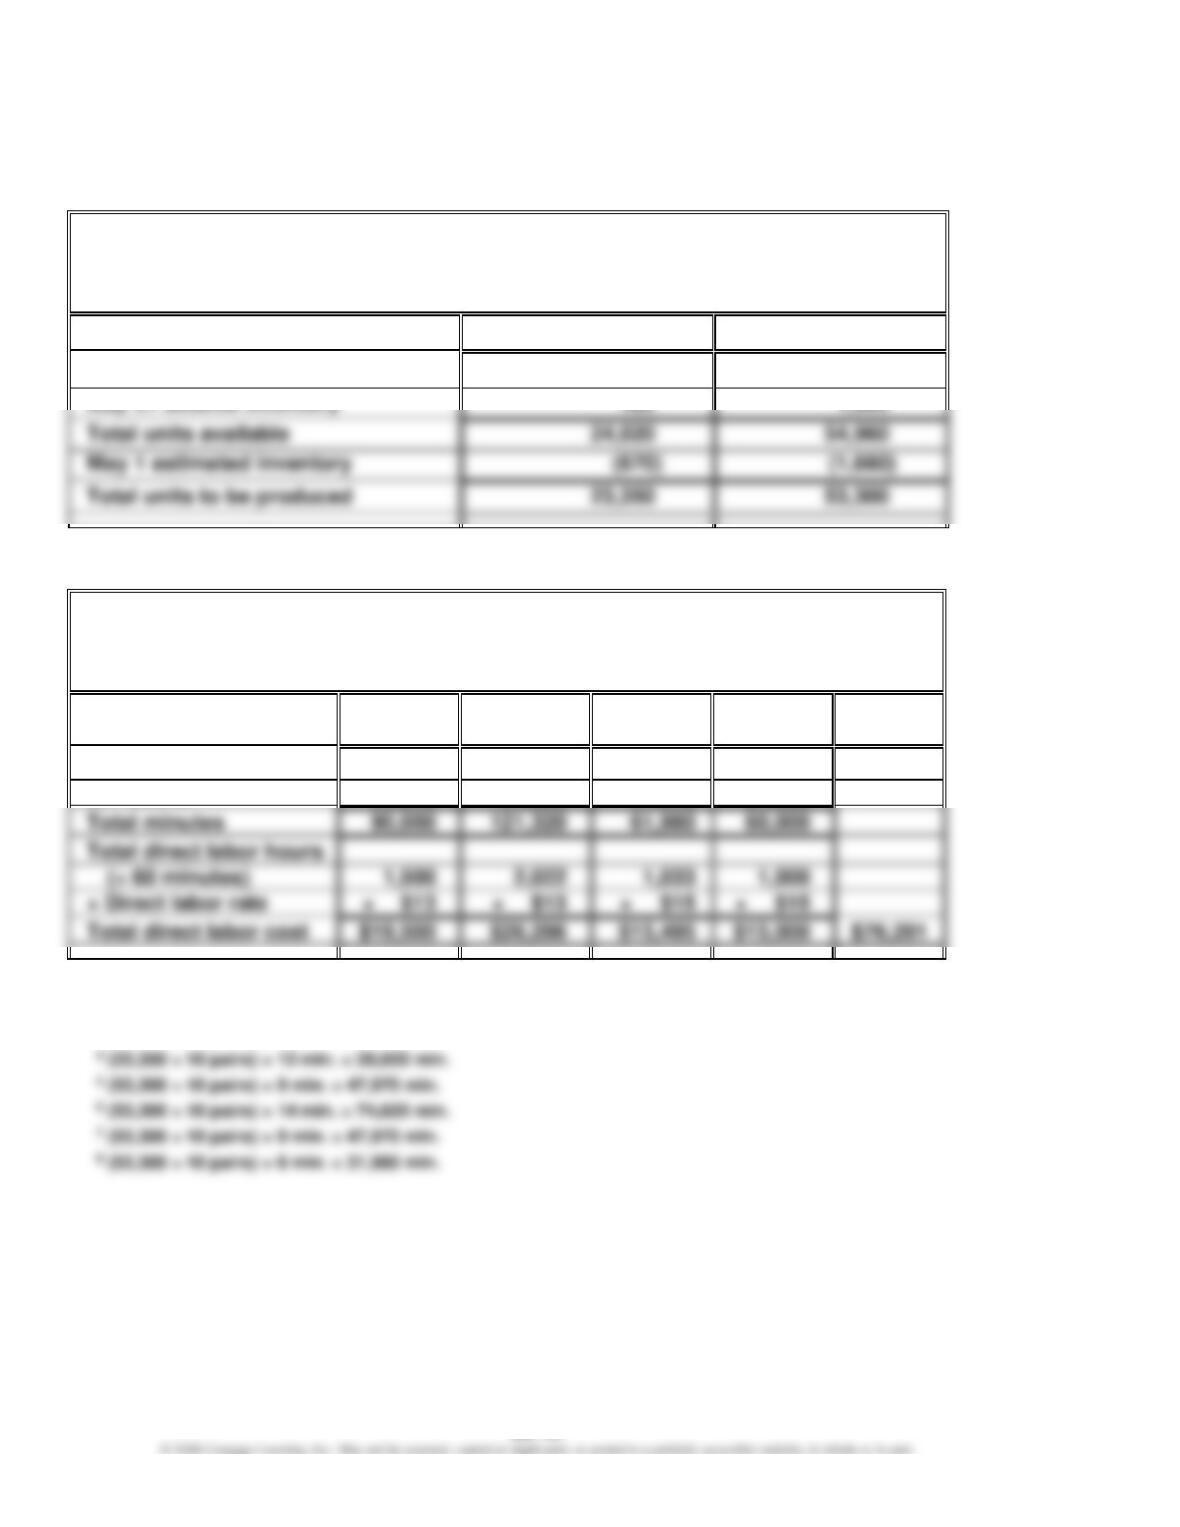
Ex. 22–13 (FIN MAN); Ex. 8–13 (MAN)
a.
Levi Strauss & Co.
Production Budget
For the Month Ending May 31
(assumed data)
Dockers®
501 Jeans®
Expected units to be sold
23,600
53,100
b.
Levi Strauss & Co.
Direct Labor Cost Budget
For the Month Ending May 31
(assumed data)
Inseam
Outer-
seam
Pockets
Zipper
Total
Dockers®
42,0301
46,7002
14,0103
28,0204
501 Jeans®
47,9705
74,6206
47,9707
31,9808
1 (23,350 ÷ 10 pairs) × 18 min. = 42,030 min.
2 (23,350 ÷ 10 pairs) × 20 min. = 46,700 min.
3 (23,350 ÷ 10 pairs) × 6 min. = 14,010 min.
CHAPTER 22 (FIN MAN); CHAPTER 8 (MAN) Budgeting
Ex. 22–14 (FIN MAN); Ex. 8–14 (MAN)
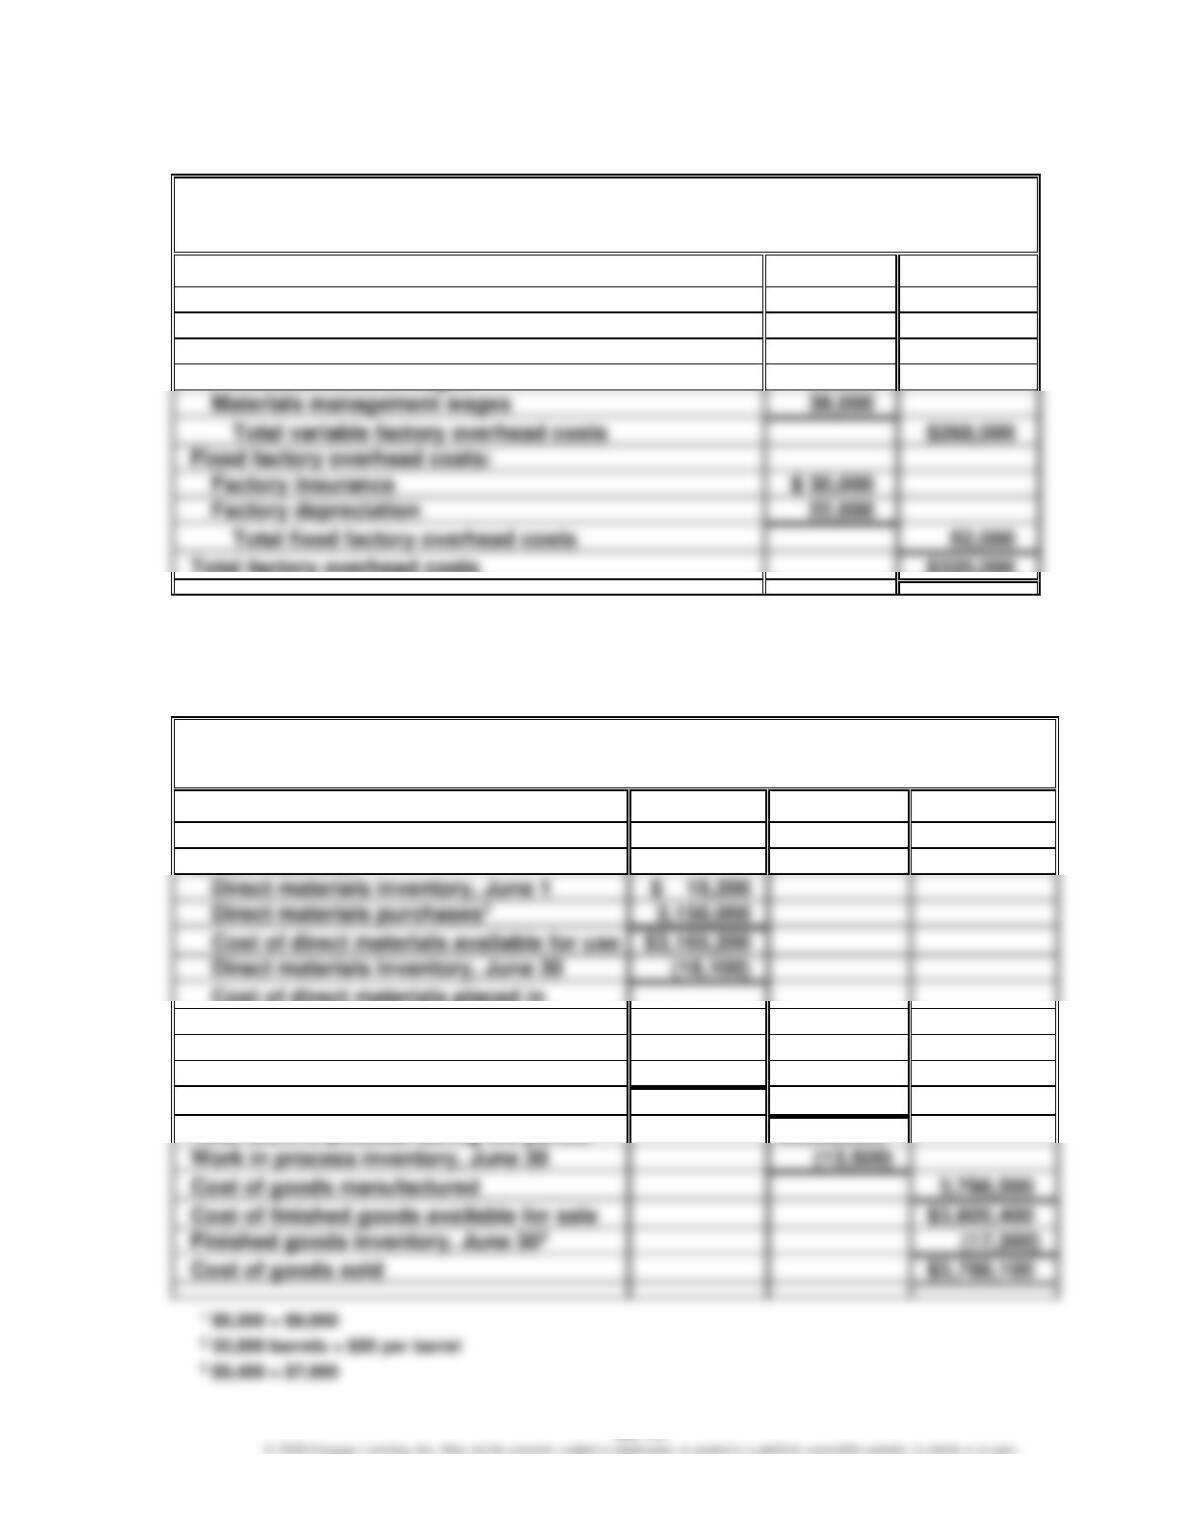
Sweet Tooth Candy Company
Factory Overhead Cost Budget
For the Month Ending August 31
Variable factory overhead costs:
Manufacturing supplies
$ 14,000
Power and light
48,000
Production supervisor wages
135,000
Production control wages
32,000
Materials management wages
39,000
$268,000
Fixed factory overhead costs:
Factory insurance
$ 30,000
Factory depreciation
22,000
Total factory overhead costs
$320,000
Note: Advertising expenses, sales commissions, and executive officer salaries are selling
and administrative expenses.
Ex. 22–15 (FIN MAN); Ex. 8–15 (MAN)
Delaware Chemical Company
Cost of Goods Sold Budget
For the Month Ending June 30
Finished goods inventory, June 11
$ 16,900
Work in process inventory, June 1
$ 12,900
Direct materials:
Direct materials inventory, June 1
Cost of direct materials available for use
$3,165,200
Direct materials inventory, June 30
Cost of direct materials placed in
production
$3,149,100
Direct labor
240,000
Factory overhead
400,000
Total manufacturing costs
3,789,100
Total work in process during the period
Work in process inventory, June 30
(13,500)
Cost of goods manufactured
3,788,500
Cost of finished goods available for sale
Cost of goods sold
CHAPTER 22 (FIN MAN); CHAPTER 8 (MAN) Budgeting
Ex. 22–16 (FIN MAN); Ex. 8–16 (MAN)
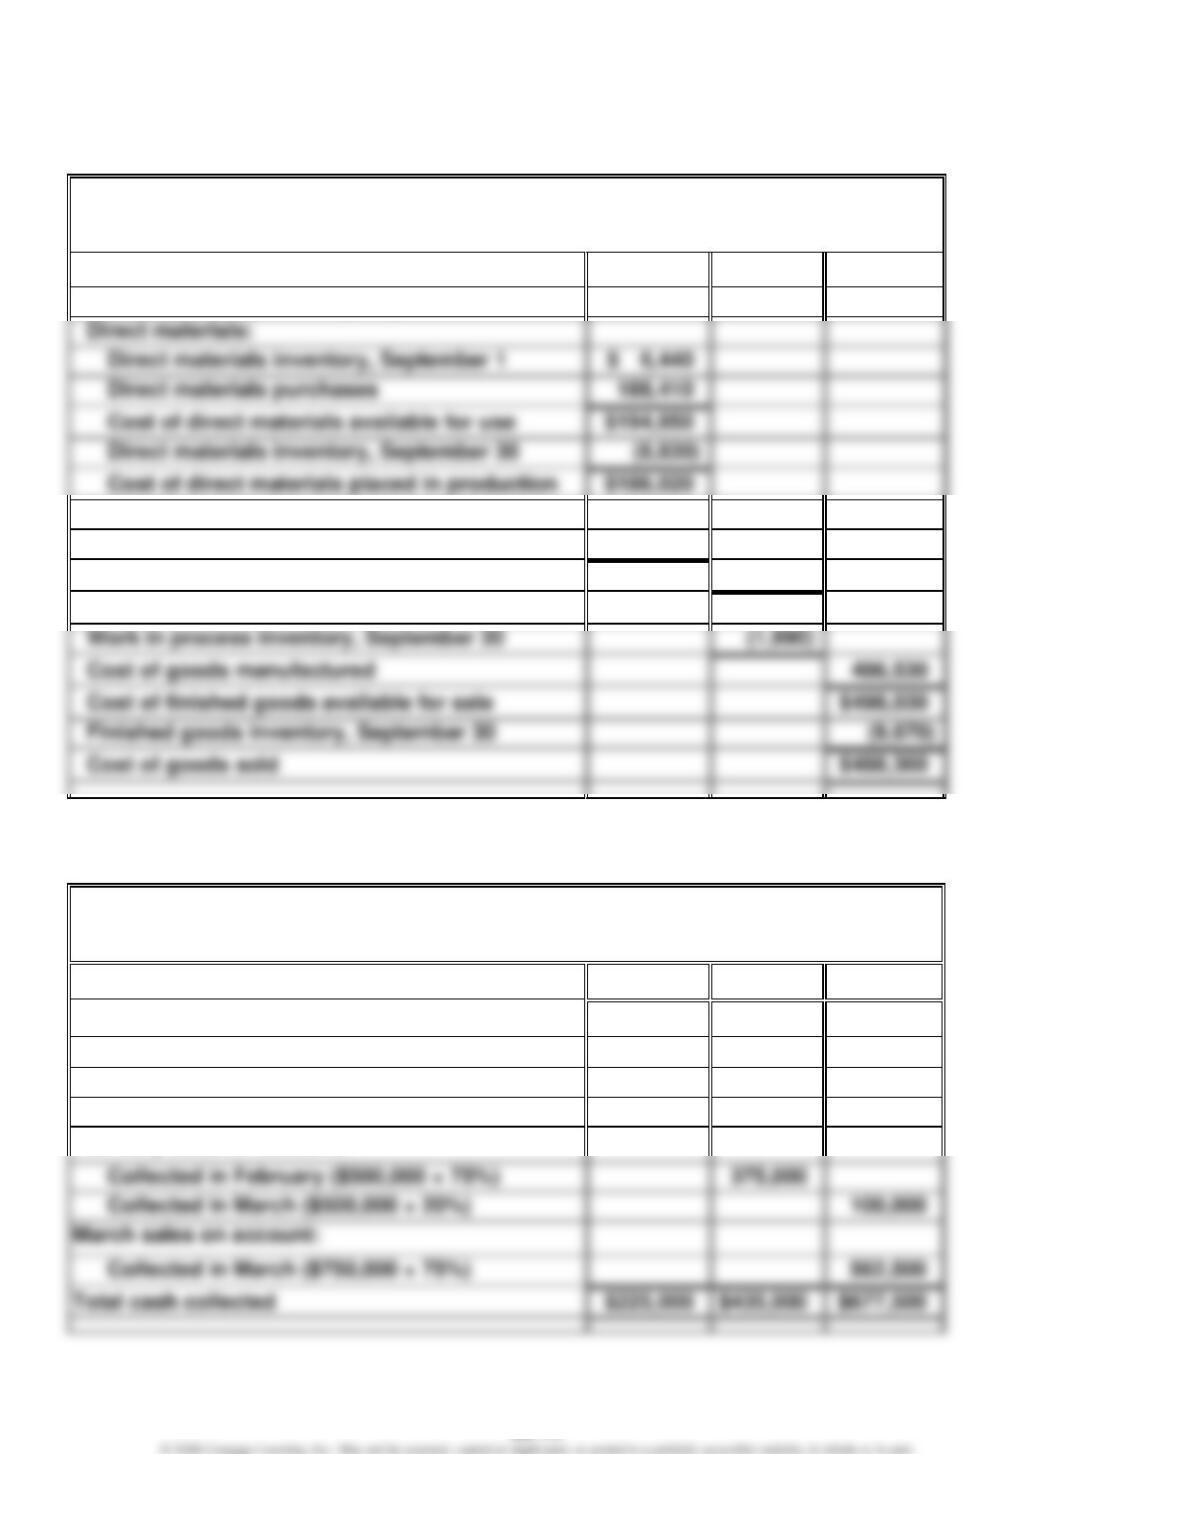
MingWare Ceramics Inc.
Cost of Goods Sold Budget
For the Month Ending September 30
Finished goods inventory, September 1
$ 11,500
Work in process inventory, September 1
$ 3,400
Direct materials:
Direct materials inventory, September 1
Direct materials purchases
188,410
Cost of direct materials available for use
Cost of direct materials placed in production
Direct labor
193,600
Factory overhead
105,500
Total manufacturing costs
485,120
Total work in process during the period
$488,520
Cost of goods manufactured
Finished goods inventory, September 30
Ex. 22–17 (FIN MAN); Ex. 8–17 (MAN)
Pet Supplies Inc.
Schedule of Collections from Sales
For the Three Months Ending March 31
January
February
March
January sales on account:
Collected in January ($300,000 × 75%)
$225,000
Collected in February ($300,000 × 20%)
$ 60,000
Collected in March ($300,000 × 5%)
$ 15,000
February sales on account:
Collected in March ($500,000 × 20%)
Collected in March ($750,000 × 75%)
CHAPTER 22 (FIN MAN); CHAPTER 8 (MAN) Budgeting
Ex. 22–18 (FIN MAN); Ex. 8–18 (MAN)
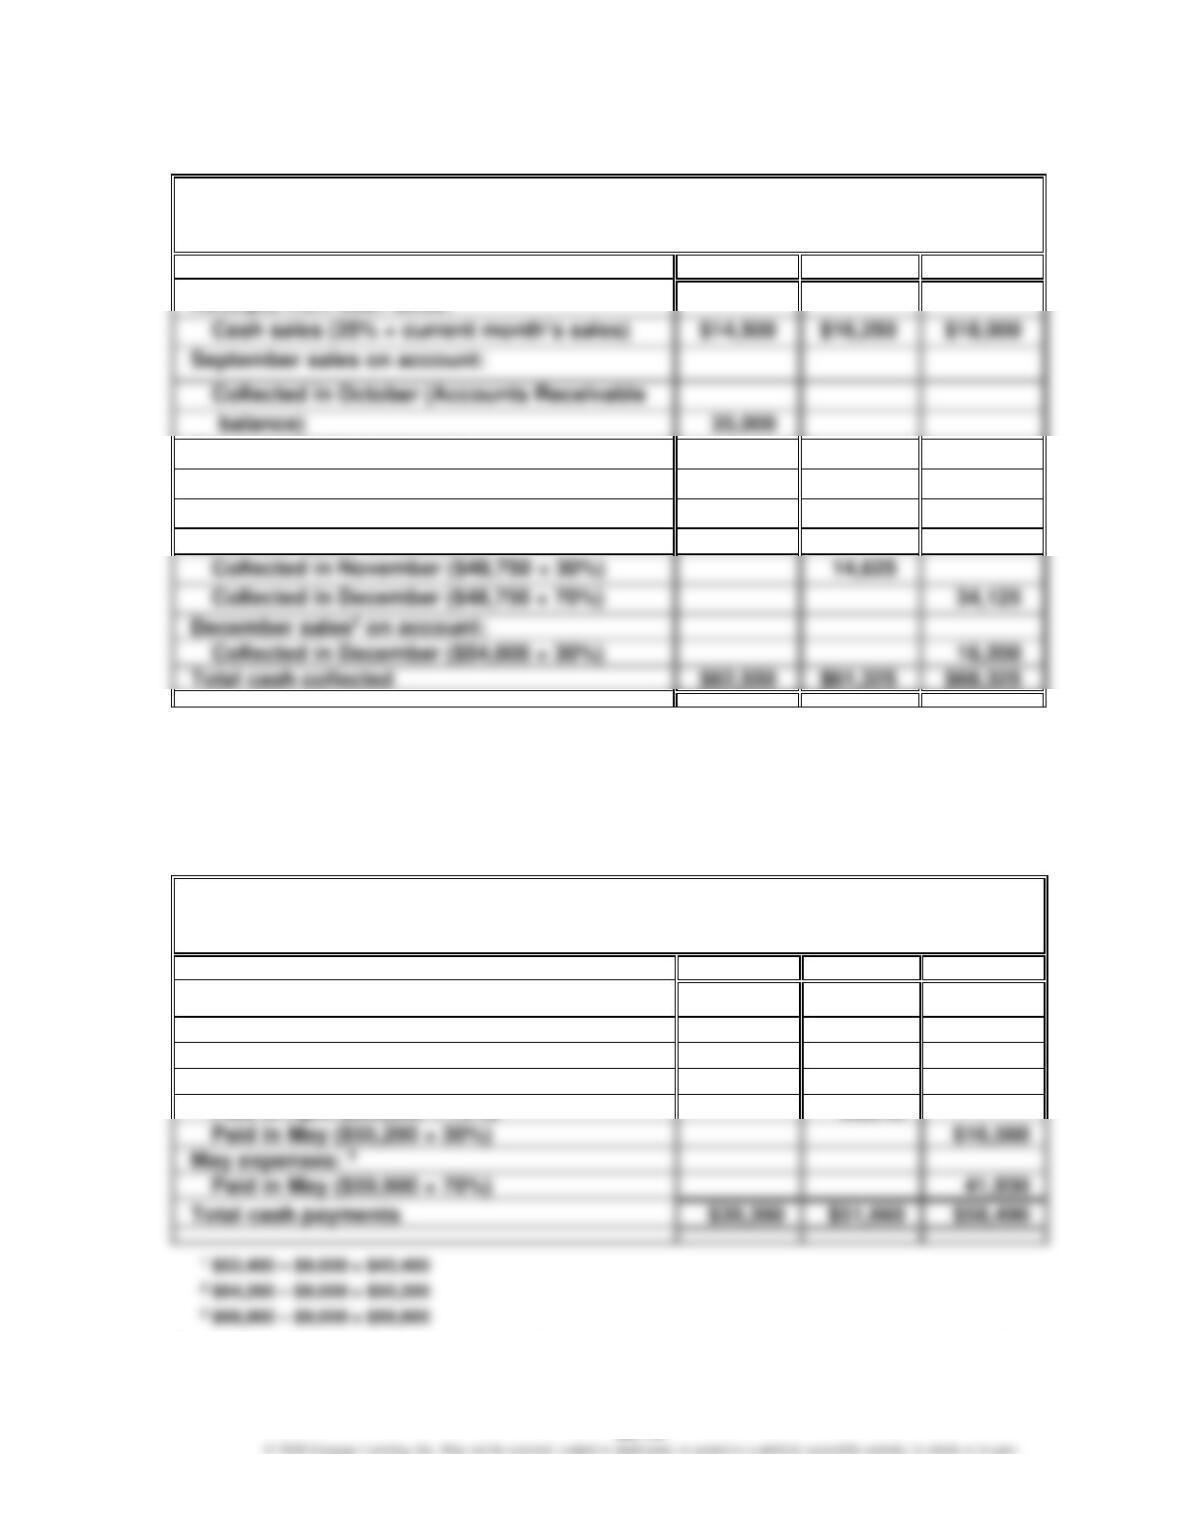
OfficeMart Inc.
Schedule of Cash Collections from Sales
For the Three Months Ending December 31
October
November
December
Cash sales (25% × current month’s sales)
Collected in October (Accounts Receivable
October sales1 on account:
Collected in October ($43,500 × 30%)
13,050
Collected in November ($43,500 × 70%)
30,450
November sales2 on account:
Collected in November ($48,750 × 30%)
Collected in December ($48,750 × 70%)
34,125
1 $58,000 × 75% = $43,500
2 $65,000 × 75% = $48,750
3 $72,000 × 75% = $54,000
Ex. 22–19 (FIN MAN); Ex. 8–19 (MAN)
Horizon Financial Inc.
Schedule of Cash Payments for Selling and Administrative Expenses
For the Three Months Ending May 31
March
April
May
March expenses: 1
Paid in March ($43,400 × 70%)
$30,380
Paid in April ($43,400 × 30%)
$13,020
April expenses: 2
Paid in May ($55,200 × 30%)
$16,560
May expenses: 3
Paid in May ($59,900 × 70%)
$30,380
$51,660
$58,490
Note: Insurance, property taxes, and depreciation are expenses that do not result in cash
payments in March, April, or May.
CHAPTER 22 (FIN MAN); CHAPTER 8 (MAN) Budgeting
Ex. 22–20 (FIN MAN); Ex. 8–20 (MAN)
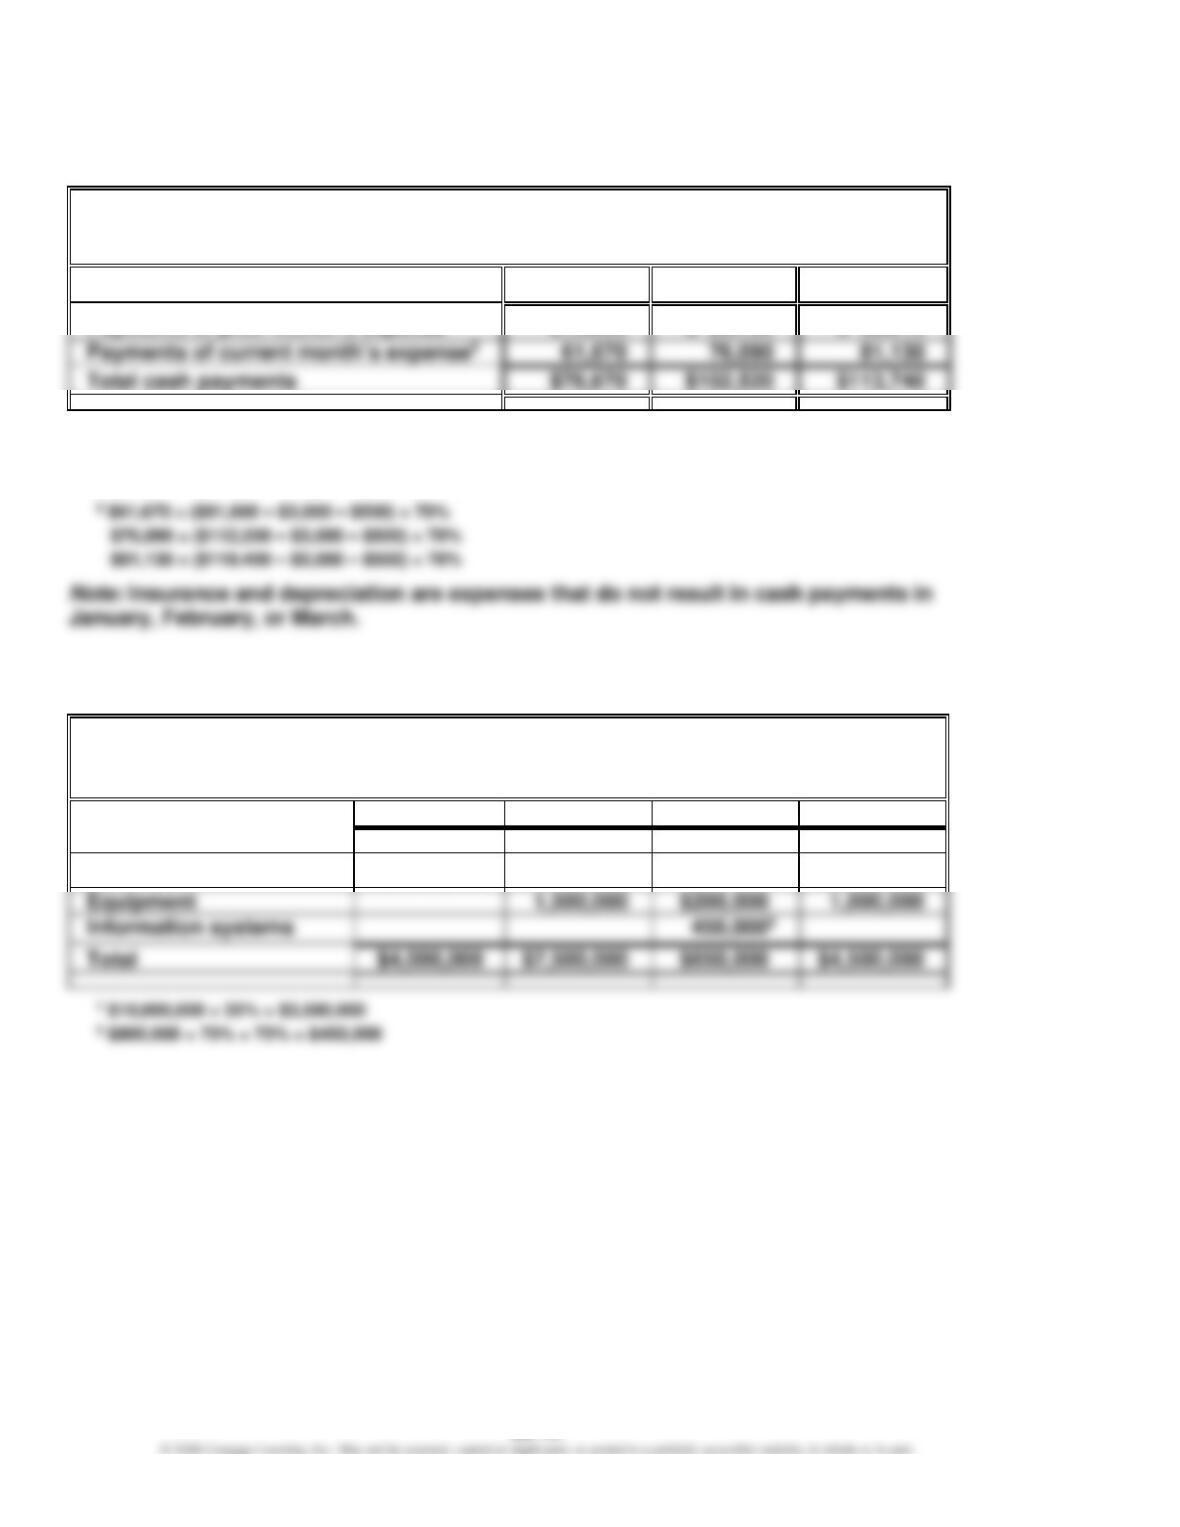
EastGate Physical Therapy Inc.
Schedule of Cash Payments for Operations
For the Three Months Ending March 31
January
February
March
1 $15,000, given as Accrued Expenses Payable, January 1
$26,430 = ($91,600 – $3,000 – $500) × 30%
$32,610 = ($112,200 – $3,000 – $500) × 30%
Ex. 22–21 (FIN MAN); Ex. 8–21 (MAN)
Omicron Inc.
Capital Expenditures Budget
For the Four Years Ending December 31, 20Y6–20Y9
20Y6
20Y7
20Y8
20Y9
Building
$4,000,000
$6,000,000
$3,500,0001
CHAPTER 22 (FIN MAN); CHAPTER 8 (MAN) Budgeting
PROBLEMS
Prob. 22–1A (FIN MAN); Prob. 8–1A (MAN)
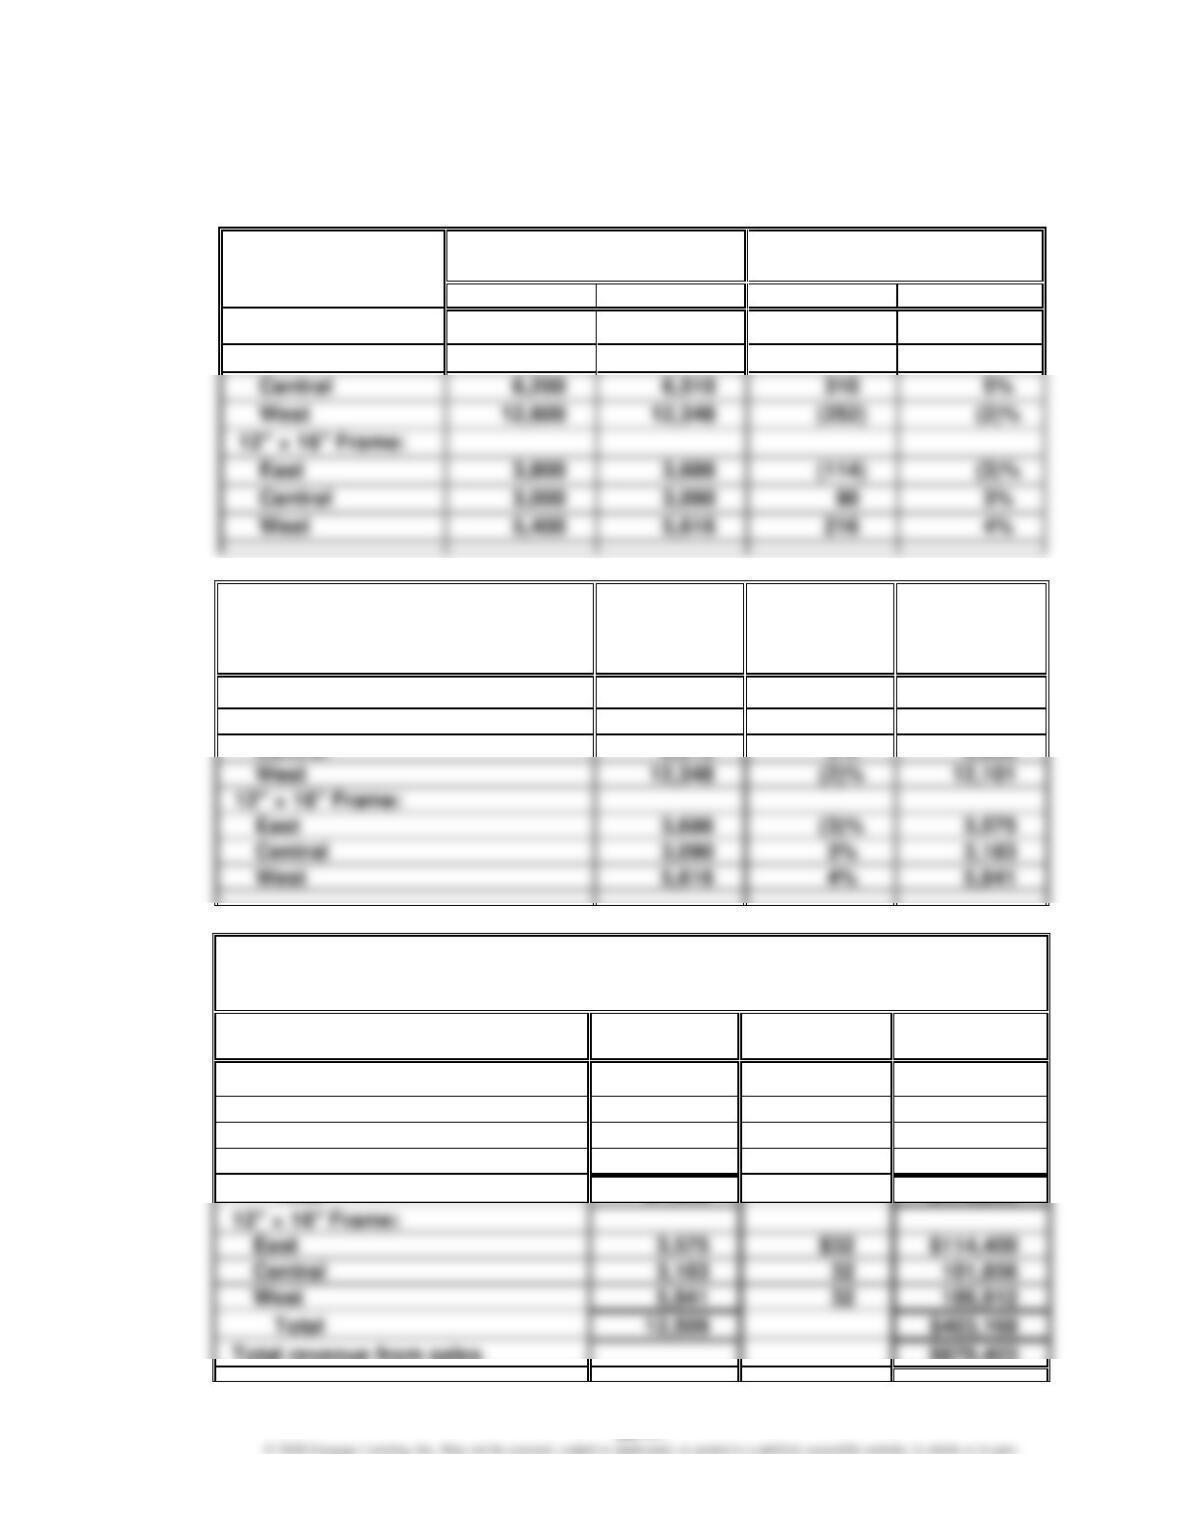
1.
Unit Sales, Year Ended 20Y8
Increase (Decrease)
Actual Over Budget
Budget
Actual Sales
Amount
Percent
8″ × 10″ Frame:
East
8,500
8,755
255
3%
Central
6,200
6,510
310
5%
West
12″ × 16″ Frame:
East
3,800
3,686
Central
3,000
3,090
3%
West
5,400
5,616
216
4%
2.
20Y8
Actual
Units
Percentage
Increase
(Decrease)
20Y9
Budgeted
Units
(rounded)
8″ × 10″ Frame:
East
8,755
3%
9,018
West
5,616
4%
5,841
3.
Raphael Frame Company
Sales Budget
For the Year Ending December 31, 20Y9
Product and Area
Unit Sales
Volume
Unit Selling
Price
Total Sales
8″ × 10″ Frame:
East
9,018
$17
$153,306
Central
6,836
17
116,212
West
12,101
17
205,717
27,955
$114,400
West
5,841
32
186,912
Total revenue from sales
$878,403
CHAPTER 22 (FIN MAN); CHAPTER 8 (MAN) Budgeting
Prob. 22–2A (FIN MAN); Prob. 8–2A (MAN)
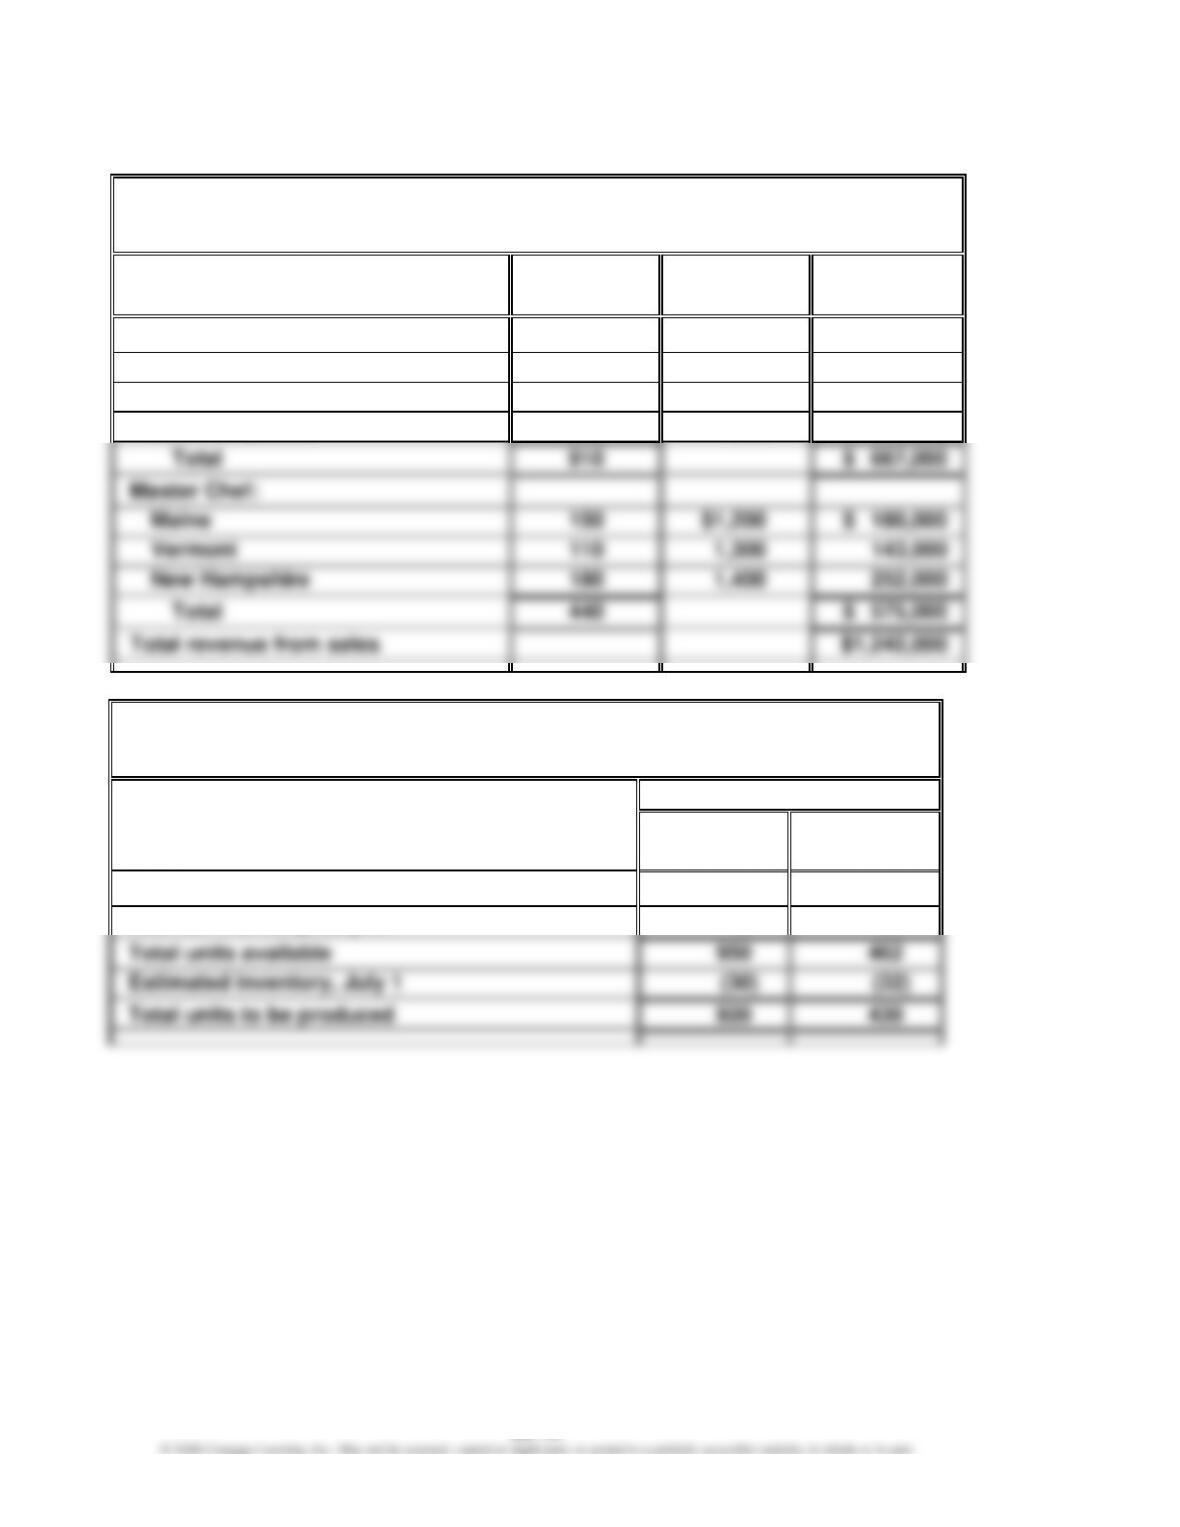
1.
Gourmet Grill Company
Sales Budget
For the Month Ending July 31
Product and Area
Unit Sales
Volume
Unit Selling
Price
Total Sales
Backyard Chef:
Maine
310
$ 700
$ 217,000
Vermont
240
750
180,000
New Hampshire
360
750
270,000
Master Chef:
Maine
150
$ 180,000
Vermont
110
143,000
440
$ 575,000
2.
Gourmet Grill Company
Production Budget
For the Month Ending July 31
Units
Backyard
Chef
Master
Chef
Expected units to be sold
910
440
Desired inventory, July 31
40
22
Total units available
CHAPTER 22 (FIN MAN); CHAPTER 8 (MAN) Budgeting
Prob. 22–2A (FIN MAN); Prob. 8–2A (MAN) (Continued)
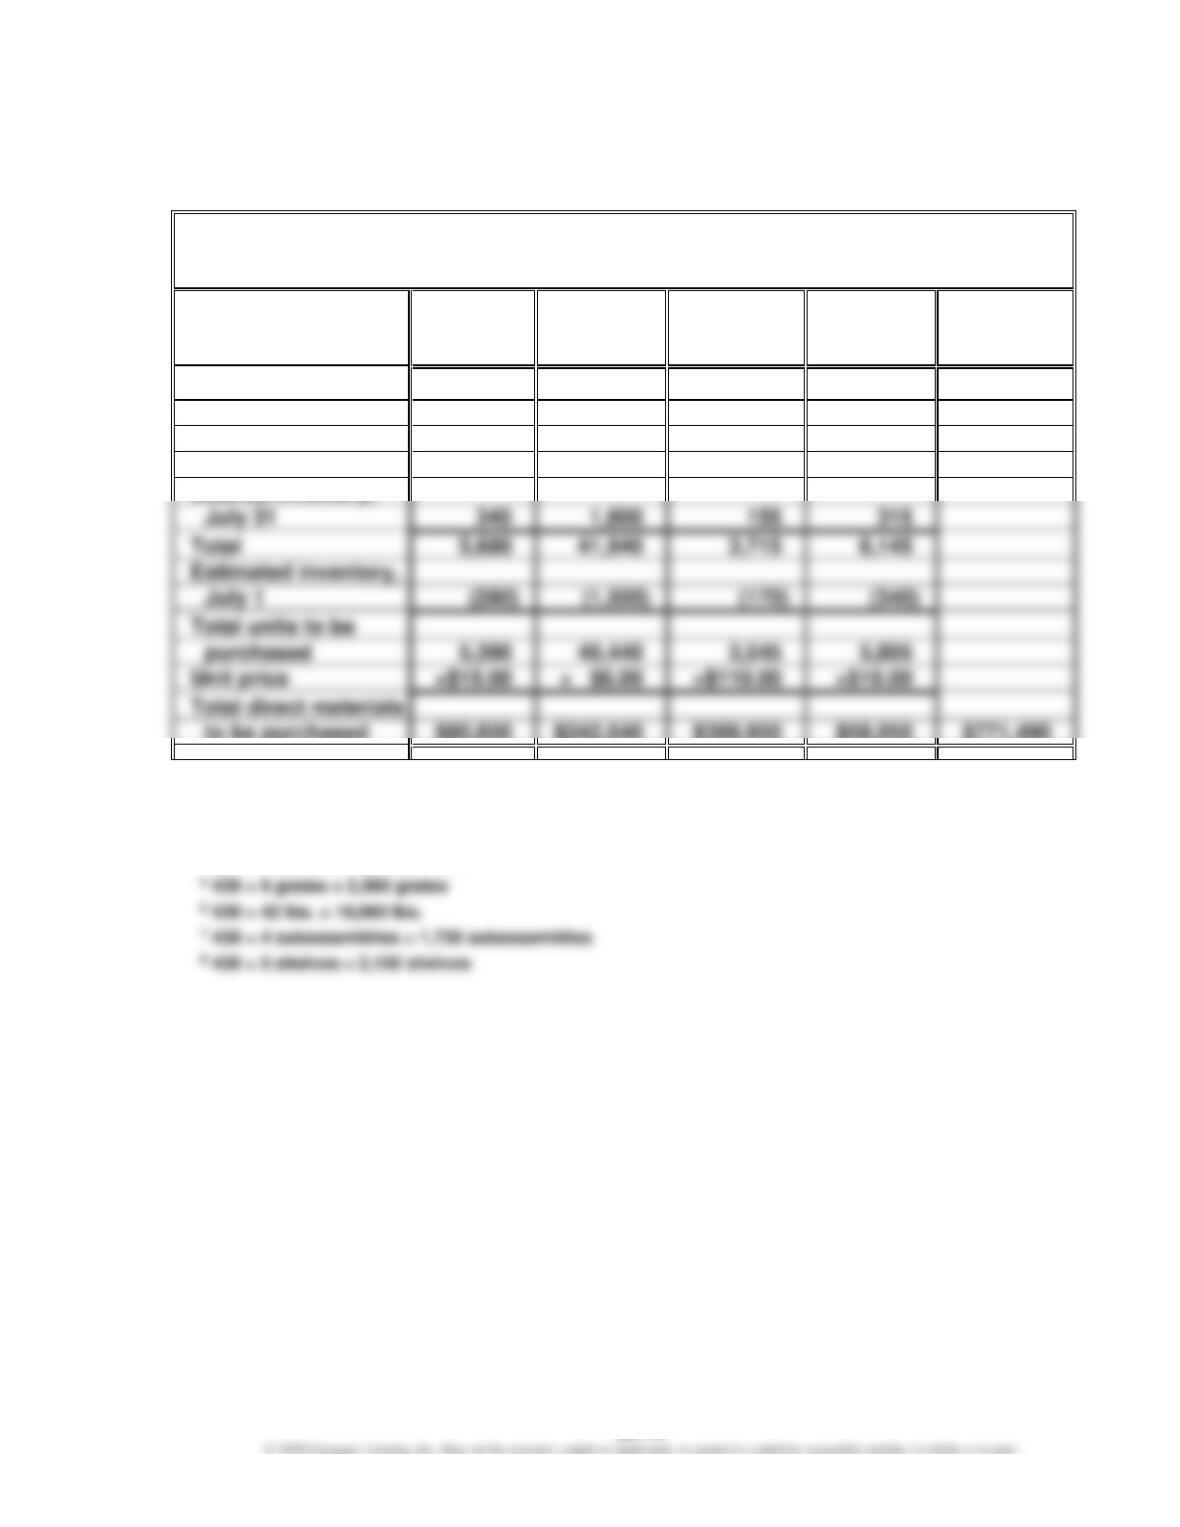
3.
Gourmet Grill Company
Direct Materials Purchases Budget
For the Month Ending July 31
Grates
(units)
Stainless
Steel
(lbs.)
Burner Sub-
assemblies
(units)
Shelves
(units)
Total
Required units for
production:
Backyard Chef
2,7601
22,0802
1,8403
3,6804
Master Chef
2,5805
18,0606
1,7207
2,1508
July 31
Estimated inventory,
purchased
Unit price
×$15.00
×$110.00
×$10.00
to be purchased
$80,850
$242,640
$389,950
$58,050
$771,490
1 920 × 3 grates = 2,760 grates
2 920 × 24 lbs. = 22,080 lbs.
3 920 × 2 subassemblies = 1,840 subassemblies
4 920 × 4 shelves = 3,680 shelves
CHAPTER 22 (FIN MAN); CHAPTER 8 (MAN) Budgeting
Prob. 22–2A (FIN MAN); Prob. 8–2A (MAN) (Concluded)
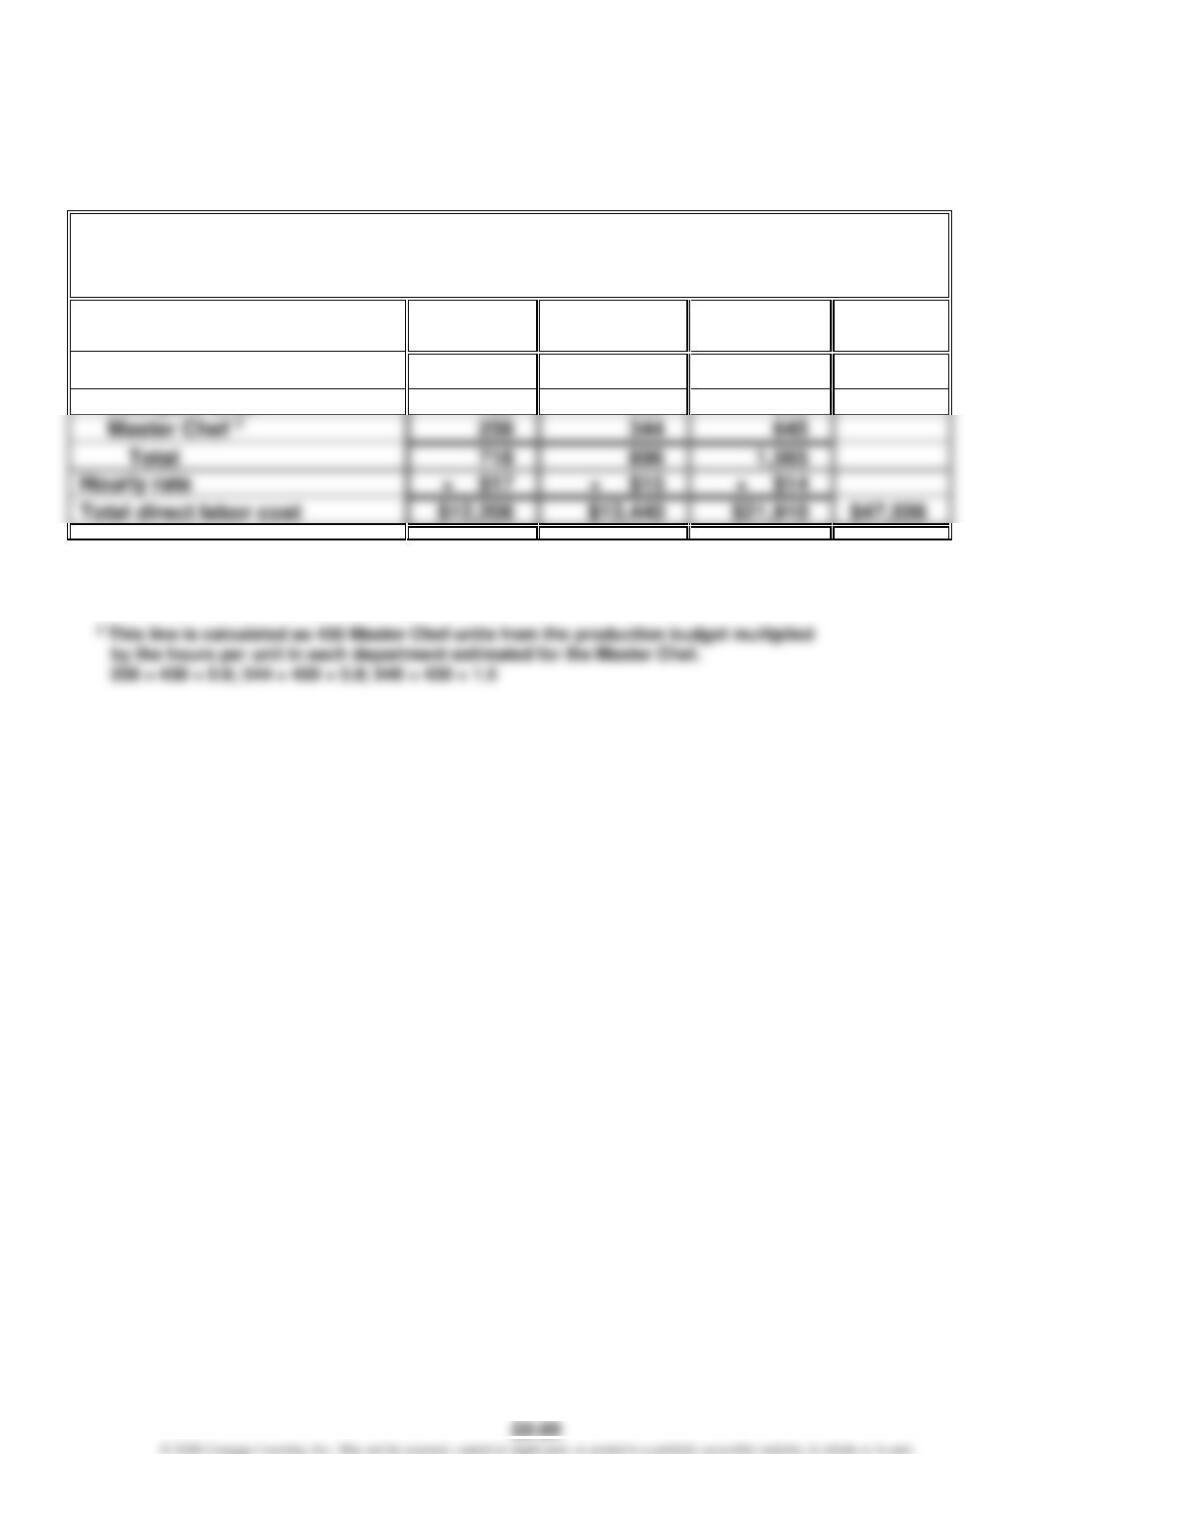
4.
Gourmet Grill Company
Direct Labor Cost Budget
For the Month Ending July 31
Stamping
Department
Forming
Department
Assembly
Department
Total
Hours required for production:
Backyard Chef 1
460
552
920
1 This line is calculated as 920 Backyard Chef units from the production budget multiplied
by the hours per unit in each department estimated for the Backyard Chef.
460 = 920 × 0.5; 552 = 920 × 0.6; 920 = 920 × 1.0