Chapter 8
Prospective Analysis: Valuation Implementation
Discussion Questions
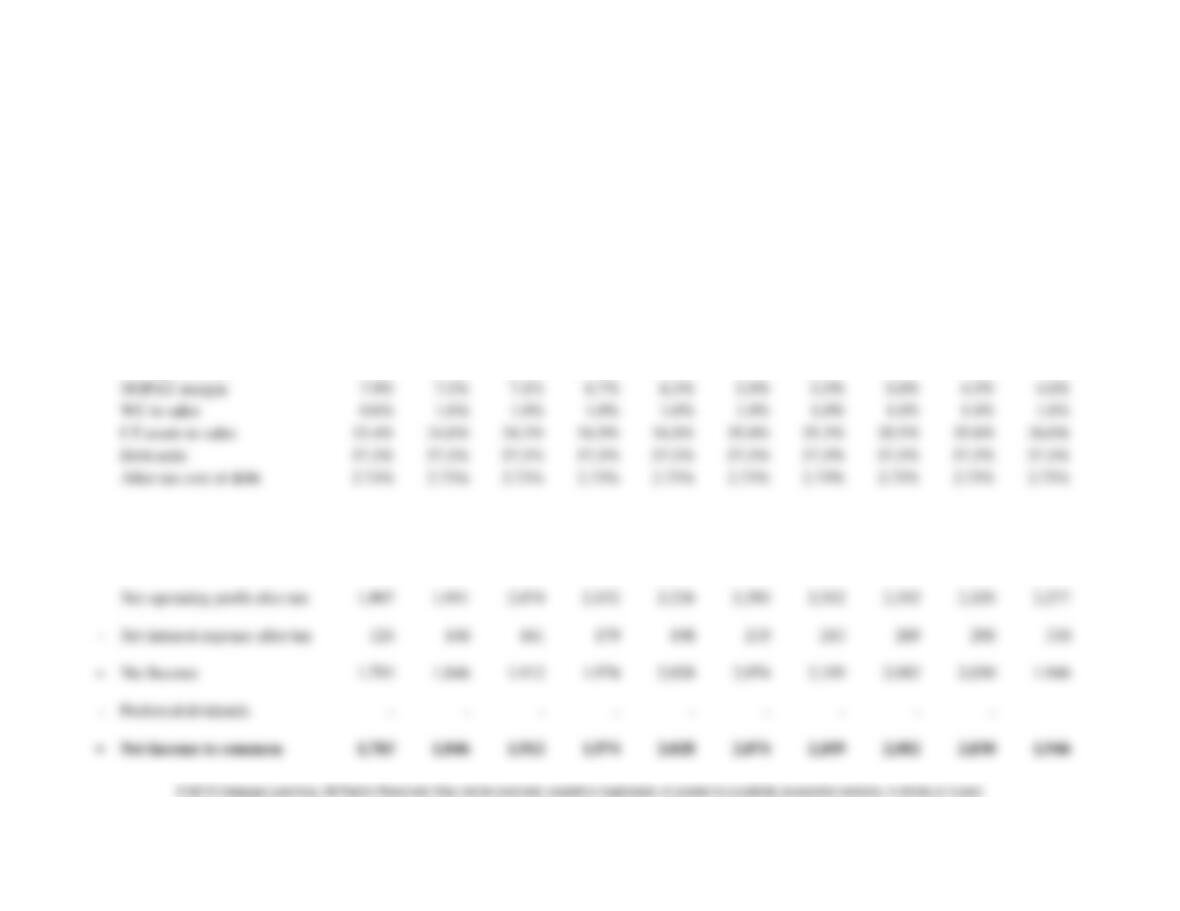
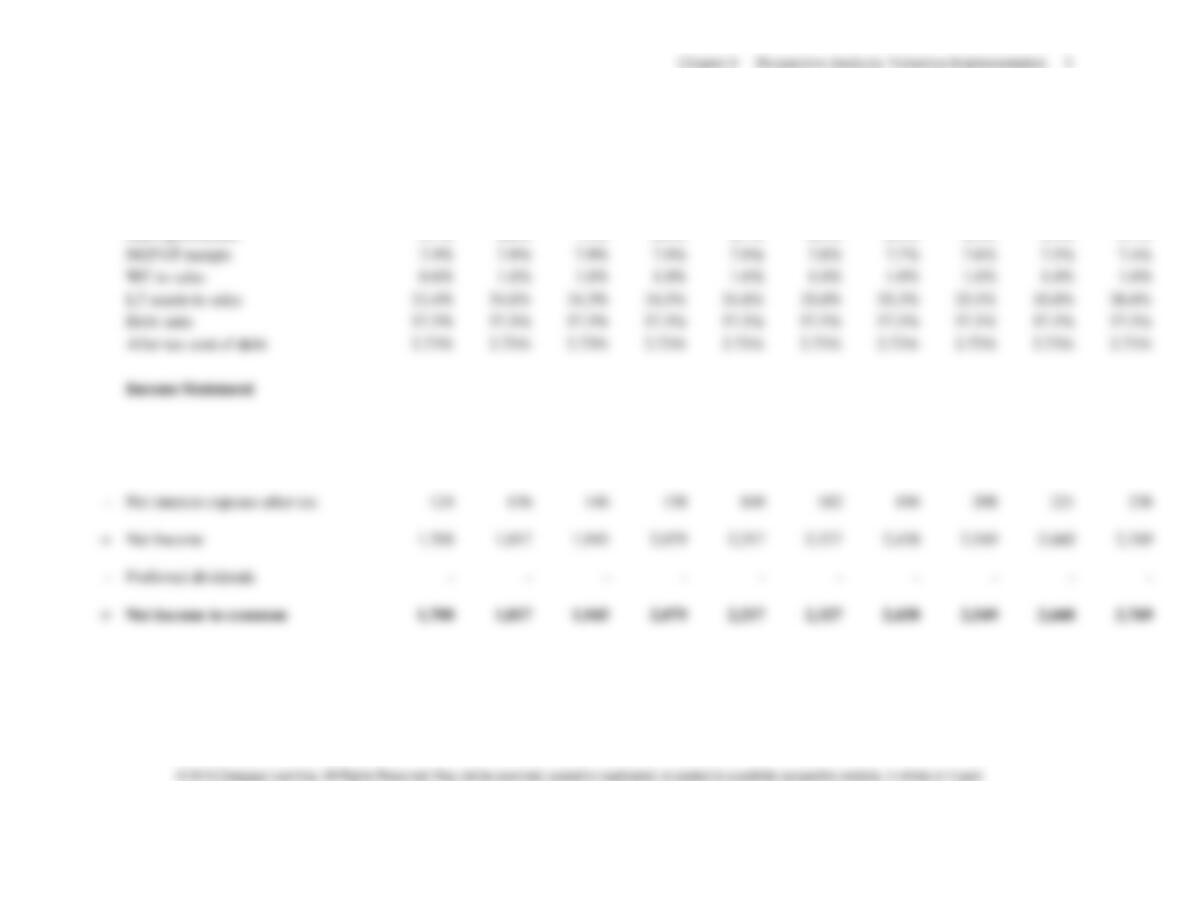
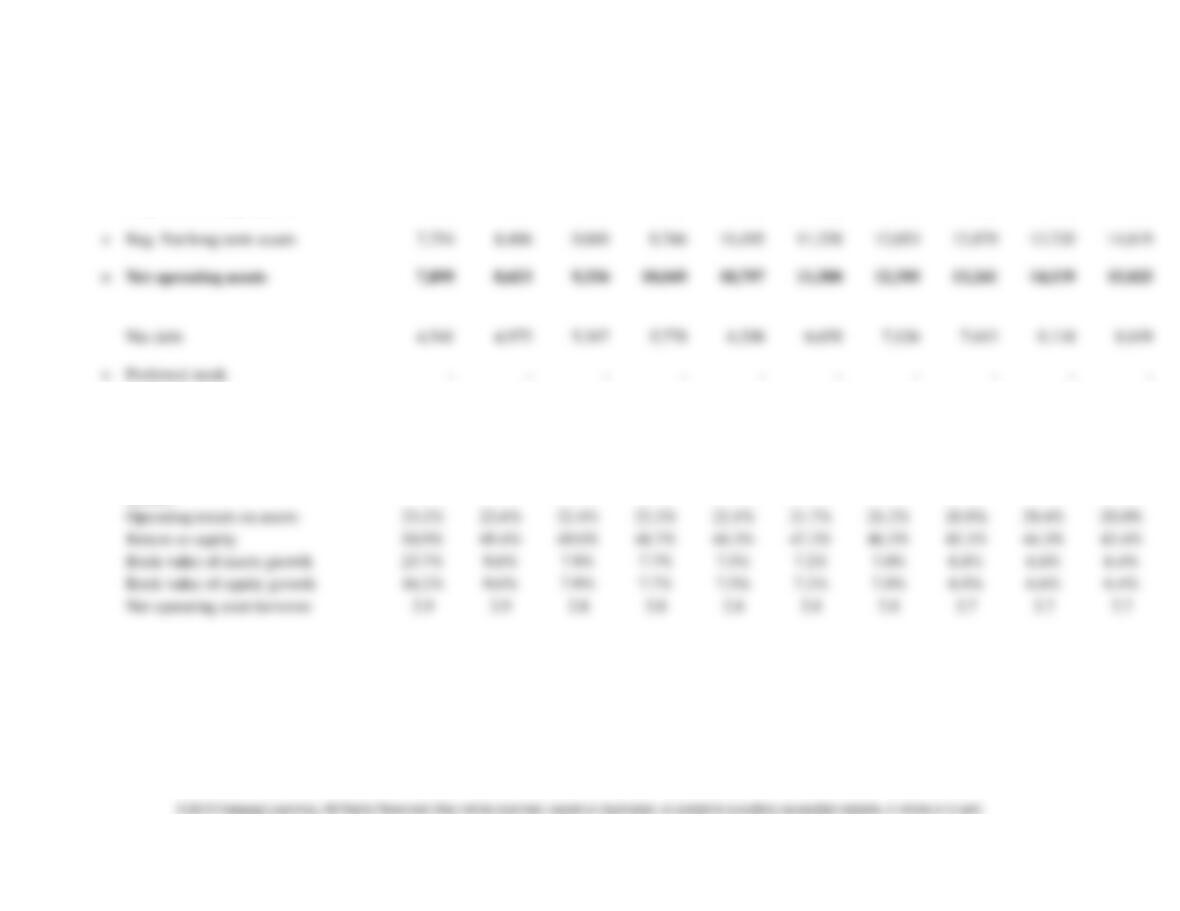
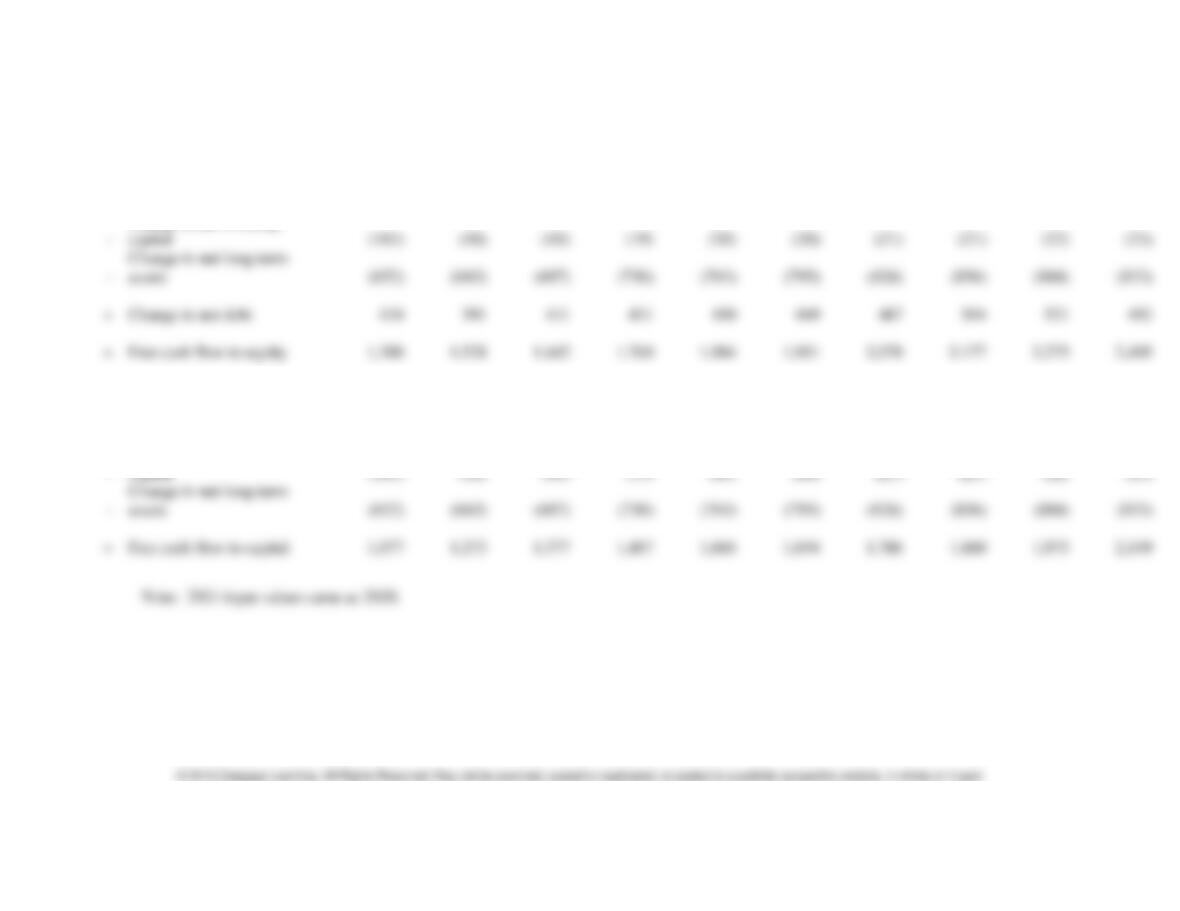
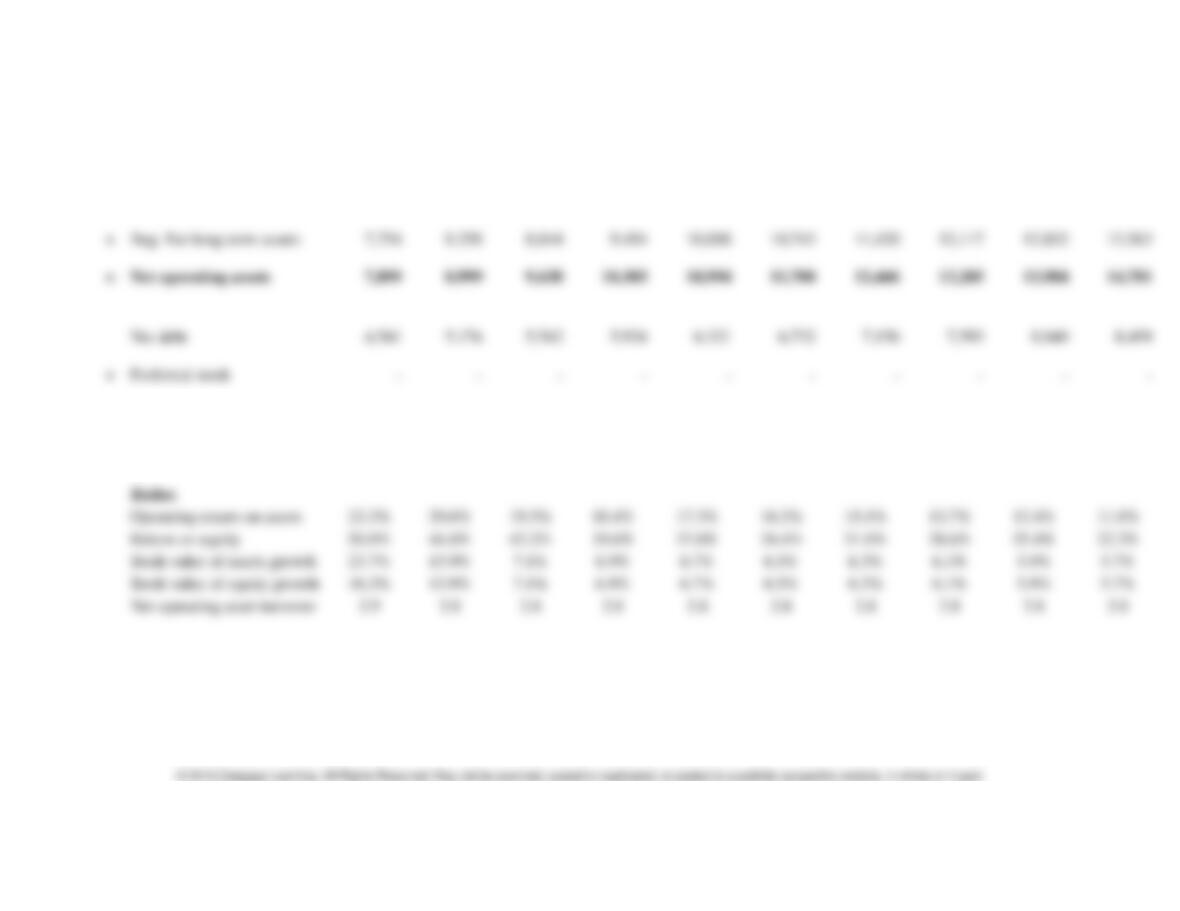
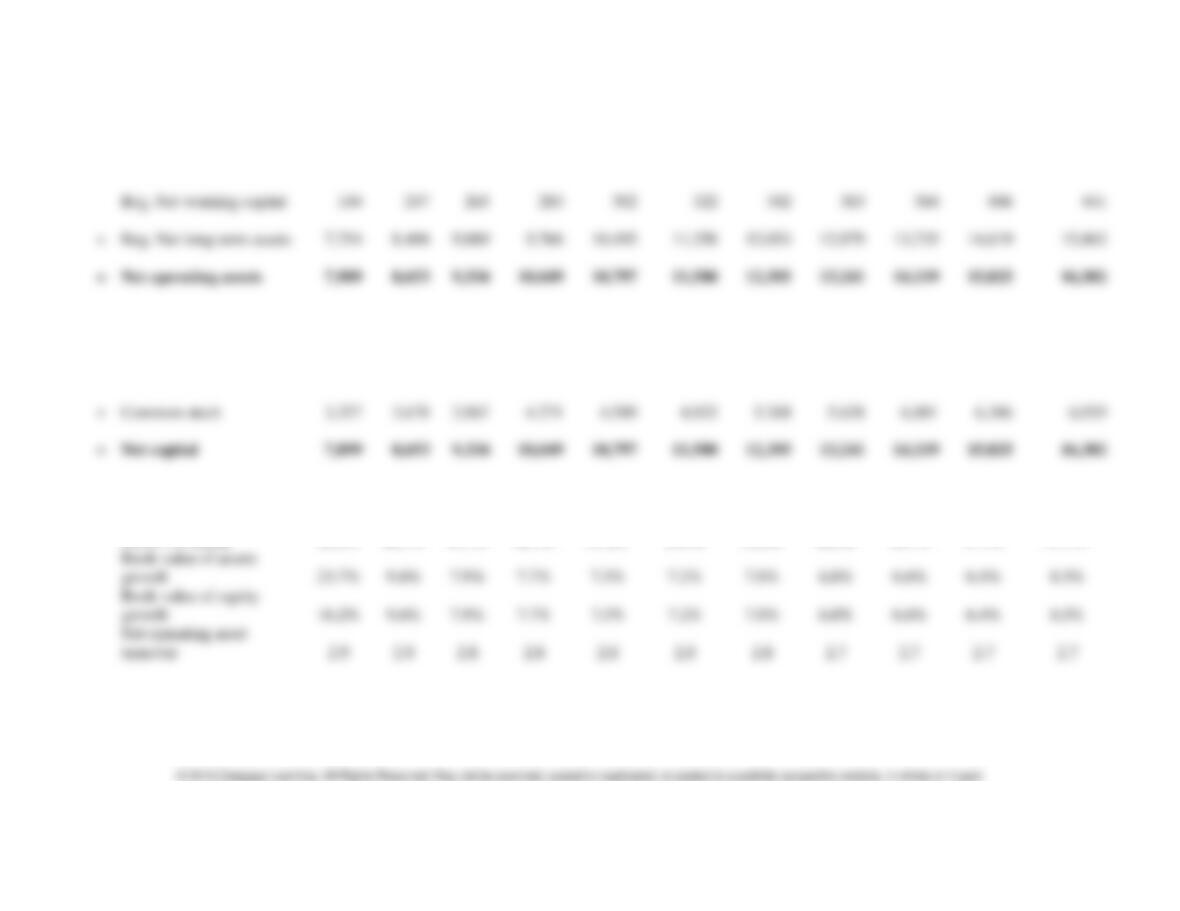
1. How would the forecasts in Table 8-2 change if TJX were to maintain a sales growth rate of 10 percent per year from 2011 to 2020 (and all
the other assumptions are kept unchanged)?
2011
2012
2013
2014
2015
2016
2017
2018
2019
2020
Sales growth rate
10.0%
10.0%
10.0%
10.0%
10.0%
10.0%
10.0%
10.0%
10.0%
10.0%
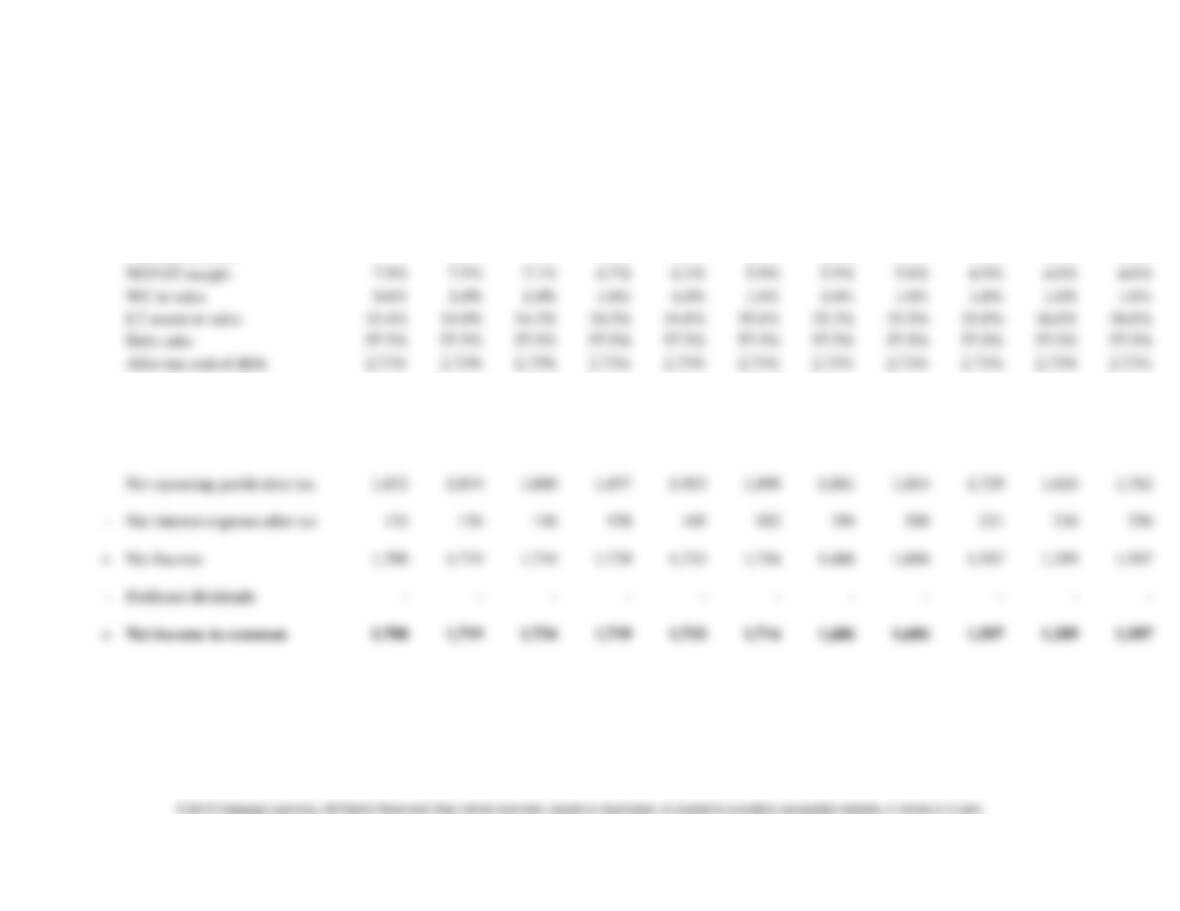
NOPAT margin
WC to sales
LT assets to sales
33.4%
34.0%
34.3%
34.5%
34.8%
35.0%
35.3%
35.5%
35.8%
36.0%
Debt ratio
57.5%
57.5%
57.5%
57.5%
57.5%
57.5%
57.5%
57.5%
57.5%
57.5%
After tax cost of debt
2.73%
2.73%
2.73%
2.73%
2.73%
2.73%
2.73%
2.73%
2.73%
2.73%
Income Statement
Sales
24,136
26,550
29,205
32,126
35,338
38,872
42,759
47,035
51,739
56,912
Net operating profit after tax
Net interest expense after tax
Net Income
Preferred dividends
Net income to common
2 Instructor’s Manual
Chapter 8 Prospective Analysis: Valuation Implementation 3
2011
2012
2013
2014
2015
2016
2017
2018
2019
2020
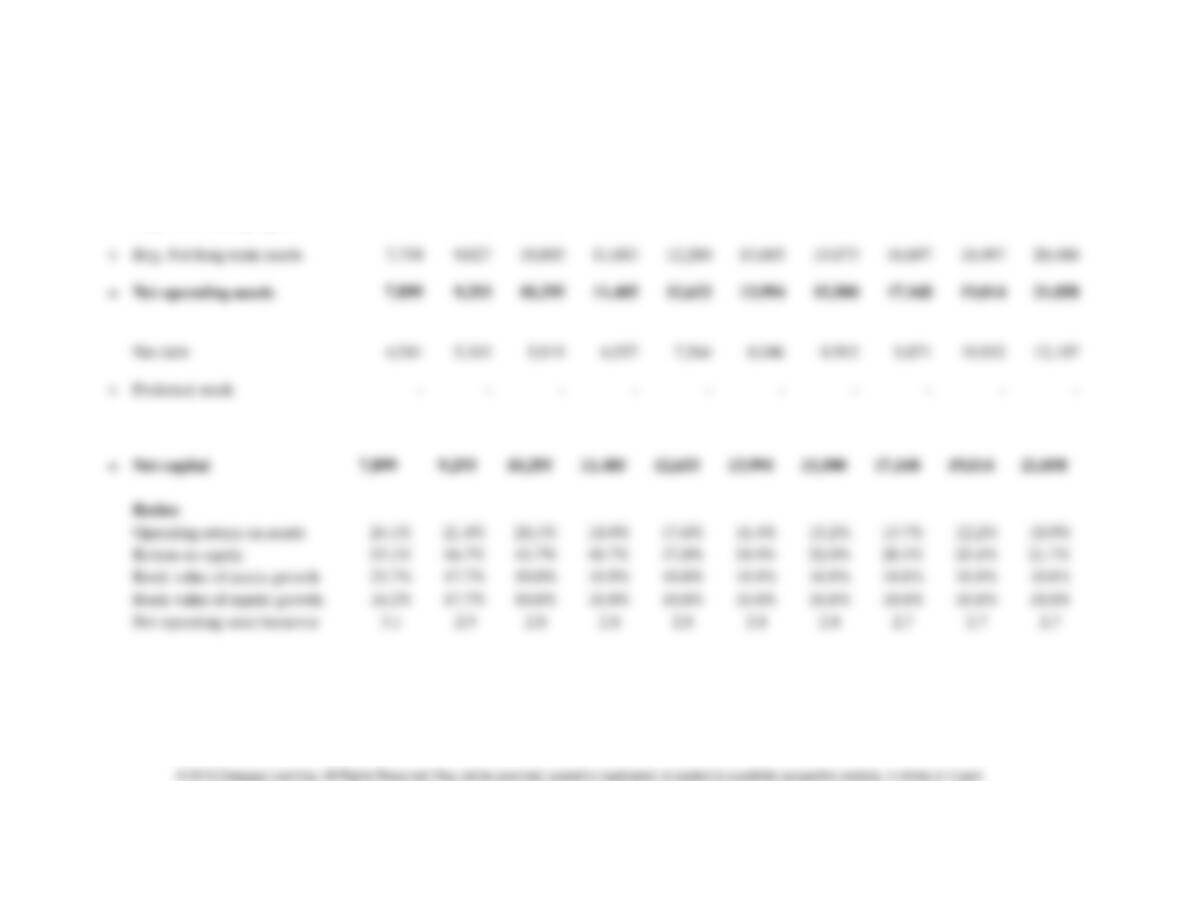
Beginning Balance
Sheet
Beg. Net working capital
144
266
292
321
353
389
428
470
517
569
Beg. Net long-term assets
Net debt
+
Preferred stock
+
Common stock
3,357
3,950
4,376
4,847
5,370
5,948
6,588
7,297
8,082
8,950
Net capital
7,899
9,293
10,295
11,405
12,633
13,994
15,500
17,168
19,014
21,058
Ratios
Operating return on assets
Return on equity
Book value of assets growth
Book value of equity growth
Net operating asset turnover
3.1
2.9
4 Instructor’s Manual
2011
2012
2013
2014
2015
2016
2017
2018
2019
2020
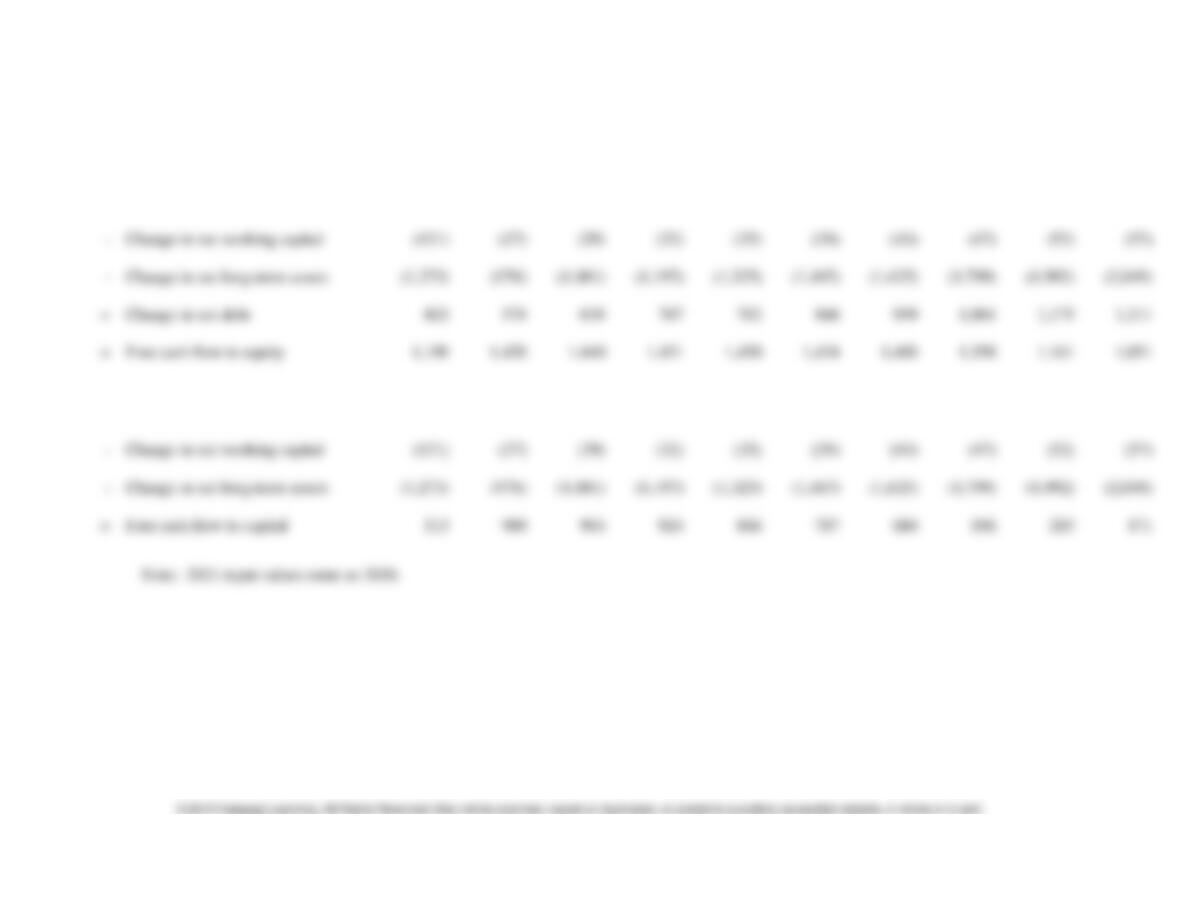
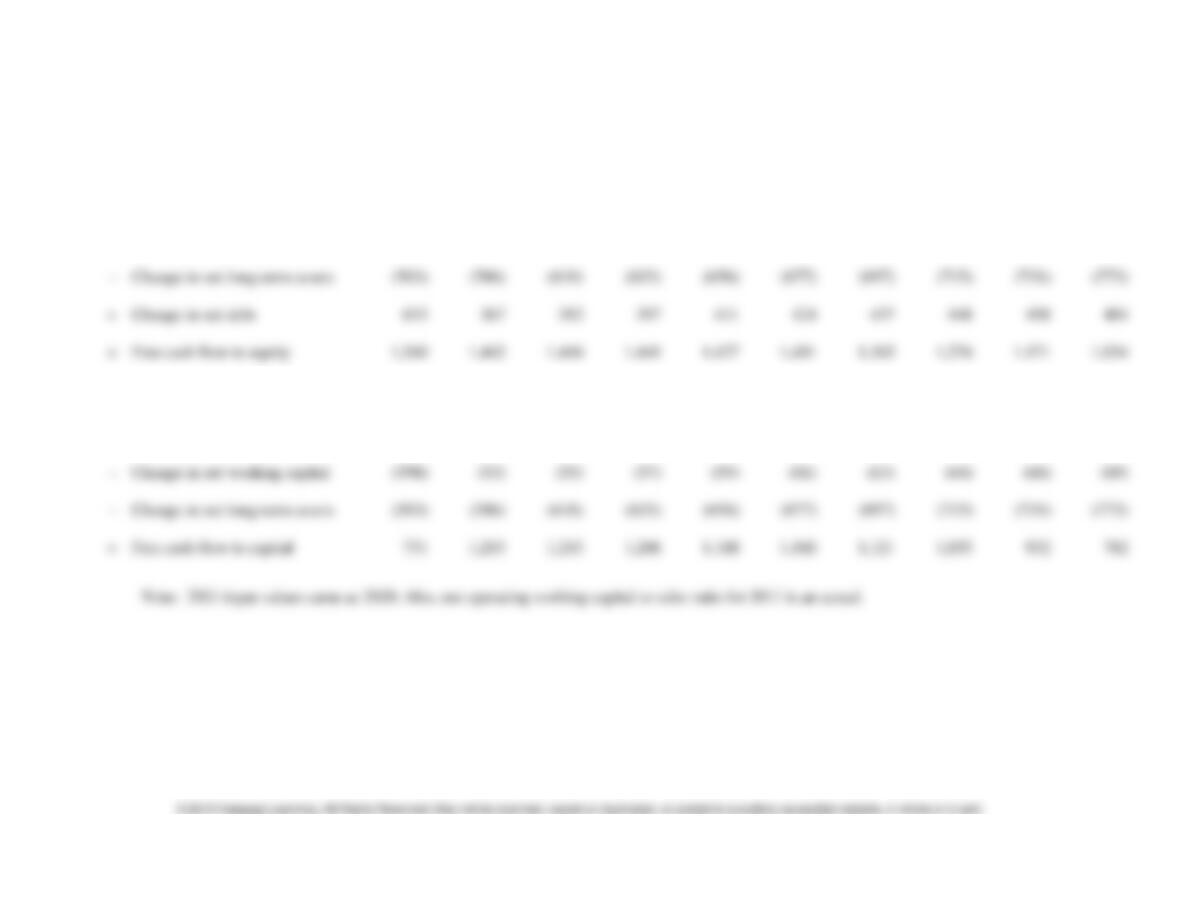
Cash flows
Net Income
1,783
1,846
1,912
1,974
2,028
2,074
2,109
2,082
2,030
1,946
Change in net working capital
Change in net debt
Free cash flow to equity
Net operating profit after tax
1,907
1,991
2,074
2,152
2,226
2,293
2,352
2,352
2,328
2,277
Change in net working capital
Change in net long-term assets
(1,273)
(1,081)
(1,197)
(1,325)
(1,467)
(1,625)
(1,799)
(1,992)
(2,049)
Free cash flow to capital
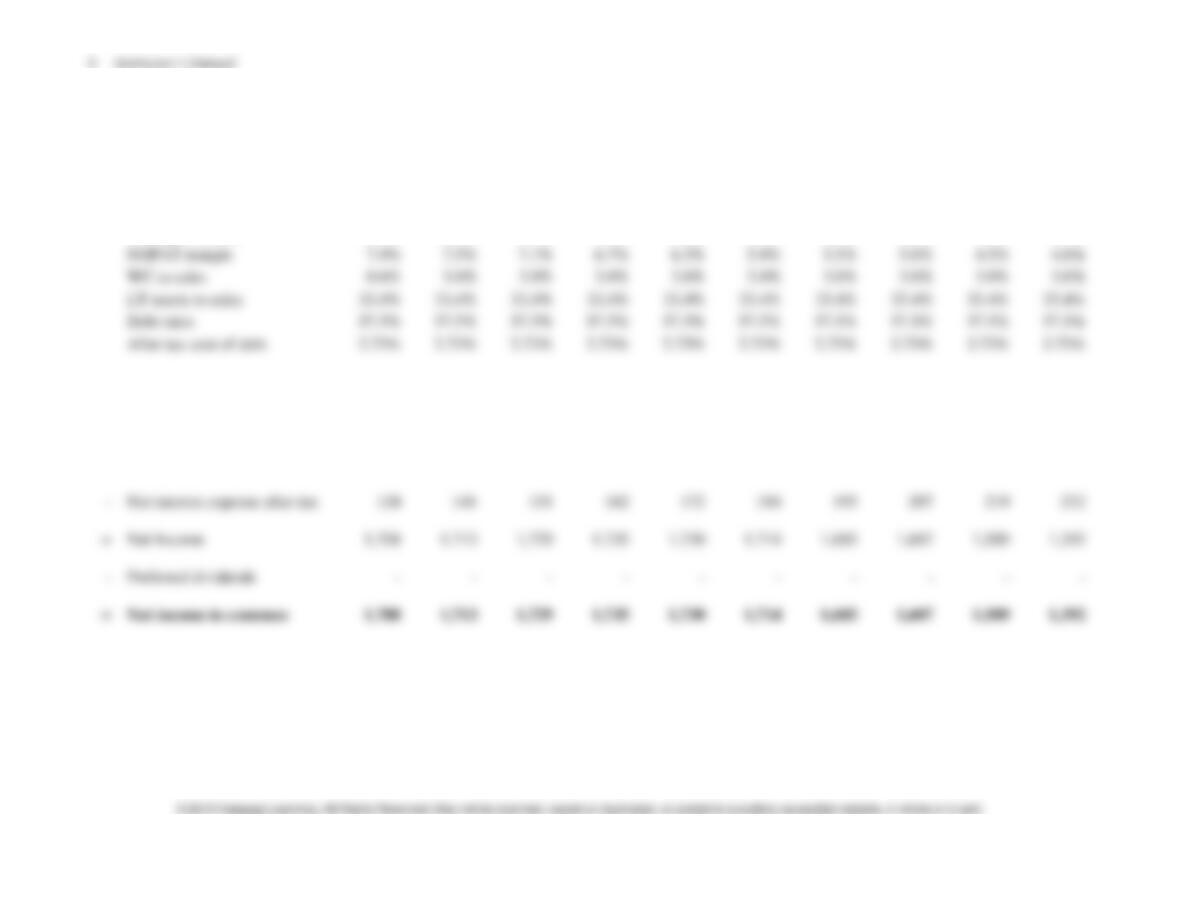
2. Recalculate the forecasts in Table 8-2 assuming that the NOPAT profit margin is held steady for the first five years of the forecast and then
declines by 0.1 percentage points per year thereafter (keeping all the other assumptions unchanged).
2011
2012
2013
2014
2015
2016
2017
2018
2019
2020
Sales growth rate
5.7%
6.6%
7.1%
6.9%
6.7%
6.5%
6.3%
6.1%
5.9%
5.7%
NOPAT margin
7.9%
7.9%
7.9%
7.9%
7.9%
7.8%
7.7%
7.6%
7.5%
7.4%
LT assets to sales
Debt ratio
After tax cost of debt
Sales
23,193
24,724
26,479
28,306
30,203
32,166
34,192
36,278
38,418
40,608
Net operating profit after tax
1,832
1,953
2,092
2,236
2,386
2,509
2,633
2,757
2,881
3,005
Preferred dividends
6 Instructor’s Manual
2011
2012
2013
2014
2015
2016
2017
2018
2019
2020
Beginning Balance Sheet
Beg. Net working capital
144
247
265
283
302
322
342
363
384
406
+
Beg. Net long-term assets
7,754
8,406
9,069
9,766
Net debt
Preferred stock
+
Common stock
3,357
3,678
3,967
4,271
4,589
4,922
5,268
5,628
6,001
6,386
=
Net capital
7,899
8,653
9,334
10,049
10,797
11,580
12,395
13,241
14,119
15,025
Ratios
Operating return on assets
Return on equity
Book value of assets growth
9.6%
7.9%
7.7%
7.5%
7.2%
7.0%
6.8%
6.6%
6.4%
Book value of equity growth
9.6%
7.9%
7.7%
7.5%
7.2%
7.0%
6.8%
6.6%
6.4%
Net operating asset turnover
Chapter 8 Prospective Analysis: Valuation Implementation 7
2011
2012
2013
2014
2015
2016
2017
2018
2019
2020
Cash flows
Net Income
1,708
1,817
1,945
2,079
2,217
2,327
2,438
2,549
2,660
2,769
capital
Change in net debt
Free cash flow to equity
Change in net working
Net operating profit after tax
1,832
1,953
2,092
2,236
2,386
2,509
2,633
2,757
2,881
3,005
capital
Change in net long-term
assets
Free cash flow to capital
Change in net working
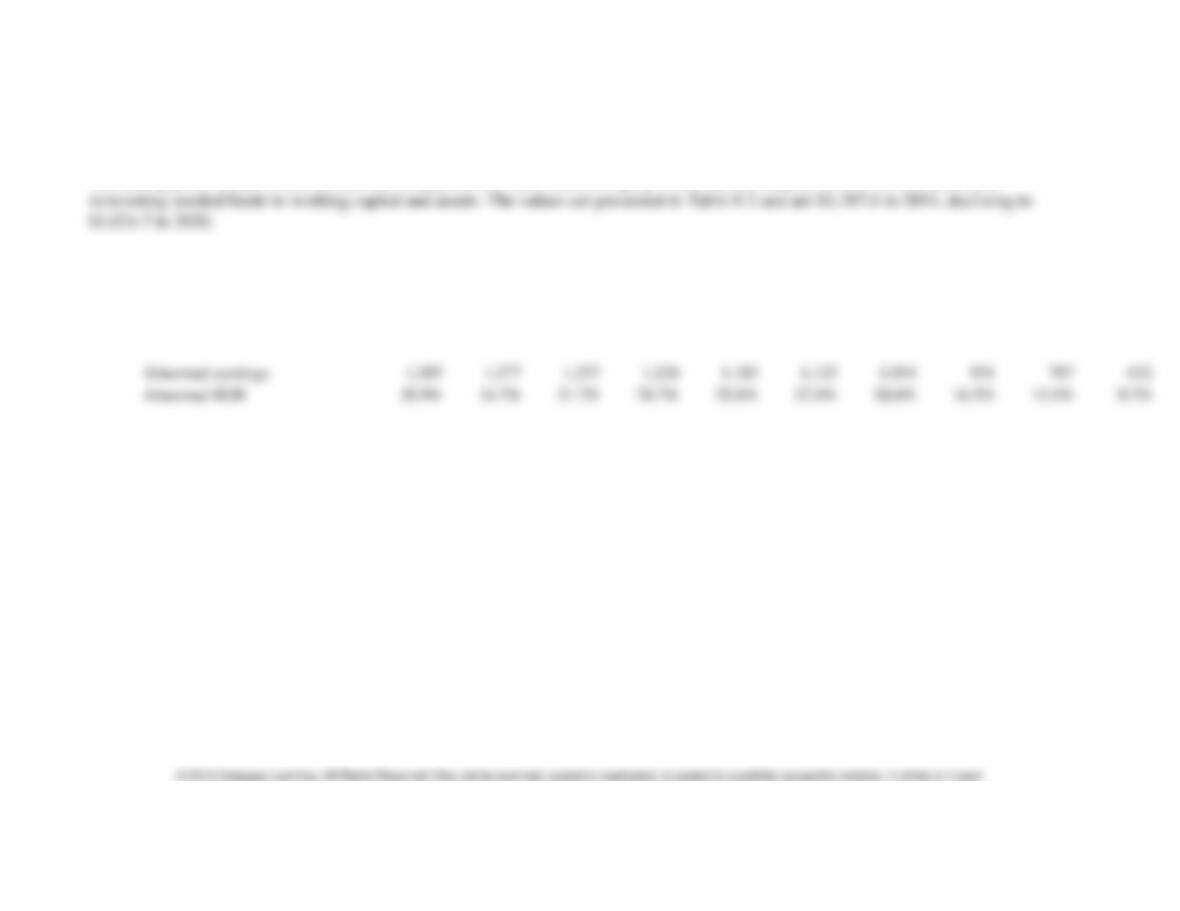
3. Recalculate the forecasts in Tables 8-2 assuming that the ratio of net operating working capital to sales is 3 percent, and the ratio of net long–
term assets to sales holds steady at 33.4 percent for all the years from fiscal 2011 to fiscal 2020. Keep all the other assumptions unchanged.
2011
2012
2013
2014
2015
2016
2017
2018
2019
2020
Sales growth rate
5.7%
6.6%
7.1%
6.9%
6.7%
6.5%
6.3%
6.1%
5.9%
5.7%
NOPAT margin
7.9%
7.5%
7.1%
6.7%
6.3%
5.9%
5.5%
5.0%
4.5%
4.0%
Debt ratio
After tax cost of debt
Income Statement
Sales
23,193
24,724
26,479
28,306
30,203
32,166
34,192
36,278
38,418
40,608
Net operating profit after tax
1,832
1,854
1,880
1,897
1,903
1,899
1,881
1,814
1,729
1,624
Preferred dividends
Net income to common
Chapter 8 Prospective Analysis: Valuation Implementation 9
2011
2012
2013
2014
2015
2016
2017
2018
2019
2020
Beginning Balance Sheet
Beg. Net working capital
144.1
742
794
849
906
965
1,026
1,088
1,153
1,218
+
Beg. Net long-term assets
7,754
8,258
8,844
9,454
+
Common stock
3,357
3,825
4,097
4,379
4,673
4,976
5,290
5,613
5,944
6,283
=
Net capital
7,899
8,999
9,638
10,303
10,994
11,708
12,446
13,205
13,984
14,781
Ratios
Operating return on assets
Return on equity
Book value of assets growth
Book value of equity growth
Net operating asset turnover
10 Instructor’s Manual
Cash flows
2011
2012
2013
2014
2015
2016
2017
2018
2019
2020
Net Income
1,708
1,713
1,729
1,735
1,730
1,714
1,685
1,607
1,509
1,392
–
Change in net working capital
(598)
(53)
(55)
(57)
(59)
(61)
(63)
(64)
(66)
(69)
Change in net debt
633
Free cash flow to equity
2011
2012
2013
2014
2015
2016
2017
2018
2019
2020
Net operating profit after tax
1,832
1,854
1,880
1,897
1,903
1,899
1,881
1,814
1,729
1,624
–
Change in net working capital
(598)
(53)
(55)
(57)
(59)
(61)
(63)
(64)
(66)
(69)
–
Change in net long-term assets
(503)
(586)
(610)
(633)
(656)
(677)
(697)
(715)
(731)
(773)
Free cash flow to capital
Chapter 8 Prospective Analysis: Valuation Implementation 11
4. Calculate TJX’s cash payouts to its shareholders in the years 2011–2020 that are implicitly assumed in the projections in Table 8-2.
The cash payouts made to shareholders are simply the free cash flows to equity. These are the surplus cash flows available after
5. How would the abnormal earnings calculations in Table 8-3 change if the cost of equity assumption is changed to 12%?
2011
2012
2013
2014
2015
2016
2017
2018
2019
2020
Equity Valuation
Abnormal earnings
Abnormal ROE
12 Instructor’s Manual
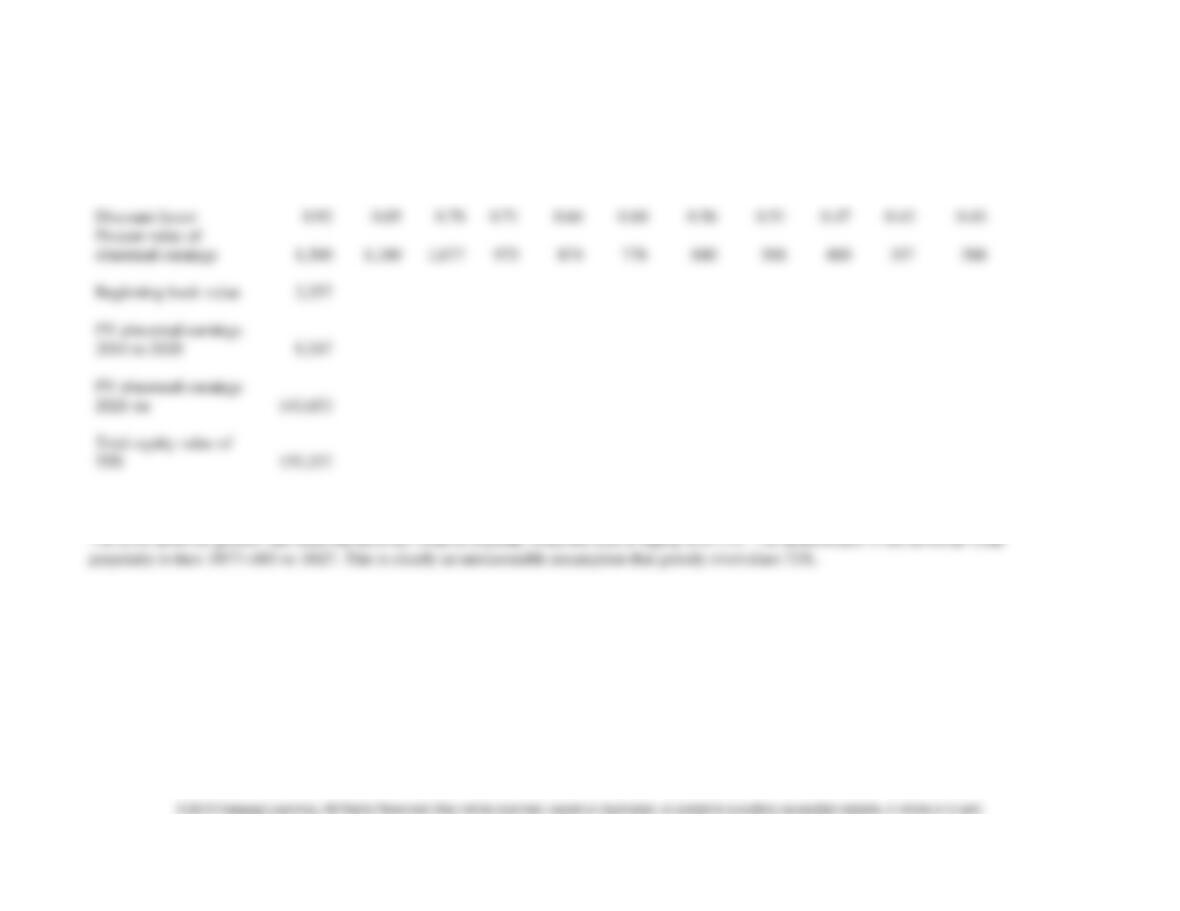
6. What would be the total equity value (as calculated for scenarios in Table 8-6 using abnormal earnings) if the sales growth in years 2021 and
beyond is 8.5 percent and the company is able to generate abnormal returns at the same level as in fiscal 2020 forever (keeping all the other
assumptions in the table unchanged)?
2011
2012
2013
2014
2015
2016
2017
2018
2019
2020
2021
Sales growth rate
5.7%
6.6%
7.1%
6.9%
6.7%
6.5%
6.3%
6.1%
5.9%
5.7%
8.5%
WC to sales
0.6%
1.0%
1.0%
1.0%
1.0%
1.0%
1.0%
1.0%
1.0%
1.0%
1.0%
LT assets to sales
Debt ratio
After tax cost of debt
Income Statement
Sales
23,193
24,724
26,479
28,306
30,203
32,166
34,192
36,278
38,418
40,608
44,060
Net operating profit after tax
Net interest expense after tax
Net Income
1,507
Preferred dividends
Net income to common
1,507
Chapter 8 Prospective Analysis: Valuation Implementation 13
2011
2012
2013
2014
2015
2016
2017
2018
2019
2020
2021
Beginning Balance Sheet
Beg. Net working capital
441
Beg. Net long-term assets
7,754
9,069
11,258
Net debt
4,541
4,975
5,367
5,778
6,208
6,658
7,126
7,613
8,118
8,639
9,373
+
Preferred stock
–
–
–
–
–
–
–
–
–
–
–
Common stock
3,357
3,967
Net capital
7,899
Ratios
Operating return on assets
23.2%
21.4%
20.1%
18.9%
17.6%
16.4%
15.2%
13.7%
12.2%
10.8%
10.8%
Return on equity
50.9%
46.7%
43.7%
40.7%
37.8%
34.9%
32.0%
28.5%
25.1%
21.7%
21.7%
growth
23.7%
growth
turnover
2.7
14 Instructor’s Manual
Valuation
2011
2012
2013
2014
2015
2016
2017
2018
2019
2020
2021
Abnormal earnings
1,414
1,396
1,386
1,364
1,331
1,285
1,224
1,113
981
829
899
Discount factor
2021 on
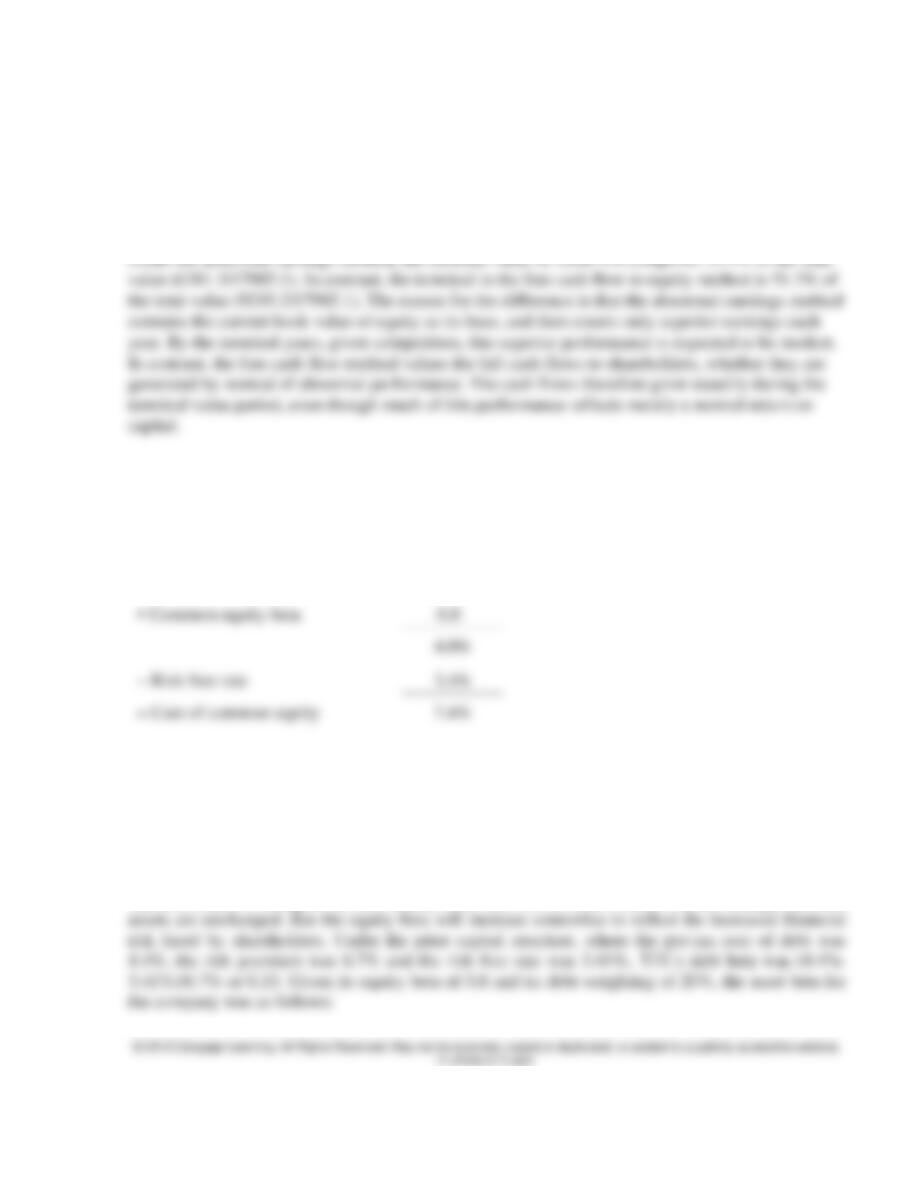
7. Calculate the proportion of terminal value to total estimated value of equity under the
abnormal earnings method and the discounted cash flow method for the Scenario 2 results
shown in Table 8-6. Why are these proportions different?
8. What will TJX’s cost of equity be if the equity market risk premium is 5 percent?
Market risk premium
5.0%
4.0%
3.4%
= Cost of common equity
7.4%
9. Assume that TJX changes its capital structure so that its market value weight of debt to
capital increases to 30%, and its after-tax interest rate on debt at this new leverage level is 3.5%.
Assume that the equity market risk premium is 6.7%. What will be the cost of equity at the new
debt level? What will be the new weighted average cost of capital?
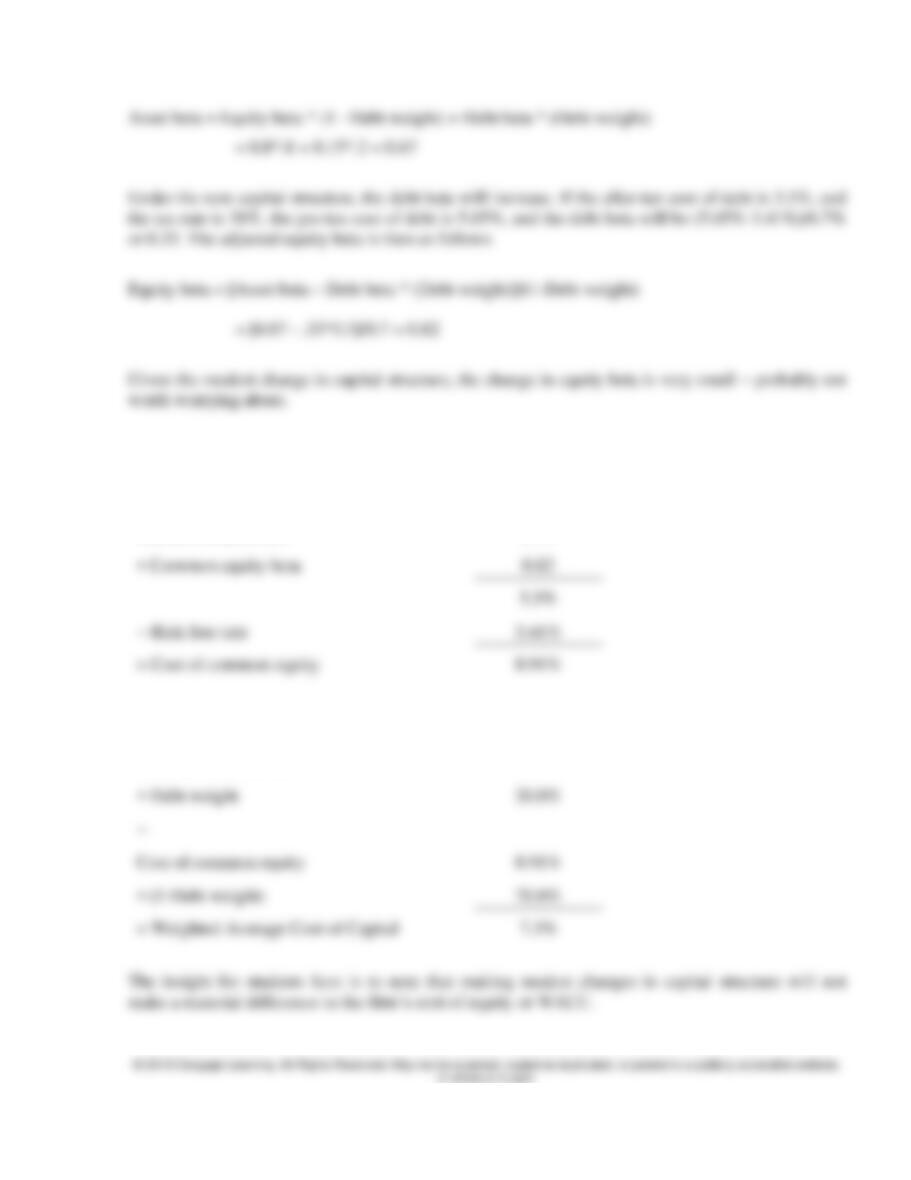
The first task is to compute the new equity beta. The beta of TJX’s assets will not change, since its
16 Instructor’s Manual
The revised cost of equity and WACC will then be as follows:
Cost of Equity
Market risk premium
6.7%
5.5%
= Cost of common equity
Weighted Average Cost of Capital
After tax cost of debt
3.5%
Cost of common equity
= Weighted Average Cost of Capital
7.3%
Chapter 8 Prospective Analysis: Valuation Implementation 17
10. Nancy Smith says she is uncomfortable making the assumption that TJX’s dividend payout
will vary from year to year. If she makes a constant dividend payout assumption, what changes
does she have to make in her other valuation assumptions to make them internally consistent
with each other?
If Nancy Smith doesn’t want to allow dividend payout to vary across the years, then she can hold