Financial Accounting, 10/e 7-41
P7–7.
(dollars in thousands)
Req. 1
Projected
change
No change from
beginning of year
Req. 2
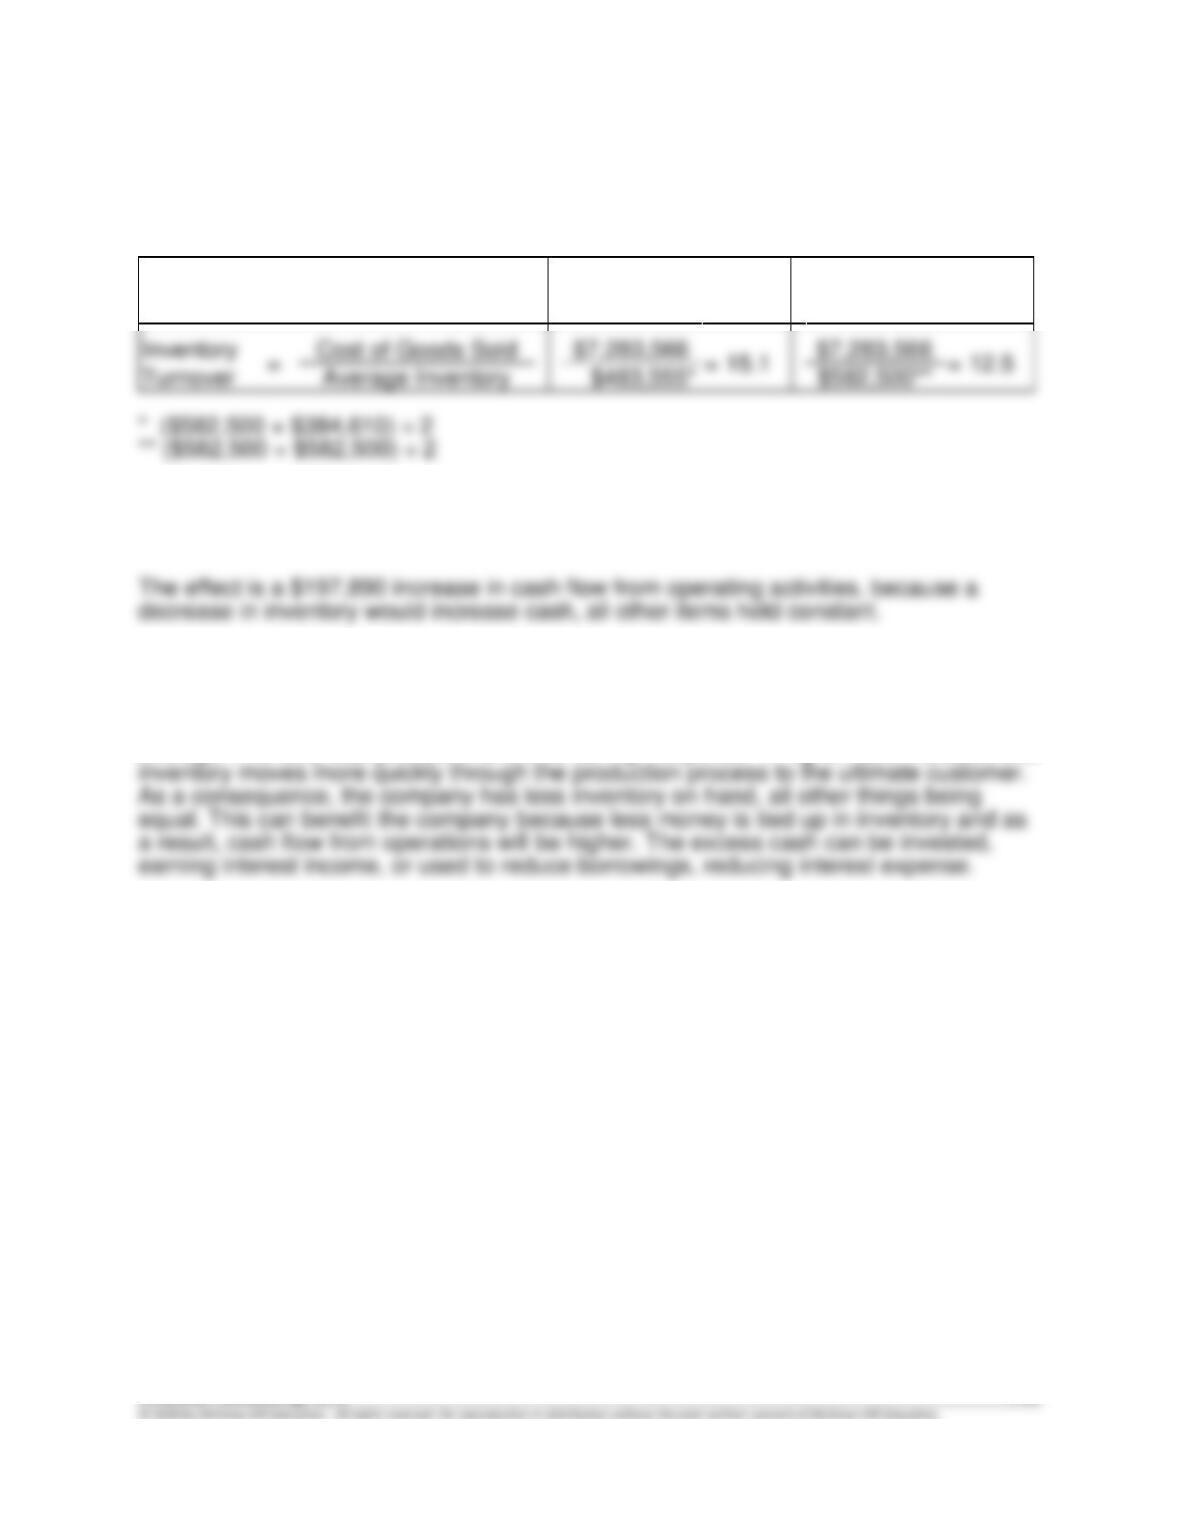
Projected decrease in inventory = $582,500– $384,610= $197,890
Req. 3
An increase in the inventory turnover ratio indicates an increase in the number of times
average inventory was produced and sold during the period. A higher ratio indicates that
P7–8.
(dollars in millions)
Req. 1
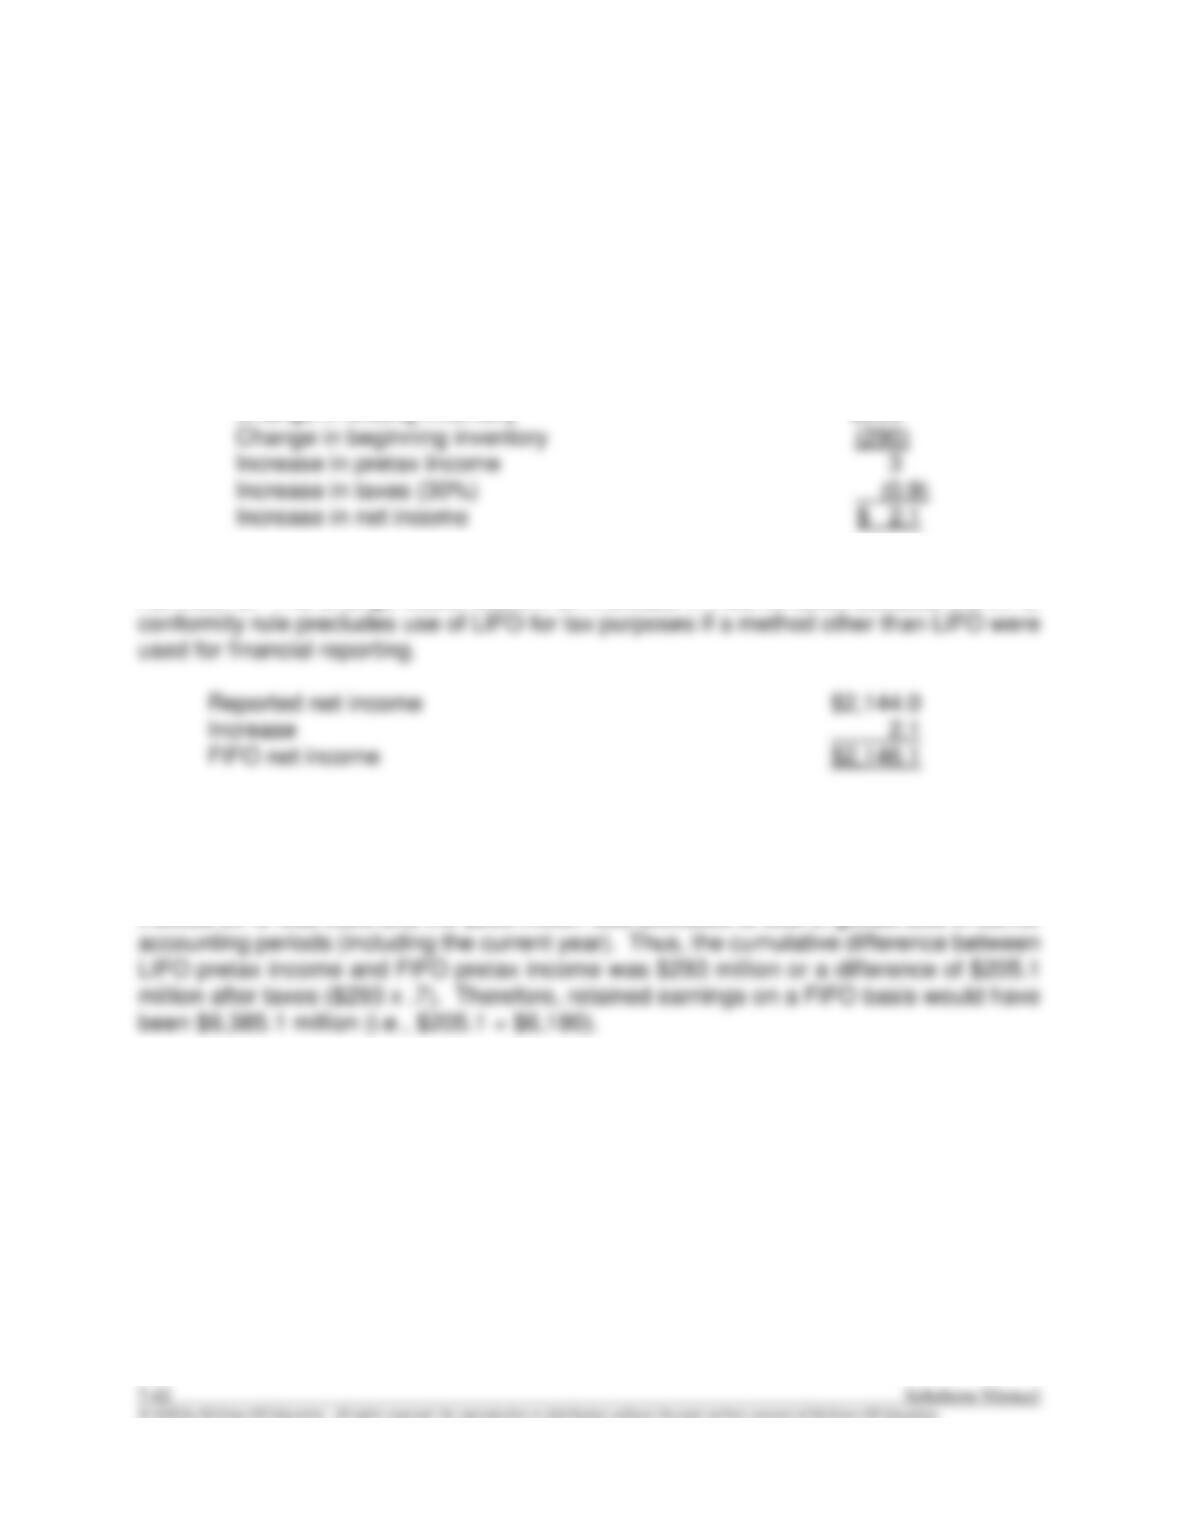
A change that increases beginning inventory will decrease net income while a change
that increases ending inventory will increase net income.
Impact on International Paper’s Net
Income (in millions)
Change in ending inventory $293
Use of FIFO would result in an increase of $2.1 million in International Paper’s reported
net income. The change would result in an increase in income taxes because the LIFO
Req. 2
If FIFO had been used, the ending inventory would have been $293 million higher.
Instead LIFO was used and the $293 million was allocated to cost of goods sold in earlier
Req. 3
The reduction in taxes (compared to FIFO) was $0.9 million (calculated in Req. 1).
P7–9.
Req. 1
2016 2017 2018 2019
Sales revenue $2,025,000 $2,450,000 $2,700,000 $2,975,000
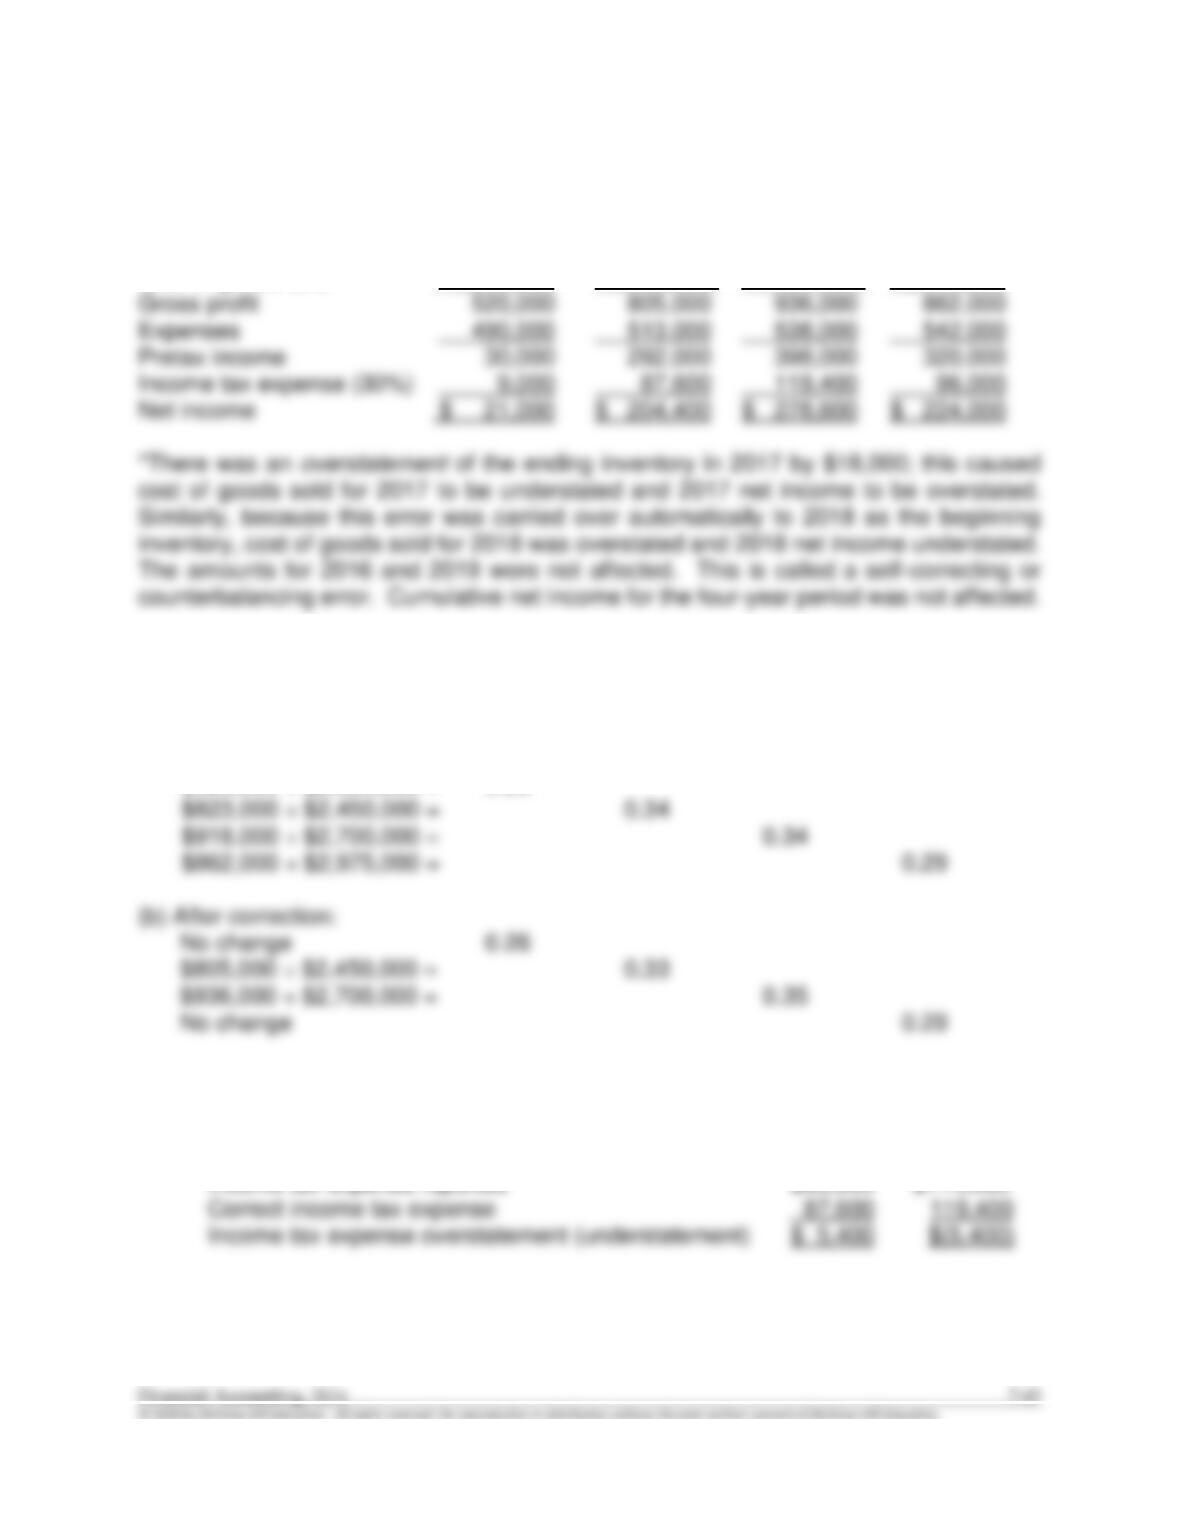
Cost of goods sold 1,505,000 1,645,000* 1,764,000* 2,113,000
Req. 2
2016 2017 2018 2019
Gross profit ratio (gross profit ÷ sales):
(a) Before correction:
$520,000 ÷ $2,025,000 = 0.26
Req. 3
The effect of the error on income tax expense was:
2017 2018
Income tax expense reported $93,000 $114,000
P7–10. (Supplement A)
(dollars in millions)
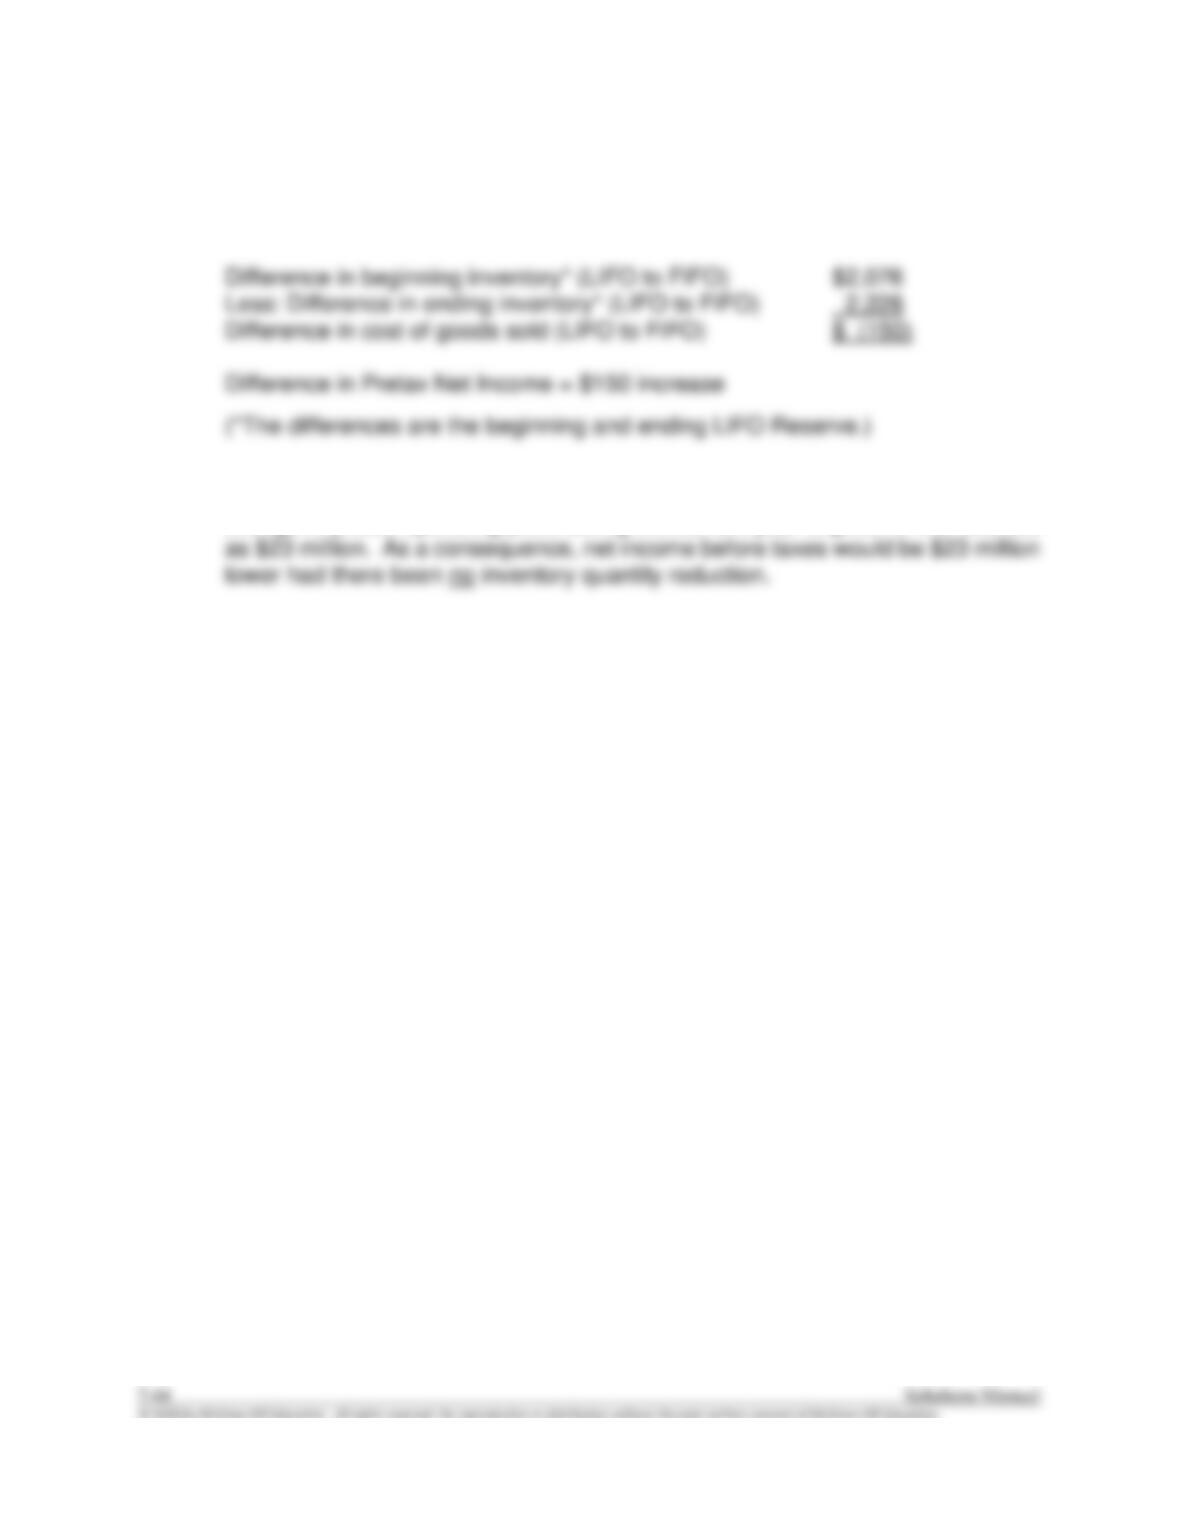
Req. 1 Pretax operating profit (loss) for the current year had FIFO accounting been
employed instead of LIFO.
Req. 2 Since prices are rising, LIFO liquidations increase net income before taxes. The
change in pretax operating profit during the current year is given in the footnote
ALTERNATE PROBLEMS
AP7−1.
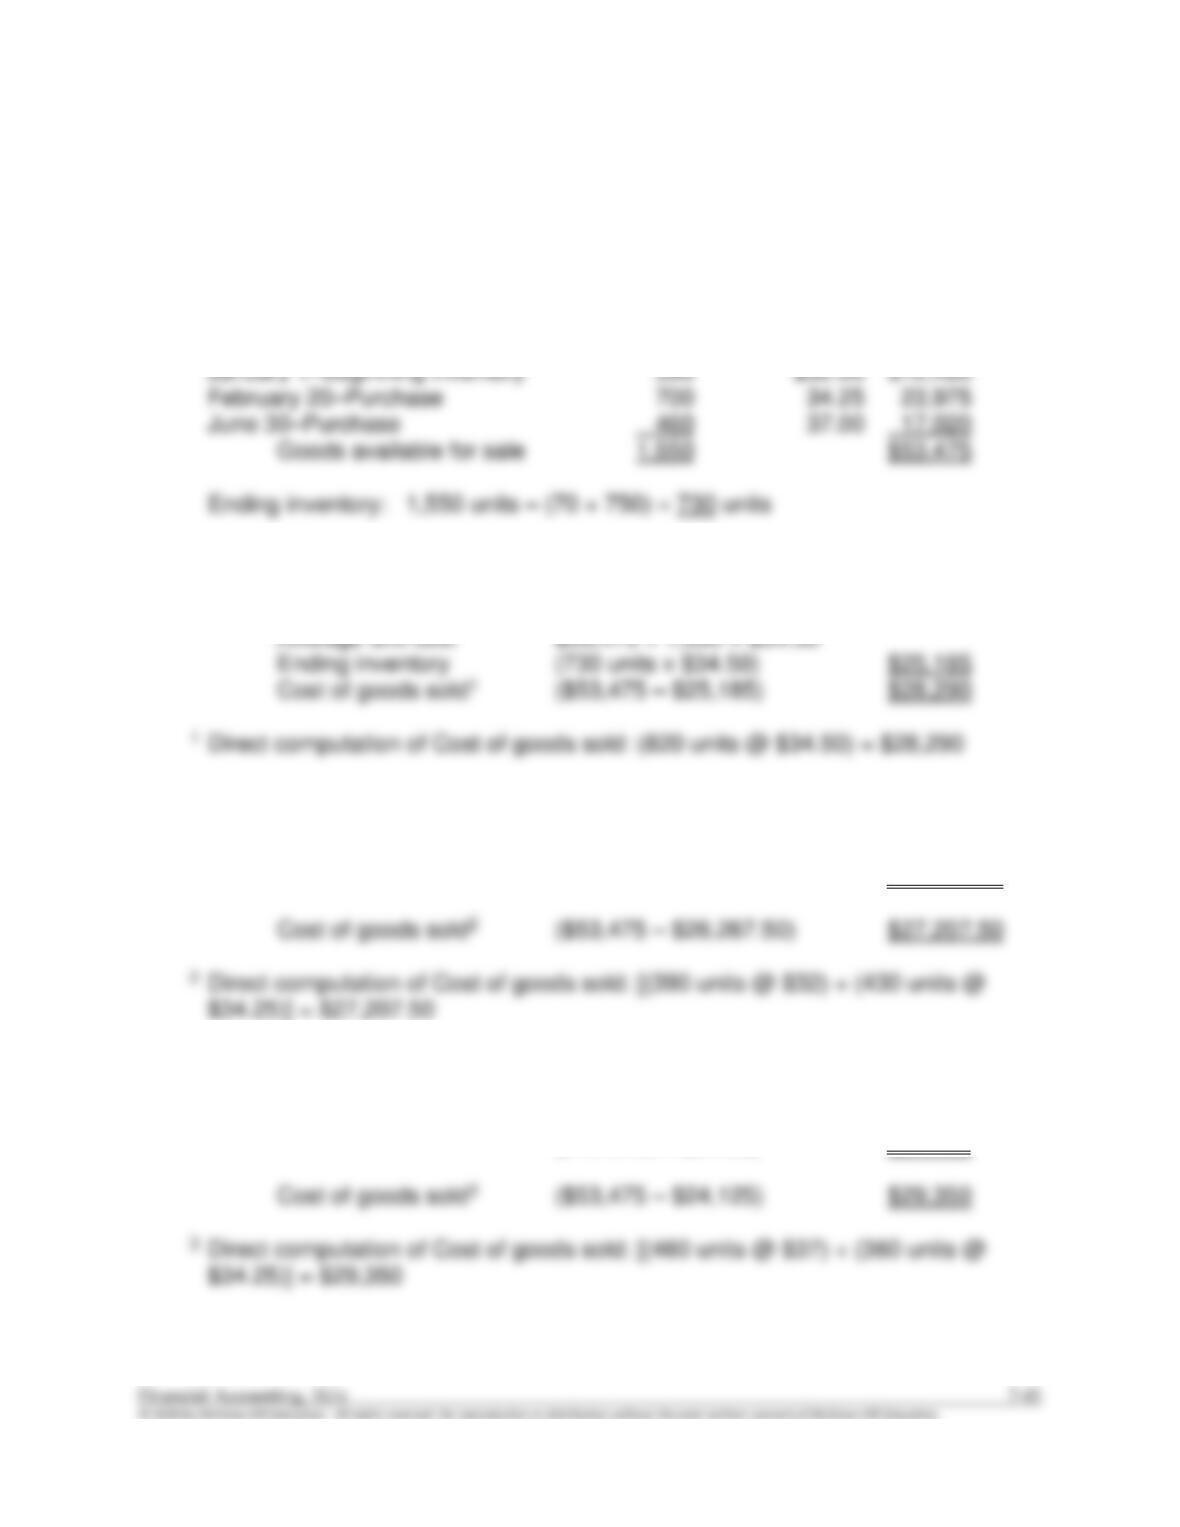
a) Goods available for sale for all methods:
Unit Total
Units Cost Cost
b) and c)
1. Average cost:
2. First-in, first-out:
Ending inventory (460 units x $37) +
(270 units x $34.25) $26,267.50
3. Last-in, first-out:
Ending inventory (390 units x $32) +
(340 units x $34.25) $24,125
AP7−1. (continued)
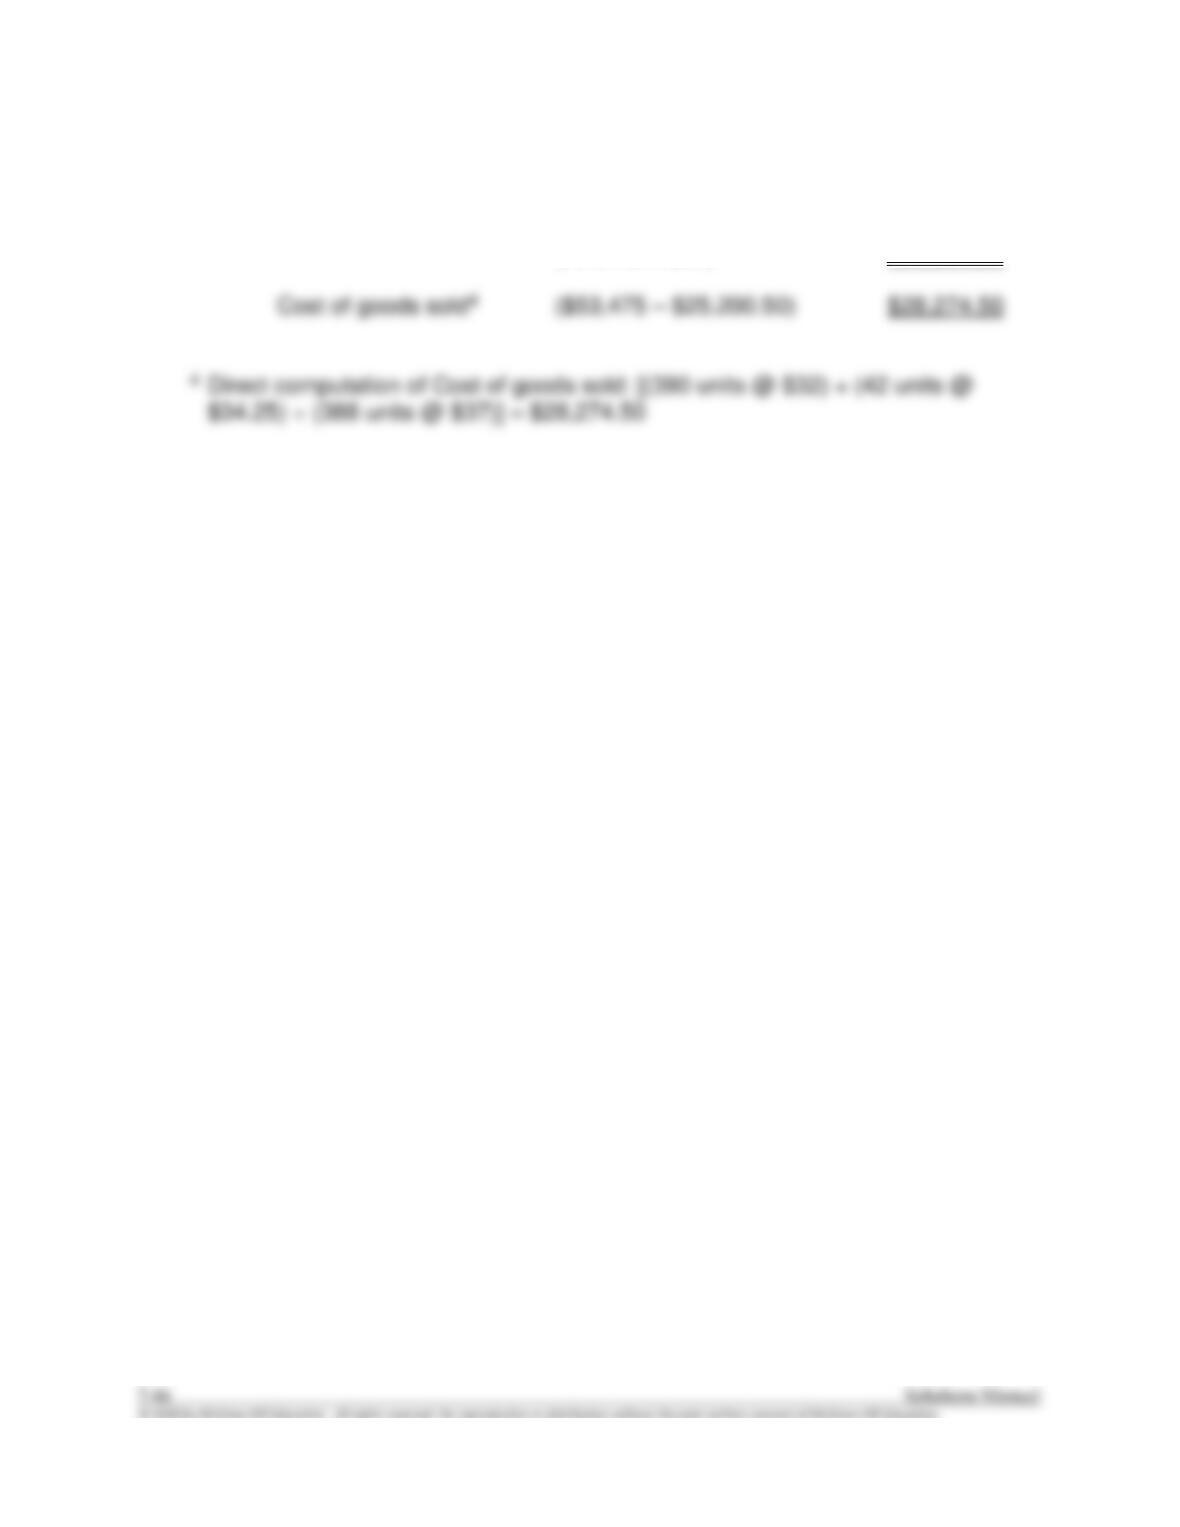
4. Specific identification:
Ending inventory (658 units x $34.25) +
(72 units x $37) $25,200.50
Financial Accounting, 10/e 7-47
AP7–2.
Req. 1
NEWRIDGE COMPANY
Partial Income Statement
For the Month Ended January 31, current year
(a) (b) (c) (d)
Average Specific
Cost FIFO LIFO Identification
Computations:
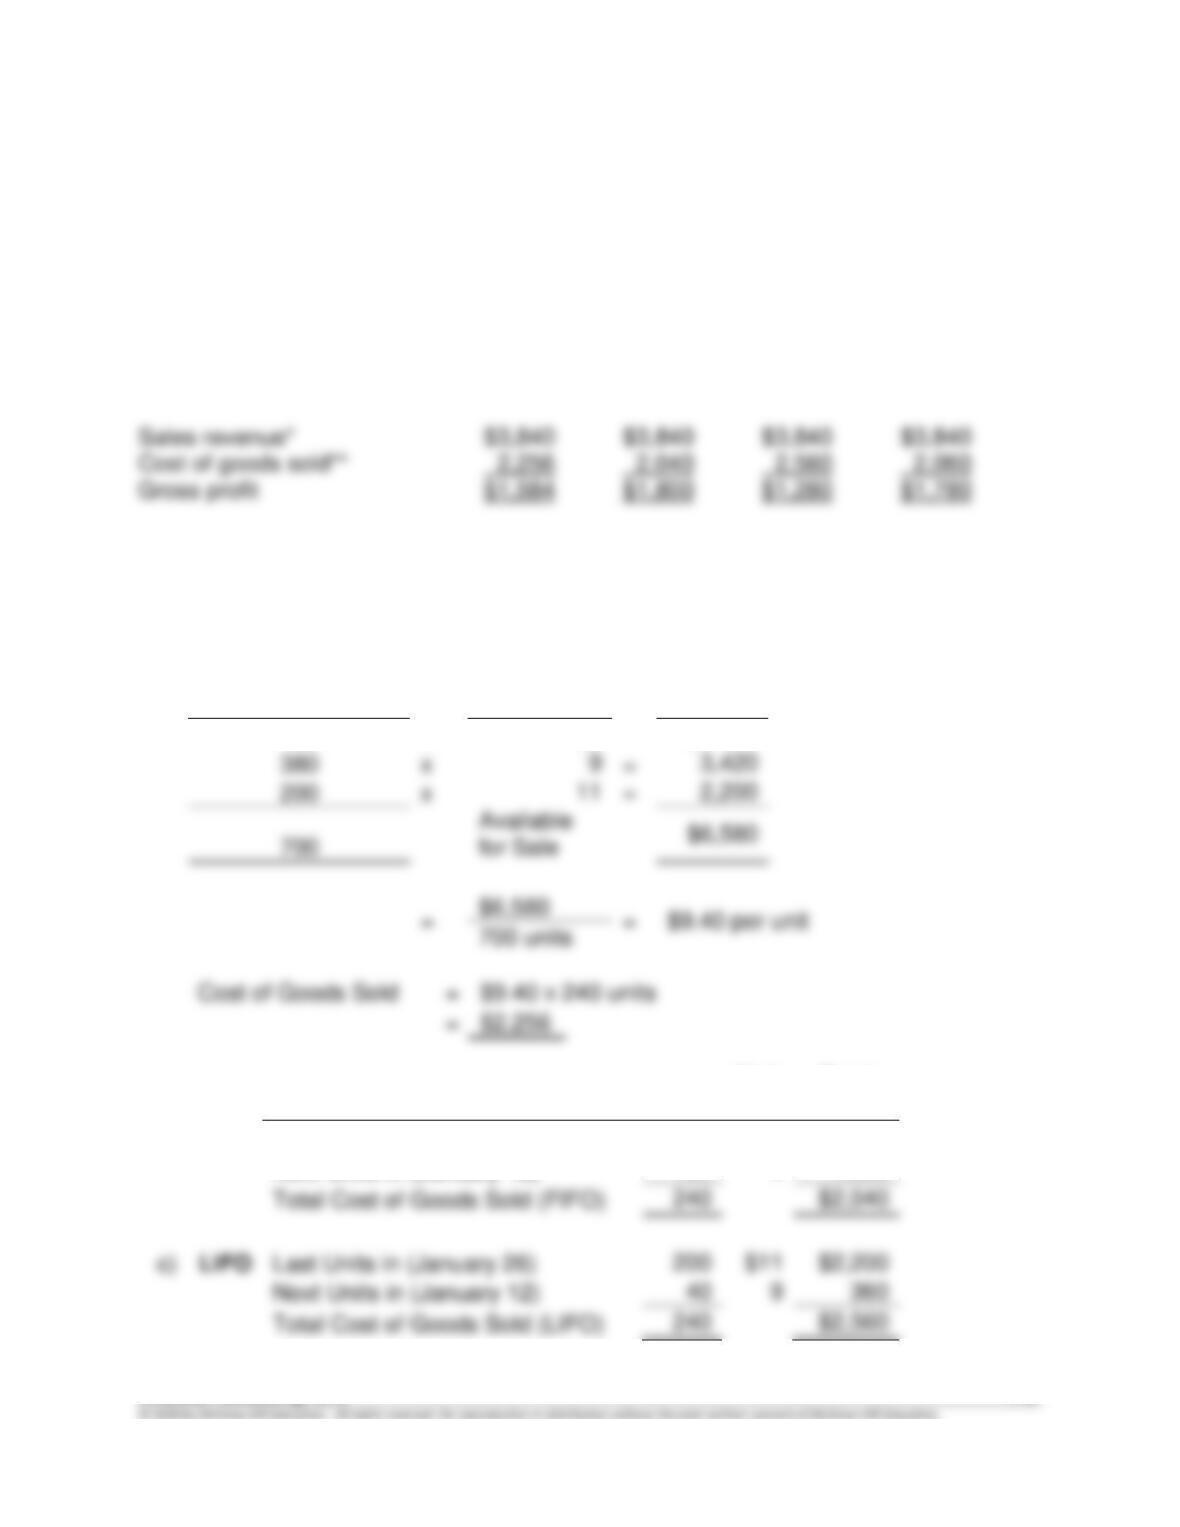
*Sales revenue = 240 units @ $16 = $3,840.
**Cost of Goods Sold Amounts:
a)
Average Cost
Number of Units
x
Unit Cost
=
Total
Cost
120
x
$8
=
$ 960
380
x
=
200
x
=
700
for Sale
$6,580
700 units
Cost of Goods Sold
=
$9.40 x 240 units
=
$2,256
Cost of Goods Sold
Units
Unit
Cost
Total
Cost
b)
FIFO
First Units in (Beginning Inventory)
120
$8
$ 960
Next Units in (January 12)
120
9
1,080
Total Cost of Goods Sold (FIFO)
240
$2,040
c)
LIFO
Last Units in (January 26)
$2,200
Next Units in (January 12)
AP7–2. (continued)
Cost of Goods Sold
Units
Unit
Cost
Total Cost
d)
Specific
First sale
100
$ 8
$ 800
Identification
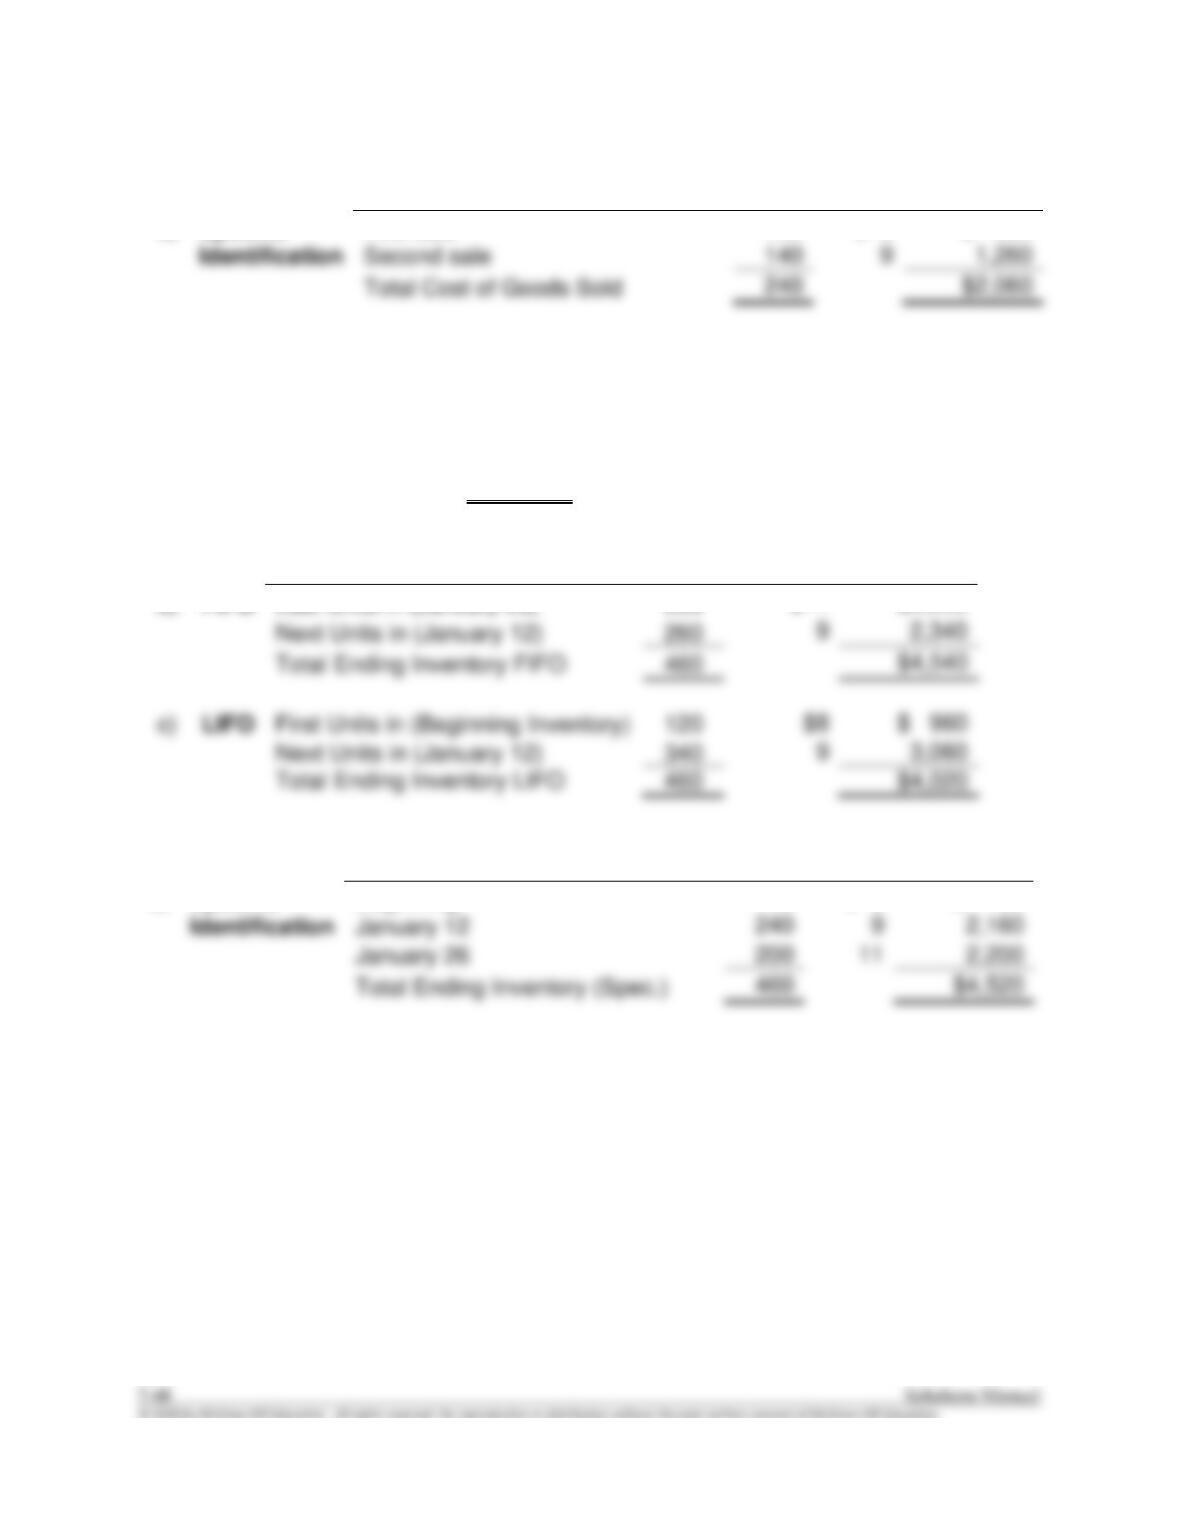
Second sale
Total Cost of Goods Sold
$2,060
Cost of Ending Inventory Amounts:
a)
Average Cost
Ending Inventory
=
$9.40 x 460 units
=
$4,324
Ending Inventory
Units
Unit
Cost
Total Cost
b)
FIFO
Last Units in (January 26)
200
$11
$2,200
Next Units in (January 12)
260
Total Ending Inventory FIFO
460
c)
LIFO
First Units in (Beginning Inventory)
120
Next Units in (January 12)
340
Total Ending Inventory LIFO
460
Req. 2
FIFO reports a higher pretax income than LIFO because (1) prices are rising and (2) FIFO
allocates the older (lower) unit costs to cost of goods sold. For the same reason, FIFO
will report a higher EPS because it produces a higher pretax income than LIFO.
Ending Inventory
Units
Unit
Cost
Total Cost
d)
Specific
Beginning
20
$ 8
$ 160
Identification
January 12
240
January 26
200
Total Ending Inventory (Spec.)
$4,520
Financial Accounting, 10/e 7-49
AP7–2. (continued)
Req. 3
Because LIFO reports a lower pretax income than FIFO for the reasons given in
Req. 4
LIFO will provide a more favorable cash flow of $156 compared to FIFO because less
AP7–3.
Req. 1
Prices Rising Prices Falling
A B C D
FIFO LIFO FIFO LIFO
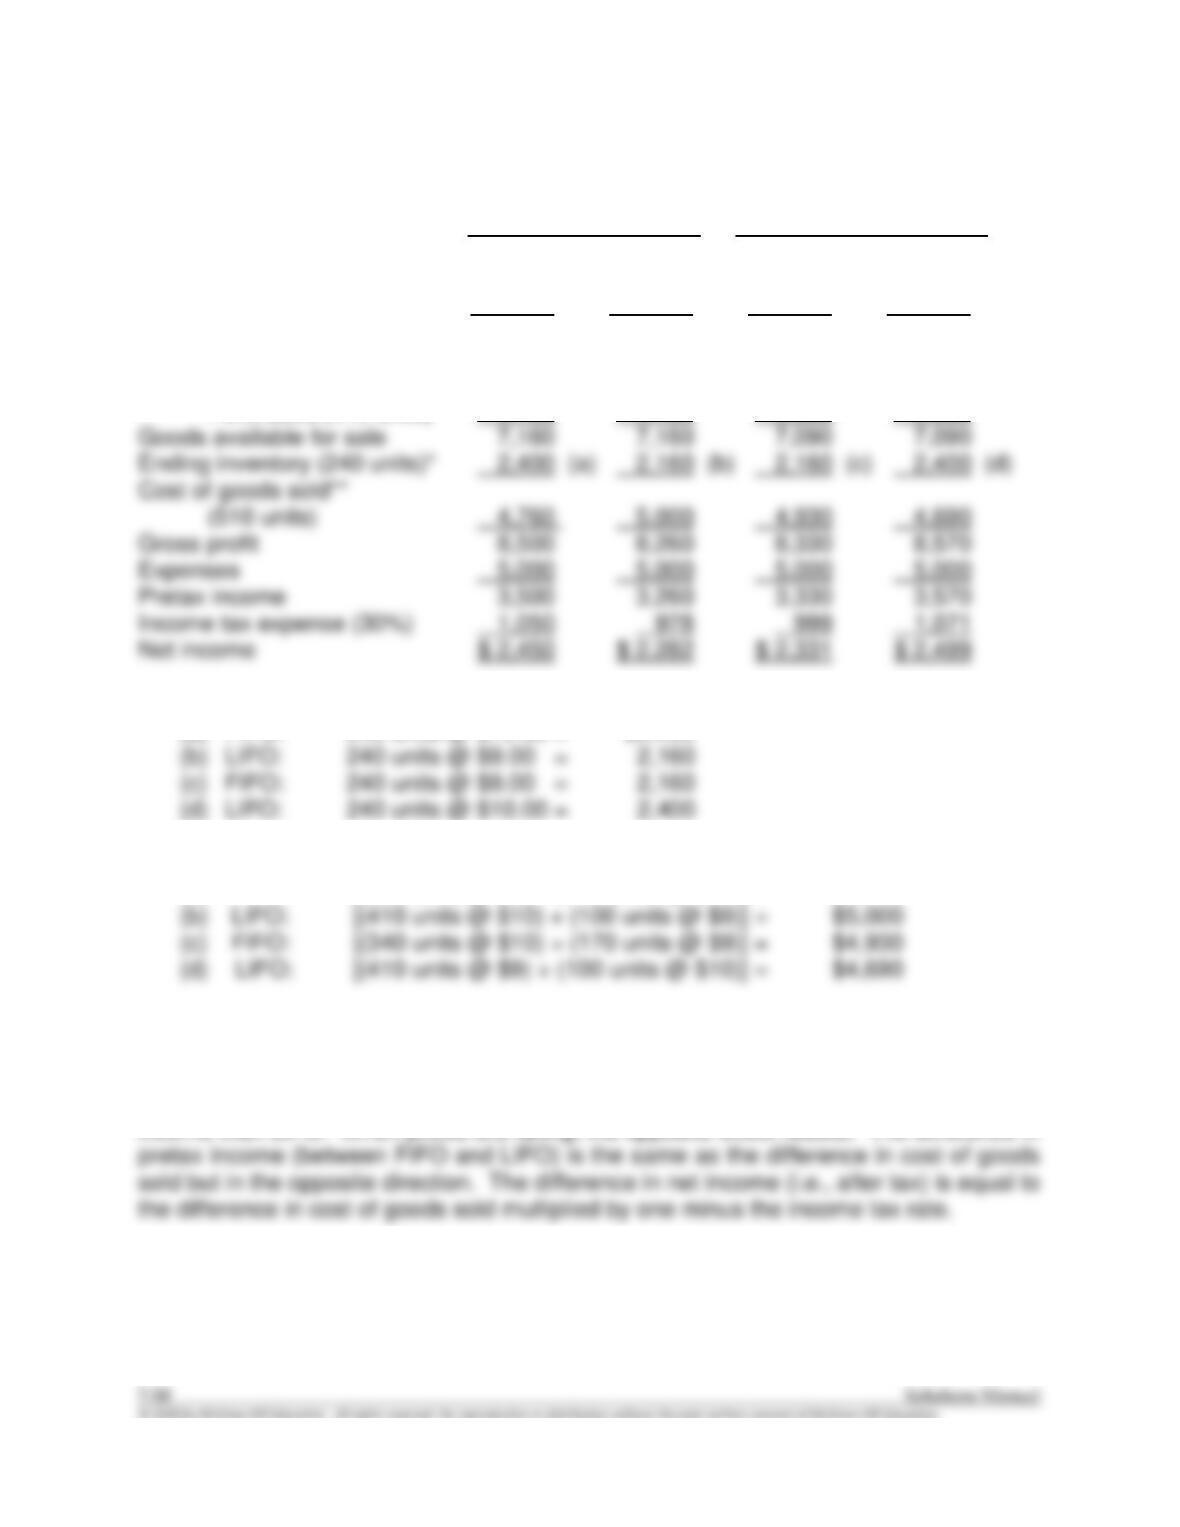
Sales revenue (510 units) $13,260 $13,260 $13,260 $13,260
Cost of goods sold:
Beginning inventory
(340 units) 3,060 3,060 3,400 3,400
Purchases (410 units) 4,100 4,100 3,690 3,690
*Ending inventory computations:
(a) FIFO: 240 units @ $10.00 = $2,400
** Cost of goods sold (direct computations):
(a) FIFO: [(340 units @ $9) + (170 units @ $10)] = $4,760
Req. 2
The above tabulation demonstrates that when prices are rising, FIFO gives a higher net
income than LIFO. When prices are falling, the opposite effect results. The difference in
Financial Accounting, 10/e 7-51
AP7–3. (continued)
Req. 3
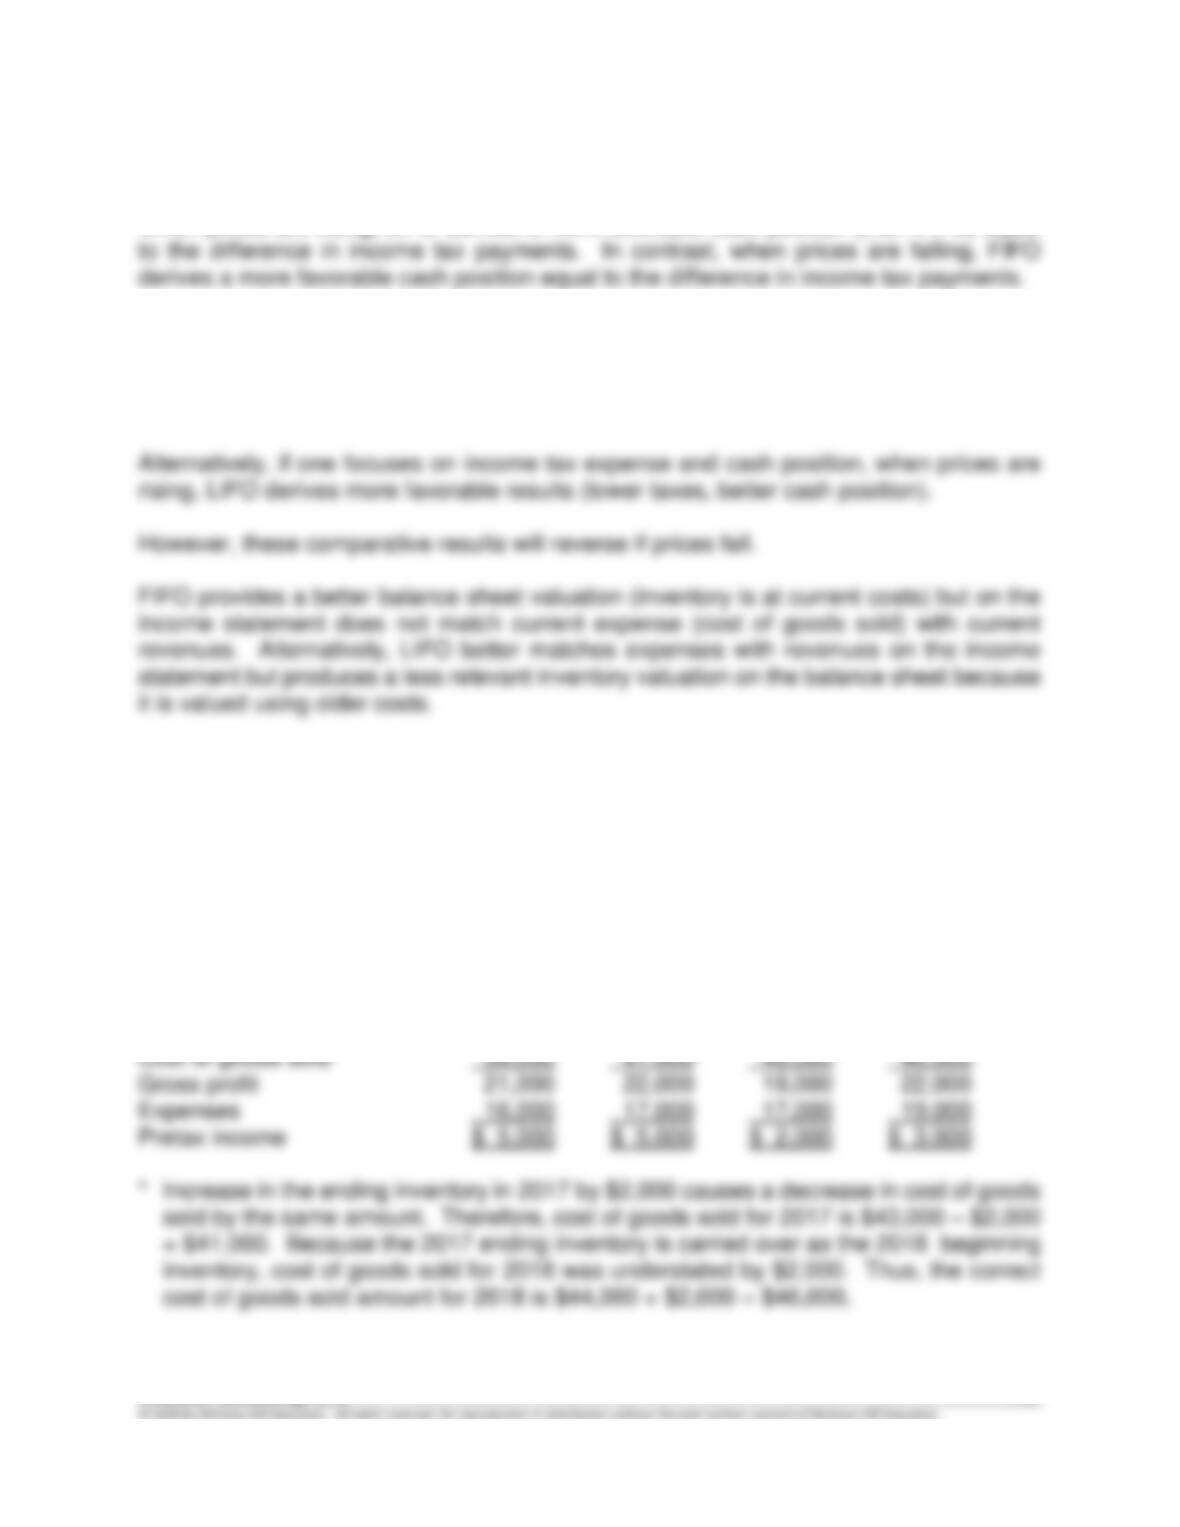
When prices are rising, LIFO derives a more favorable cash position (than FIFO) equal
Req. 4
Either method can be defended reasonably. If one focuses on current income and EPS,
FIFO derives a more favorable result (higher than LIFO) when prices are rising.
AP7–4.
Req. 1
COLCA COMPANY
Income Statements Corrected
2016 2017 2018 2019
Sales revenue $60,000 $63,000 $65,000 $68,000