Chapter 07 – Cost-Volume-Profit Analysis
7-1
CHAPTER 7
Cost-Volume-Profit Analysis
ANSWERS TO REVIEW QUESTIONS
7-1 a. In the contribution-margin approach, the break-even point in units is calculated
using the following formula:
expenses fixed
point even–Break =
7-2 The term unit contribution margin refers to the contribution that each unit of sales
7-3 In addition to the break-even point, a CVP graph shows the impact on total expenses,
7-5 An increase in the fixed expenses of any enterprise will increase its break-even
7-6 A decrease in the variable expense per pound of oysters results in an increase in the
Chapter 07 – Cost-Volume-Profit Analysis
7-2
7-7 The president is correct. A price increase results in a higher unit contribution
margin. An increase in the unit contribution margin causes the break-even point to
7-8 When the sales price and unit variable cost increase by the same amount, the unit
7-11 The most important assumptions of a cost-volume-profit analysis are as follows:
(a) The behavior of total revenue is linear (straight line) over the relevant range. This
7-12 Operating managers frequently prefer the contribution income statement because it
Chapter 07 – Cost-Volume-Profit Analysis
7-3
7-13 The gross margin is defined as sales revenue minus all variable and fixed
7-14 East Company, which is highly automated, will have a cost structure dominated by
fixed costs. West Company’s cost structure will include a larger proportion of
7-15 When sales volume increases, Company X will have a higher percentage increase in
profit than Company Y. Company X’s higher proportion of fixed costs gives the firm
7-16 The sales mix of a multiproduct organization is the relative proportion of sales of its
products.
7-17 The car rental agency’s sales mix is the relative proportion of its rental business
7-18 Cost-volume-profit analysis shows the effect on profit of changes in expenses, sales
7-4
7-19 Budgeting begins with a sales forecast. Cost-volume-profit analysis can be used to
determine the profit that will be achieved at the budgeted sales volume. A CVP
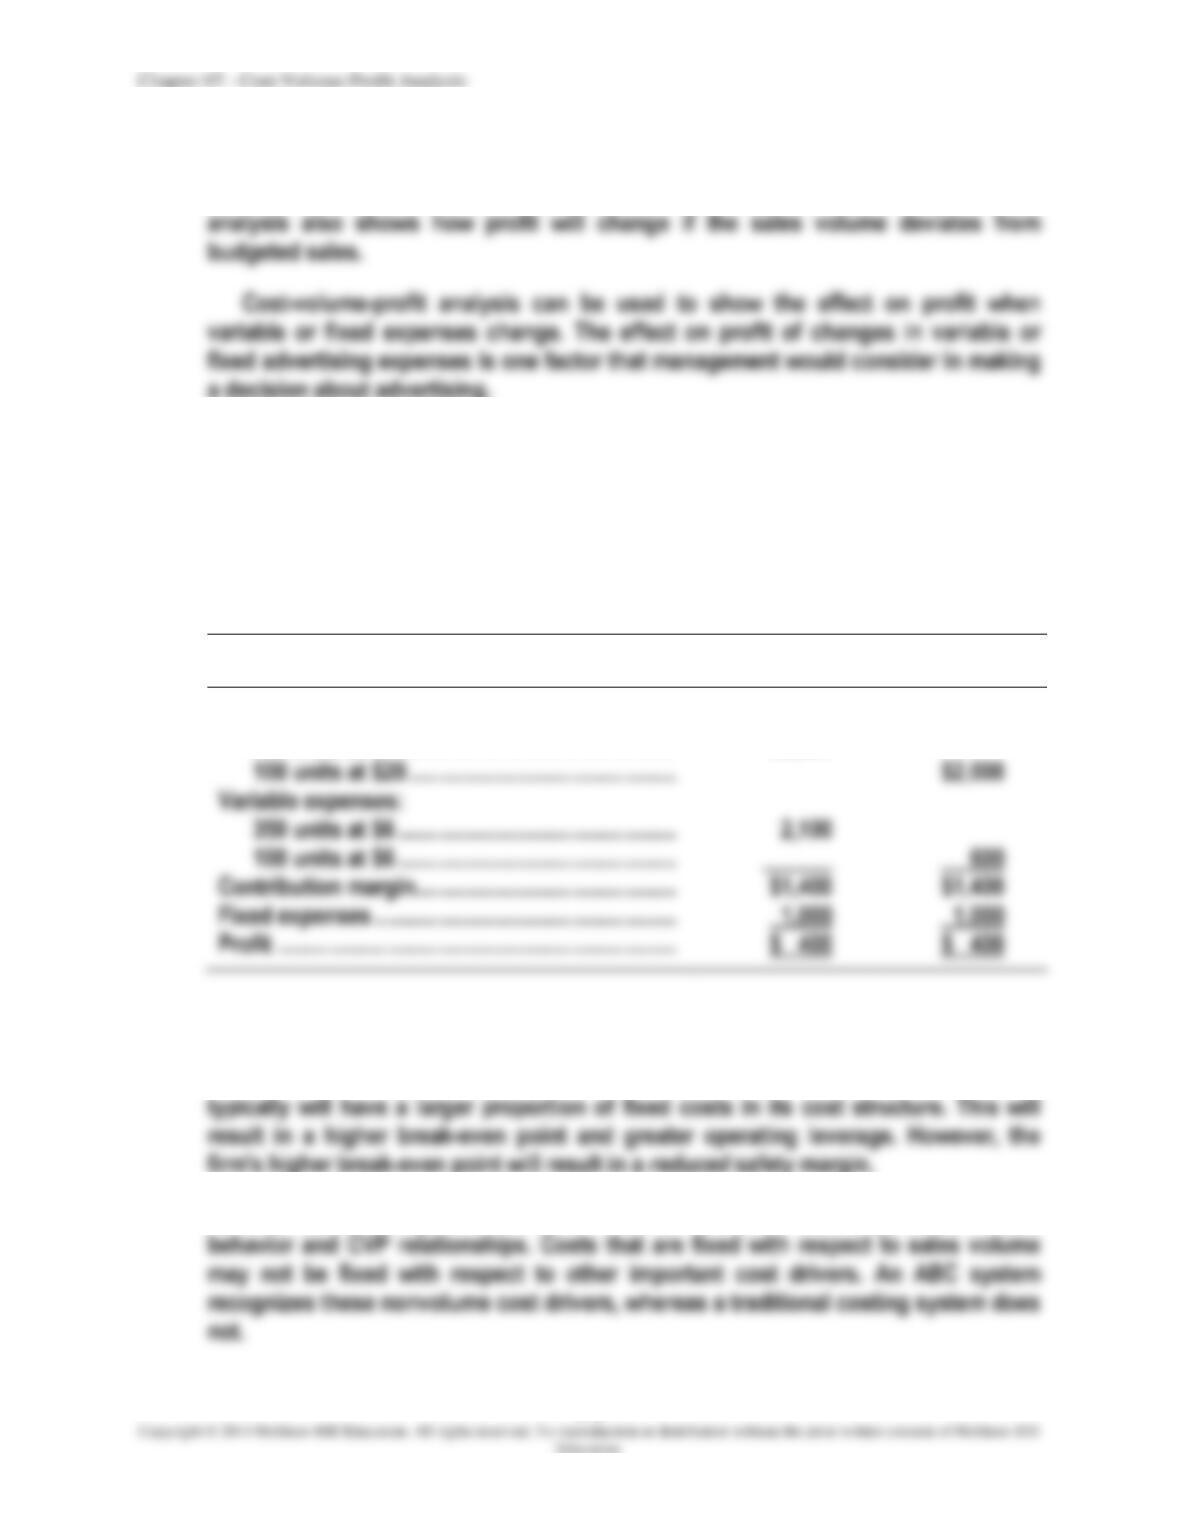
7-20 The low-price company must have a larger sales volume than the high-price
company. By spreading its fixed expense across a larger sales volume, the low-price
firm can afford to charge a lower price and still earn the same profit as the high-price
company. Suppose, for example, that companies A and B have the following
expenses, sales prices, sales volumes, and profits.
Company A
Company B
Sales revenue:
350 units at $10 ……………………………………….
$3,500
7-21 The statement makes three assertions, but only two of them are true. Thus, the
statement is false. A company with an advanced manufacturing environment
7-22 Activity-based costing (ABC) results in a richer description of an organization’s cost
Chapter 07 – Cost-Volume-Profit Analysis
7-5
SOLUTIONS TO EXERCISES
EXERCISE 7-23 (20 MINUTES)
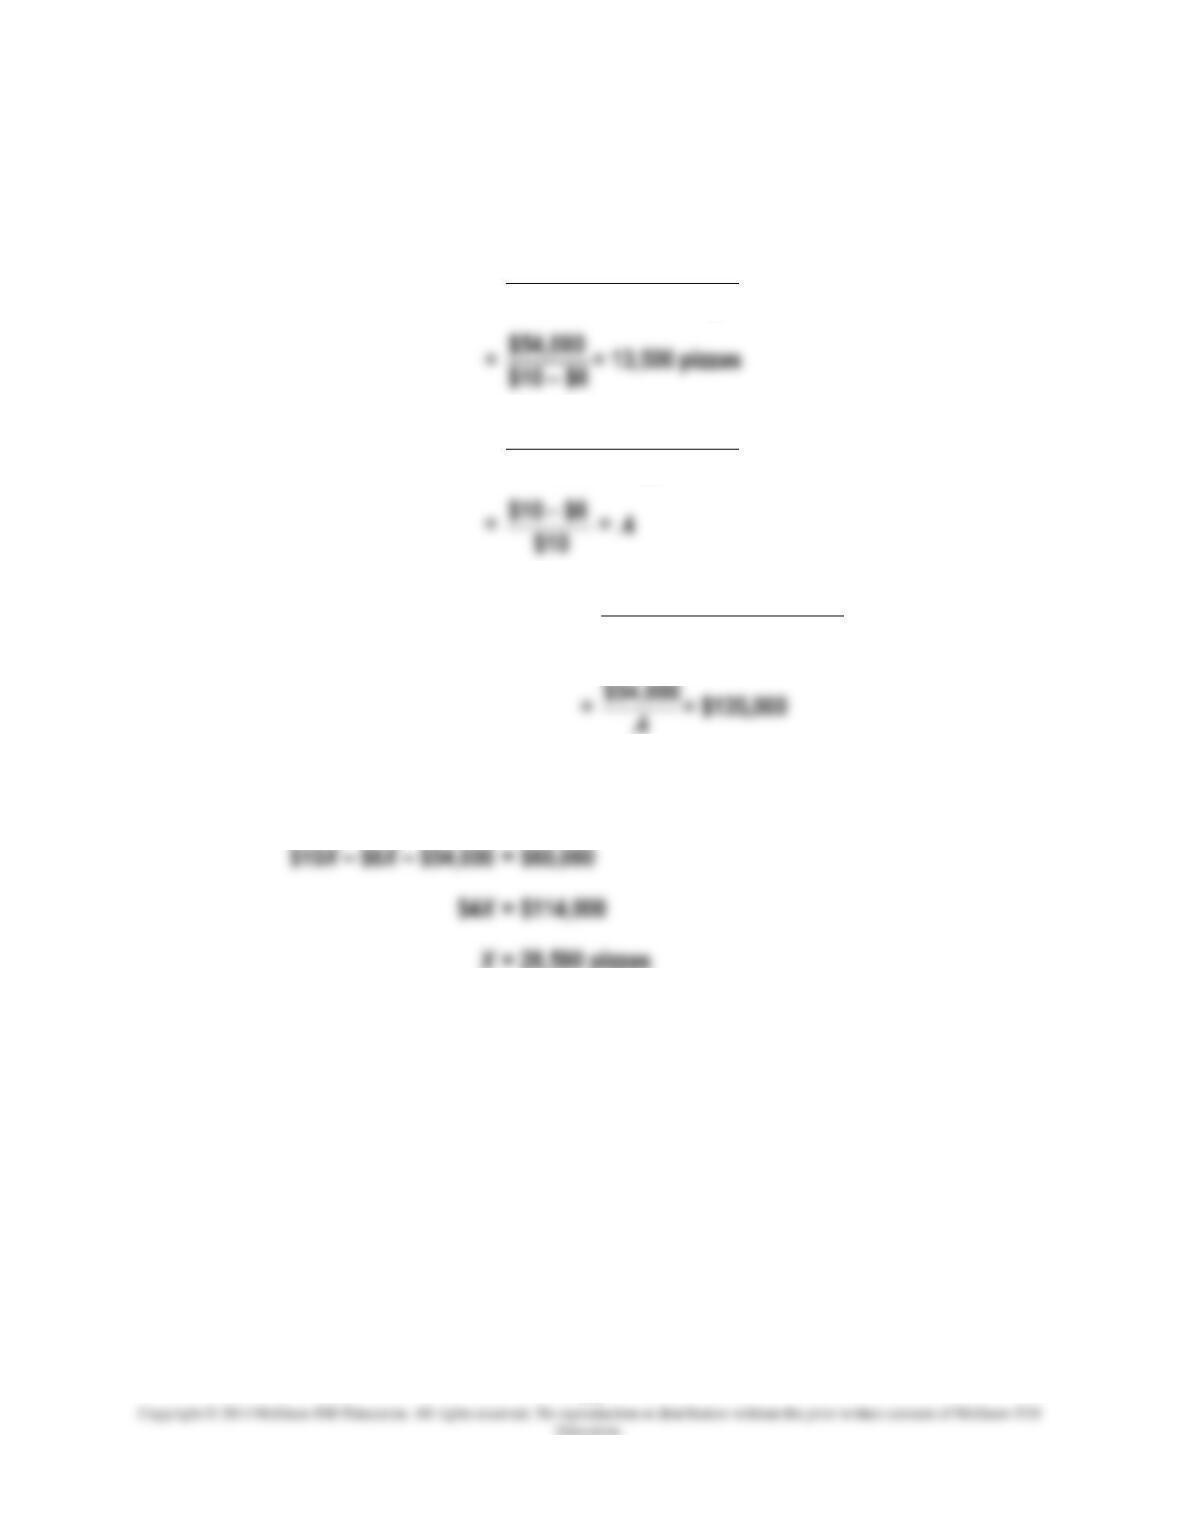
1. Break-even point (in units) =
margin oncontributiunit
expenses fixed
2. Contribution-margin ratio =
price salesunit
margin oncontributiunit
3. Break-even point (in sales dollars) =
ratio margin–oncontributi
expenses fixed
4. Let X denote the sales volume of pizzas required to earn a target net profit of
$60,000.
7-6
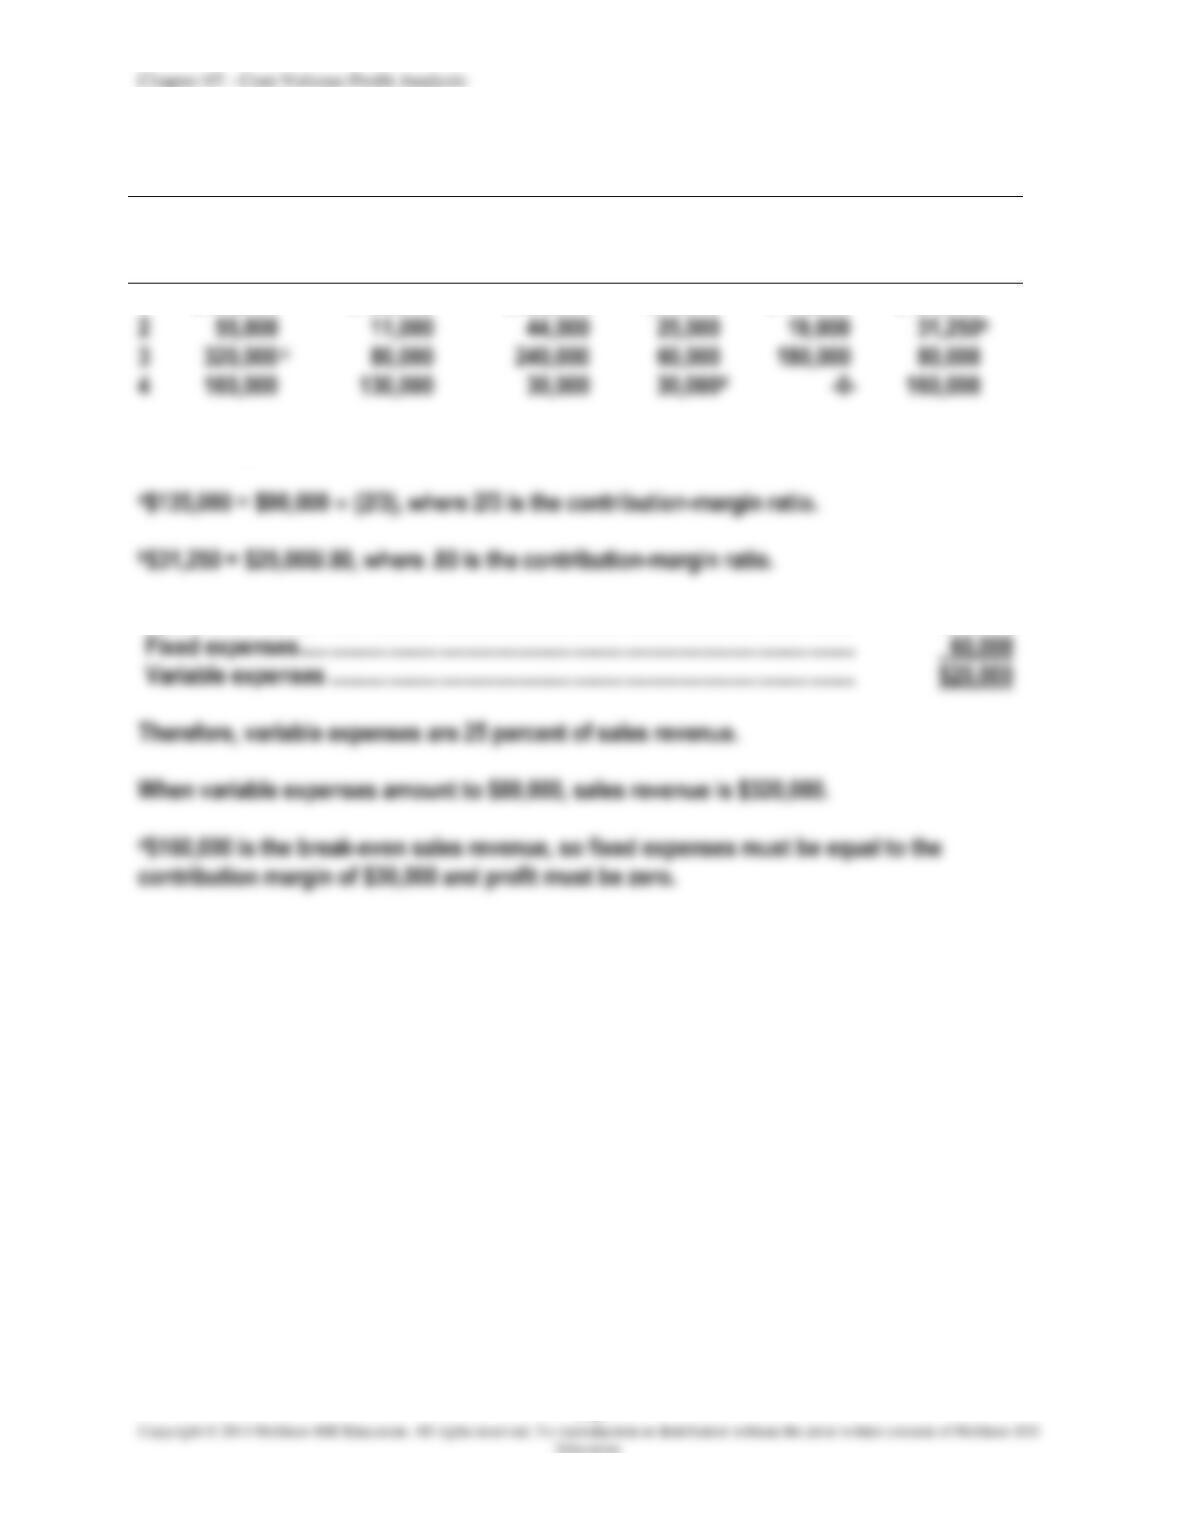
EXERCISE 7-24 (25 MINUTES)
Sales
Revenue
Variable
Expenses
Total
Contribution
Margin
Fixed
Expenses
Net
Income
Break-Even
Sales
Revenue
1
$360,000
$120,000
$240,000
$90,000
$150,000
$135,000 a
2
55,000
44,000
3
4
30,000
Explanatory notes for selected items:
cBreak-even sales revenue ……………………………………………………….……………
$80,000
$20,000
Therefore, variable expenses are 25 percent of sales revenue.
When variable expenses amount to $80,000, sales revenue is $320,000.
Chapter 07 – Cost-Volume-Profit Analysis
7-7
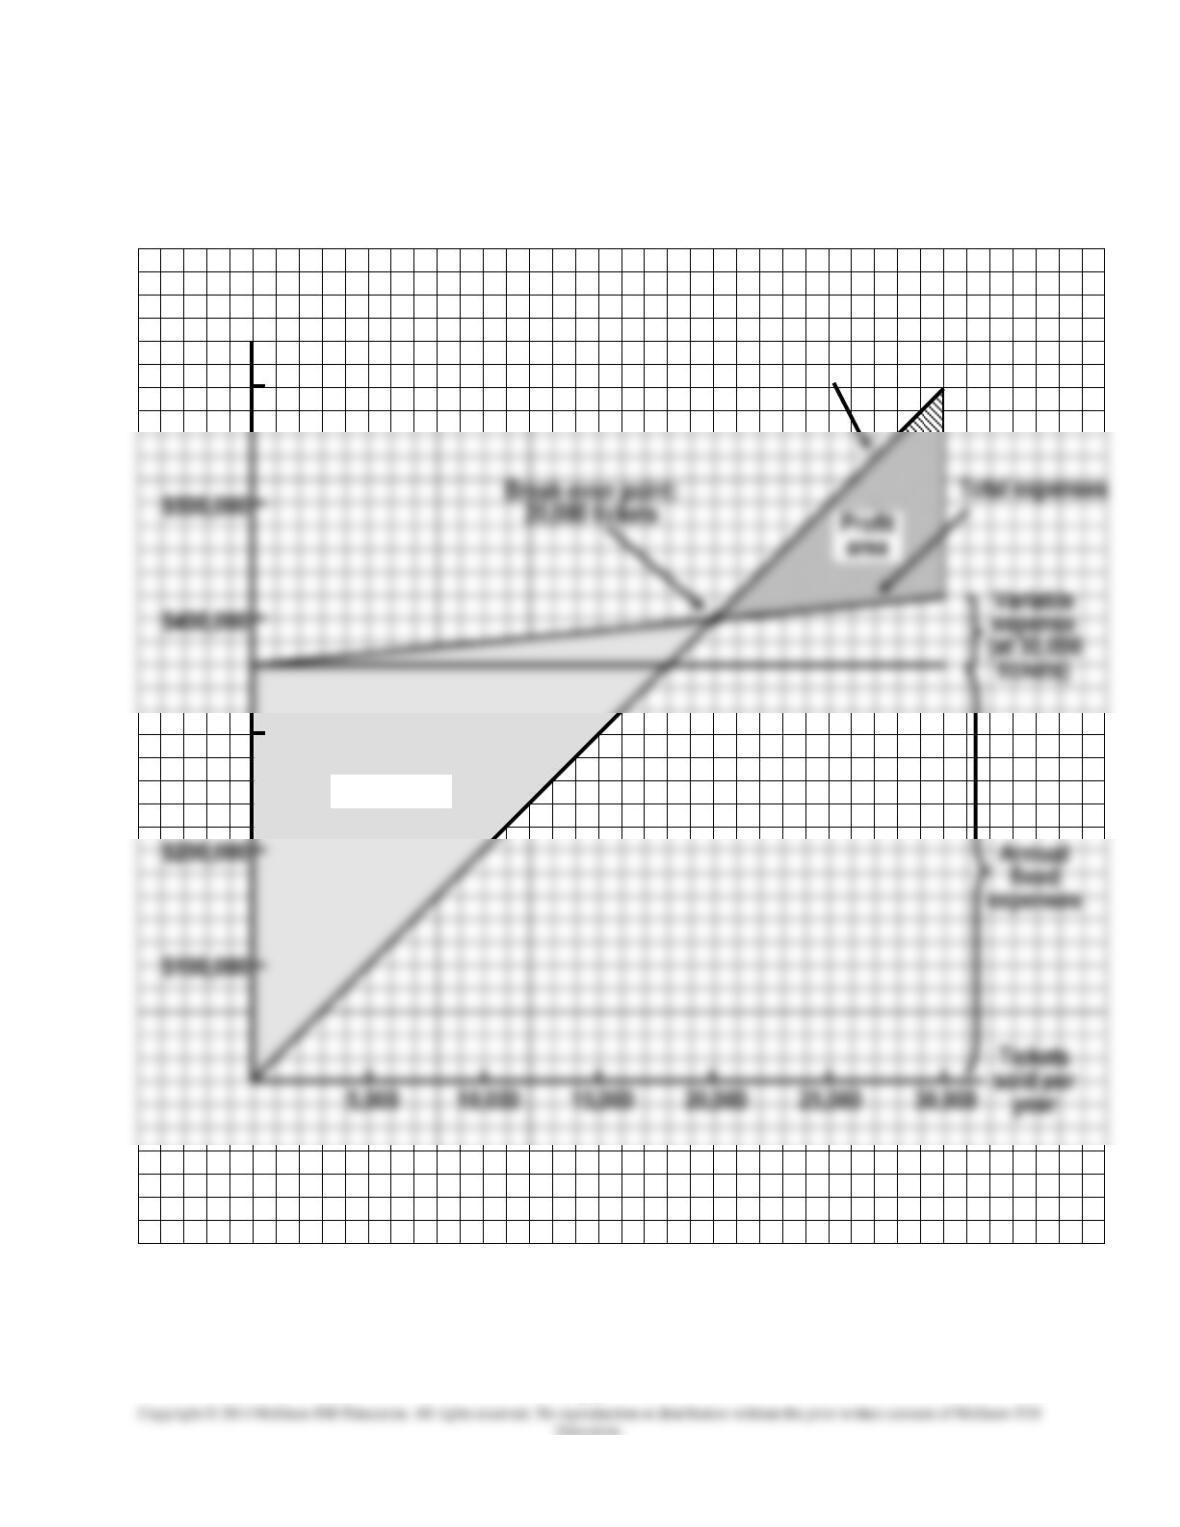
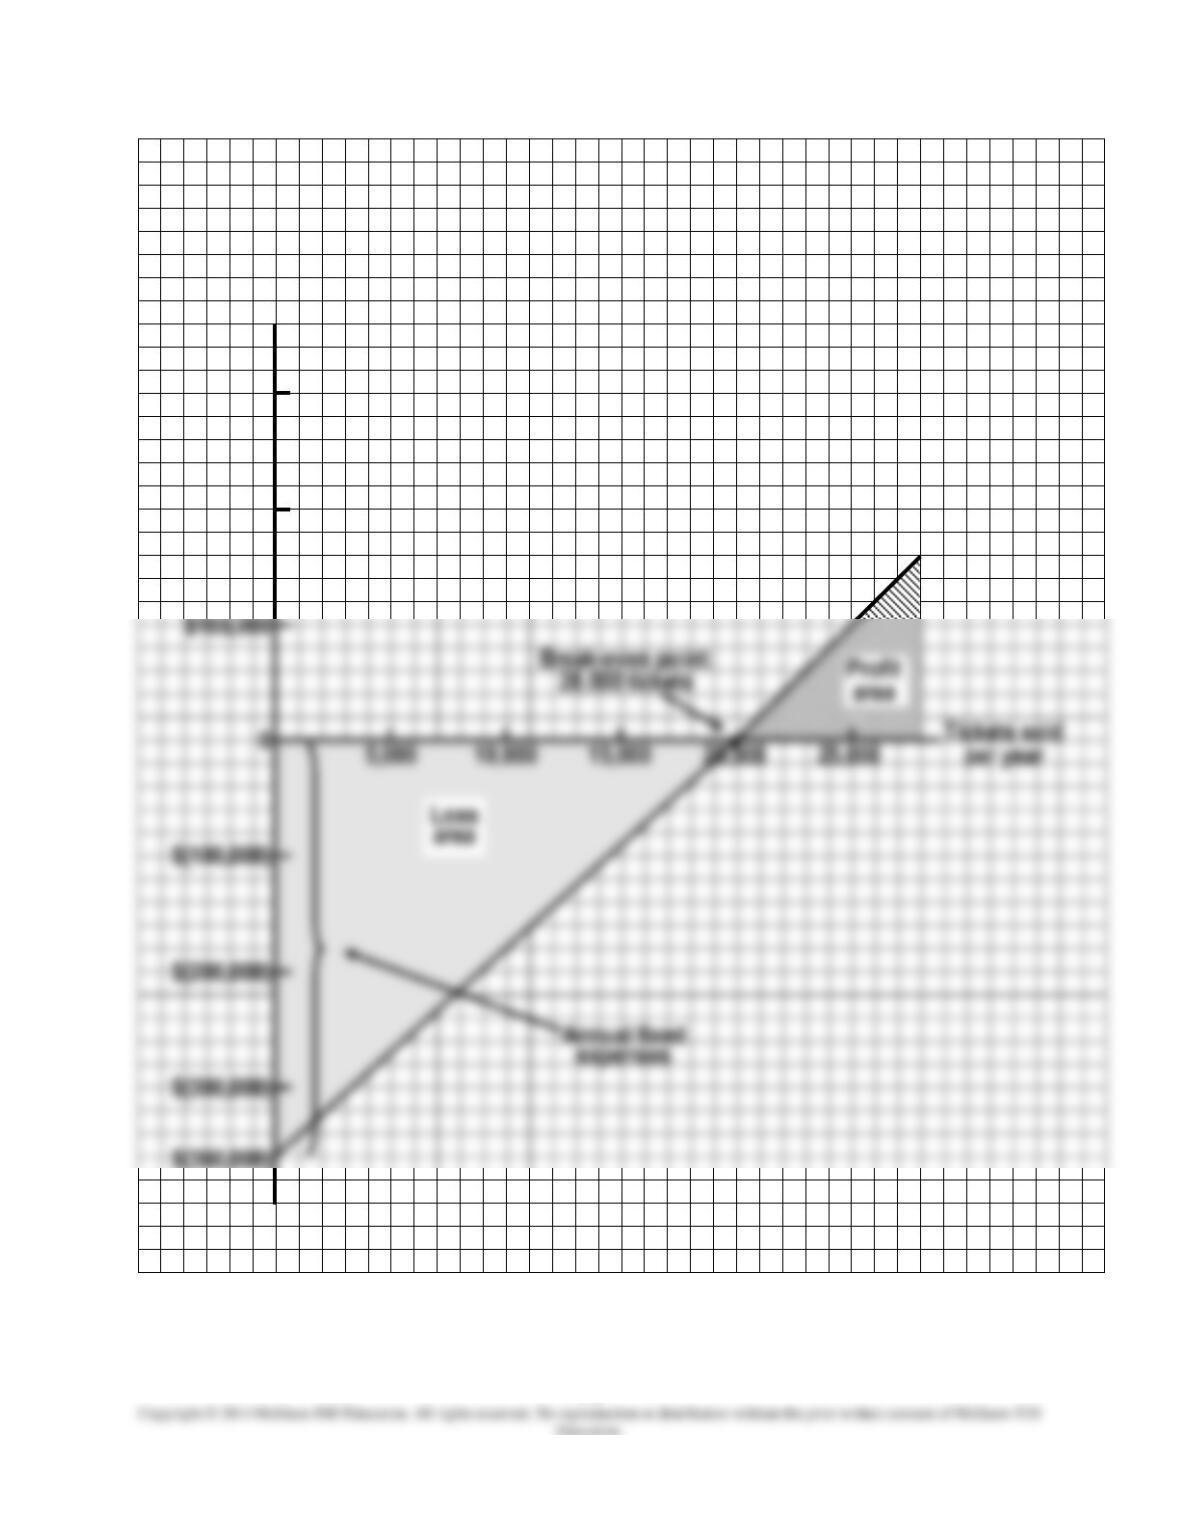
EXERCISE 7-25 (25 MINUTES)
1. Cost-volume-profit graph:
$500,000
$400,000
Total revenue
$200,000
$100,000
Dollars per year
$600,000
$300,000
Loss area
Chapter 07 – Cost-Volume-Profit Analysis
7-8
EXERCISE 7-25 (CONTINUED)
EXERCISE 7-26 (25 MINUTES)
Chapter 07 – Cost-Volume-Profit Analysis
7-9
Dollars per year
$300,000
$200,000
$100,000
$(300,000)
Chapter 07 – Cost-Volume-Profit Analysis
EXERCISE 7-26 (CONTINUED)
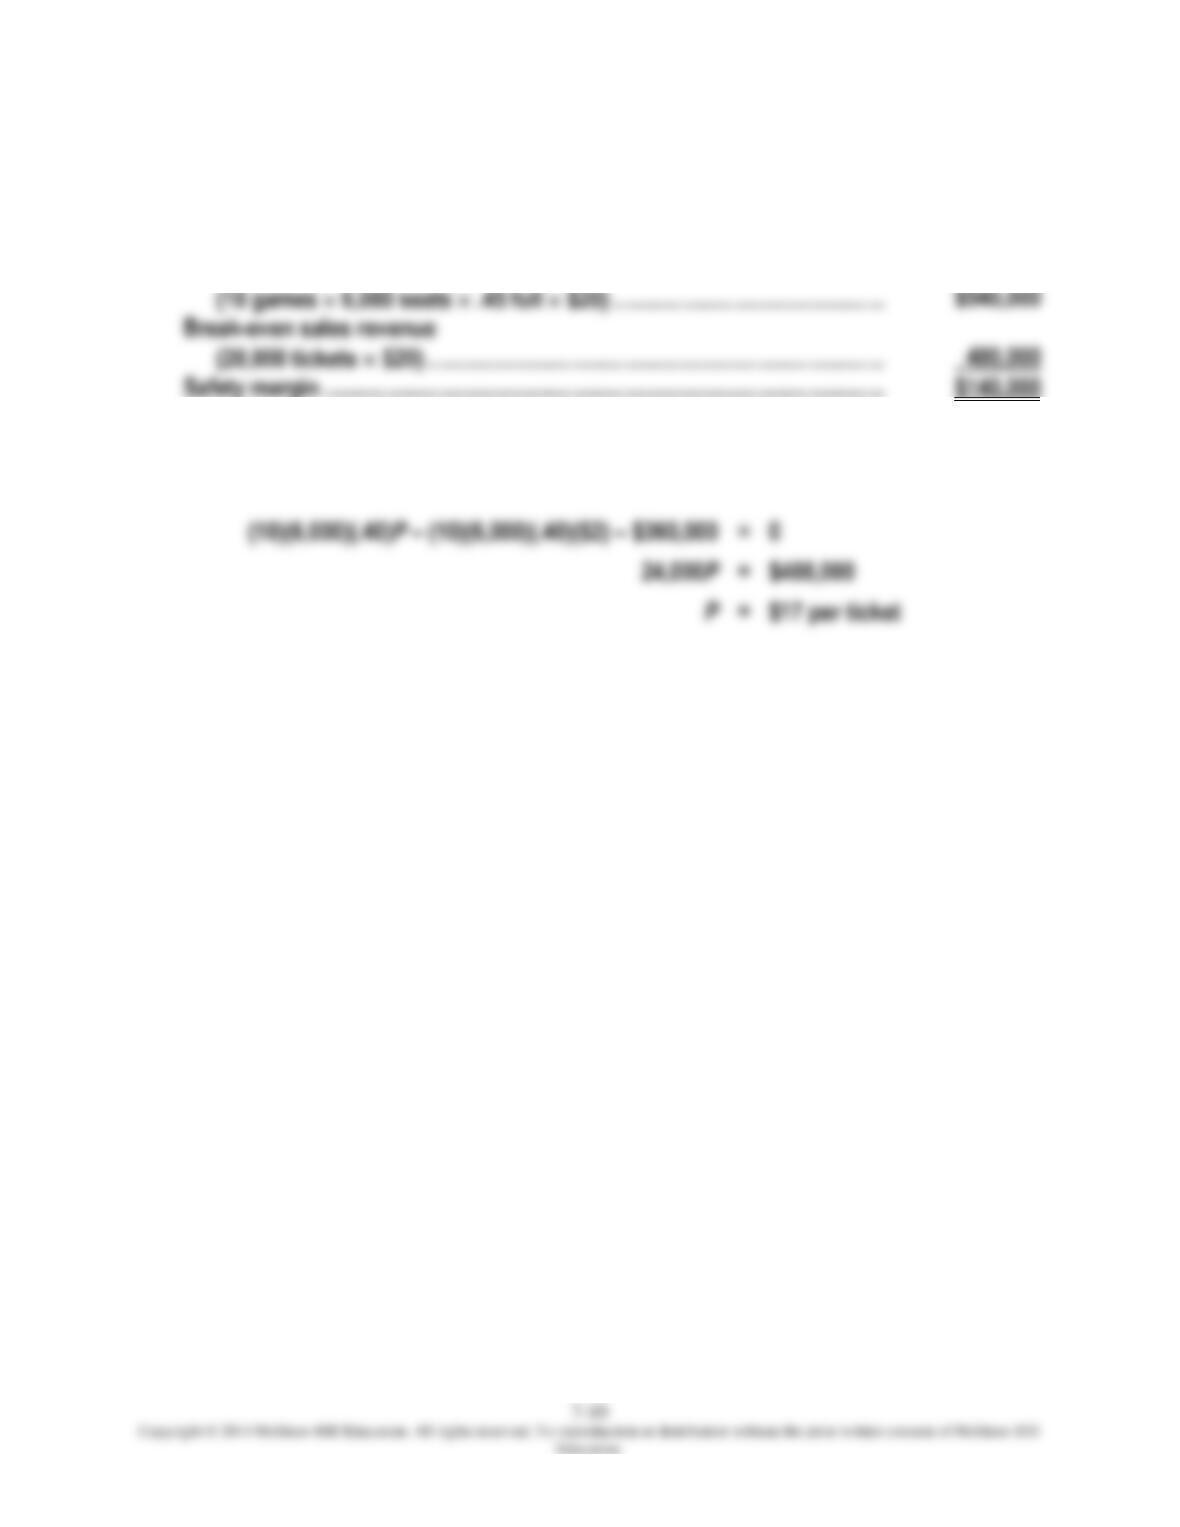
2.
Safety margin:
Budgeted sales revenue
Break-even sales revenue
Safety margin …………………………………………………………………………………….
3.
Let P denote the break-even ticket price, assuming a 10-game season and 40 percent
attendance:
7-11
EXERCISE 7-27 (25 MINUTES)
1. Break-even point (in units) =
margin oncontributiunit
costs fixed
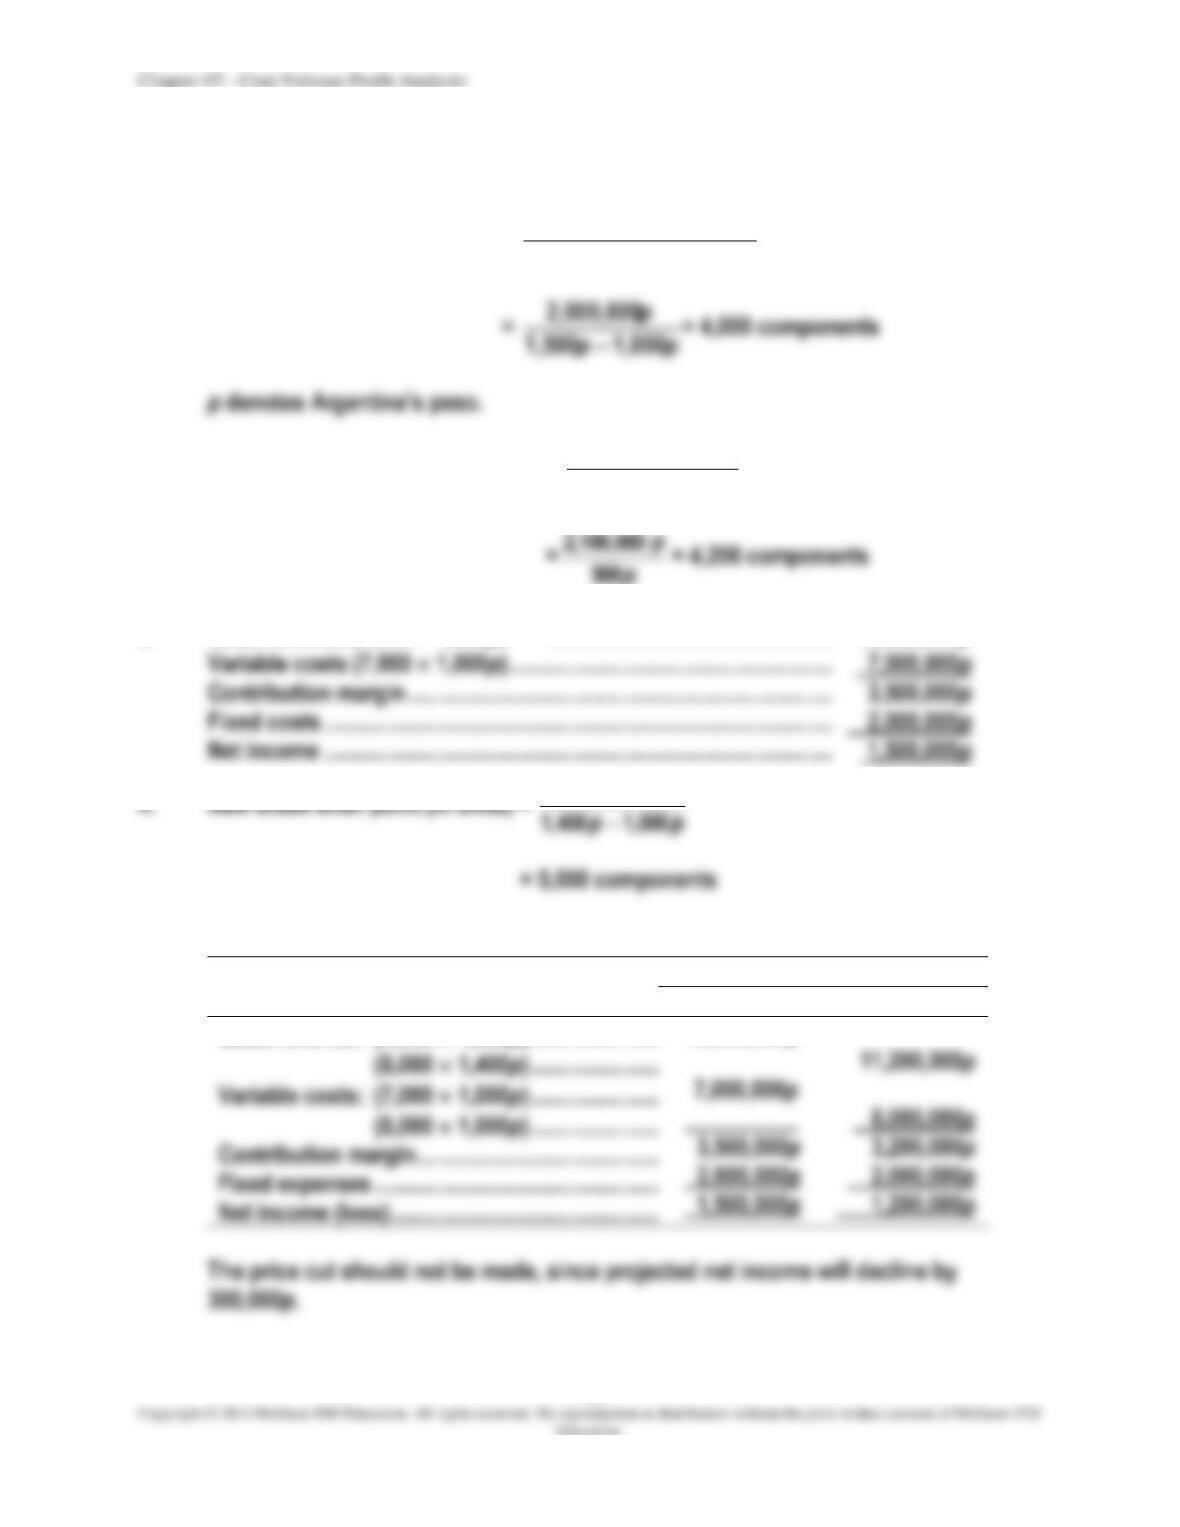
2. New break-even point (in units) =
pp
p
1,000 1,500
(1.05) )(2,000,000
−
3. Sales revenue (7,000 1,500p) …………………………………………. 10,500,000p
p
2,000,000
5. Analysis of price change decision:
Price
1,500p
1,400p
Sales revenue: (7,000 1,500p) …………………………..
10,500,000p
Chapter 07 – Cost-Volume-Profit Analysis
EXERCISE 7-28 (25 MINUTES)
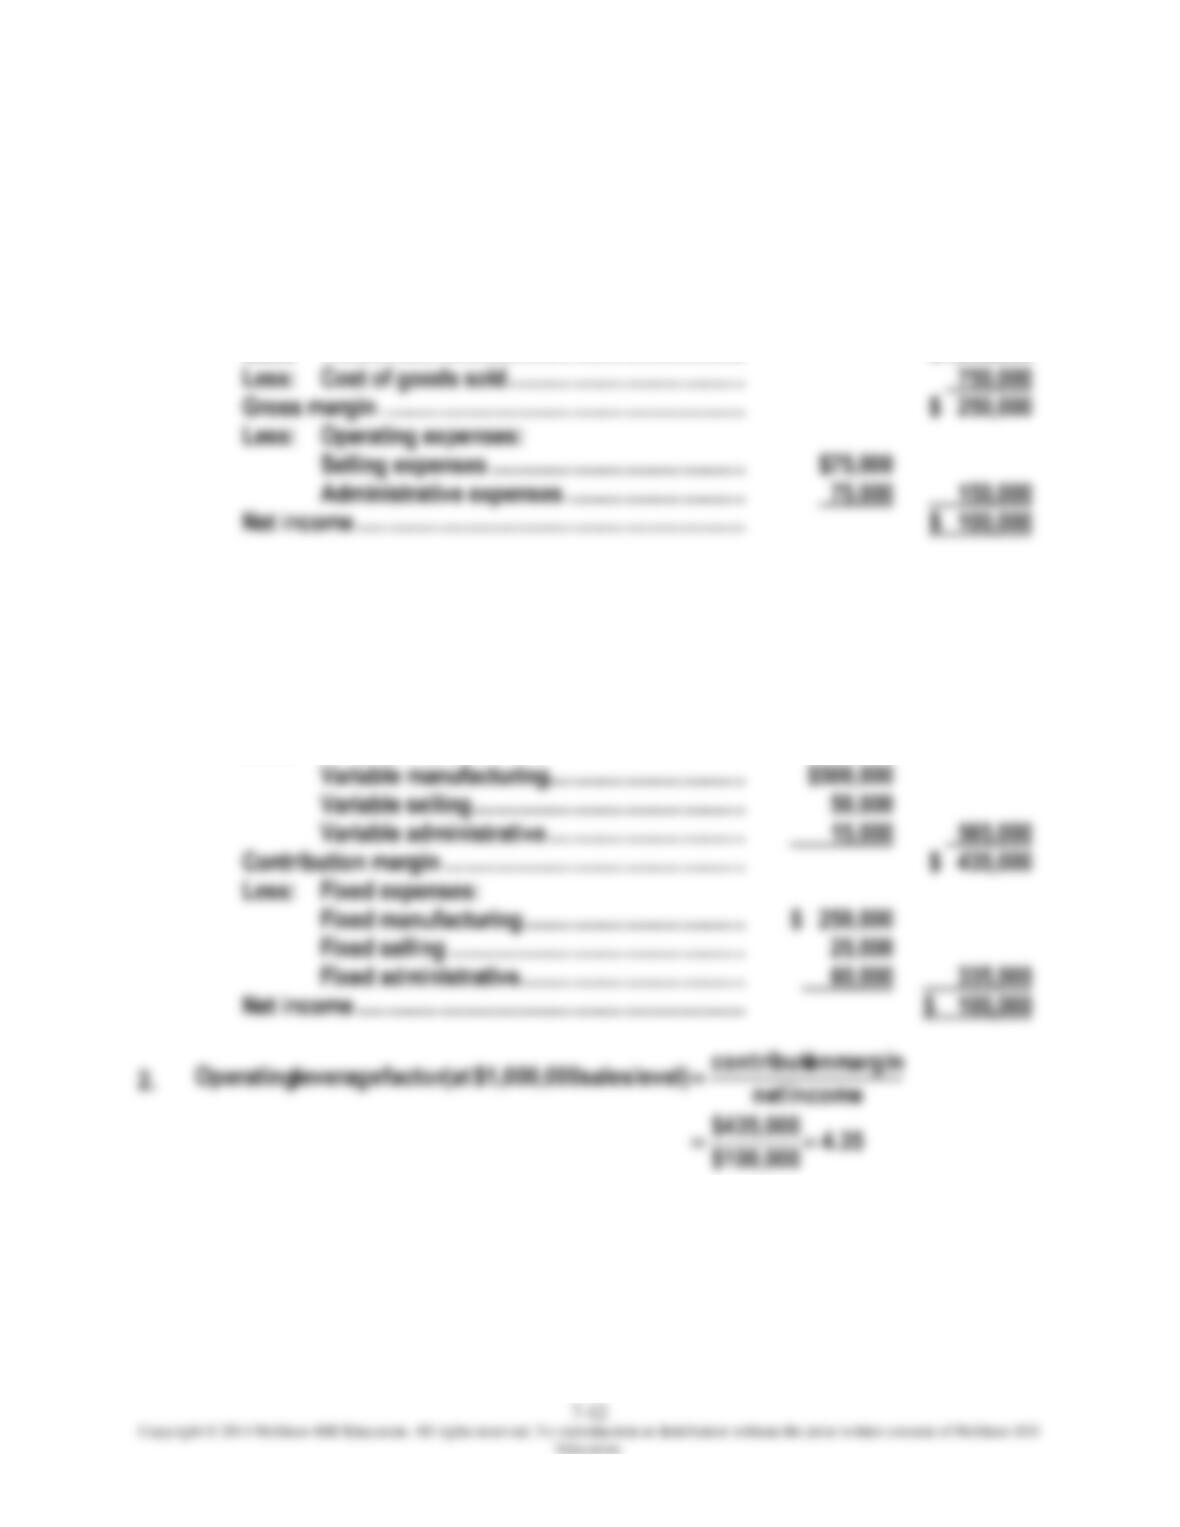
1. (a) Traditional income statement:
PACIFIC RIM PUBLICATIONS, INC.
INCOME STATEMENT
FOR THE YEAR ENDED DECEMBER 31, 20XX
Sales ……………………………………………………….……… $1,000,000
(b) Contribution income statement:
PACIFIC RIM PUBLICATIONS, INC.
INCOME STATEMENT
FOR THE YEAR ENDED DECEMBER 31, 20XX
Sales ……………………………………………………….……… $1,000,000
Less: Variable expenses:
Chapter 07 – Cost-Volume-Profit Analysis
7-13
EXERCISE 7-28 (CONTINUED)
3.
=factor leverage
operating
revenue sales in
increase percentage
incomenet in increase Percentage
4.
Most operating managers prefer the contribution income statement for answering this
EXERCISE 7-29 (30 MINUTES)
Chapter 07 – Cost-Volume-Profit Analysis
7-14
EXERCISE 7-30 (30 MINUTES)
1.
Bicycle Type
Sales
Price
Unit
Variable Cost
Unit
Contribution Margin
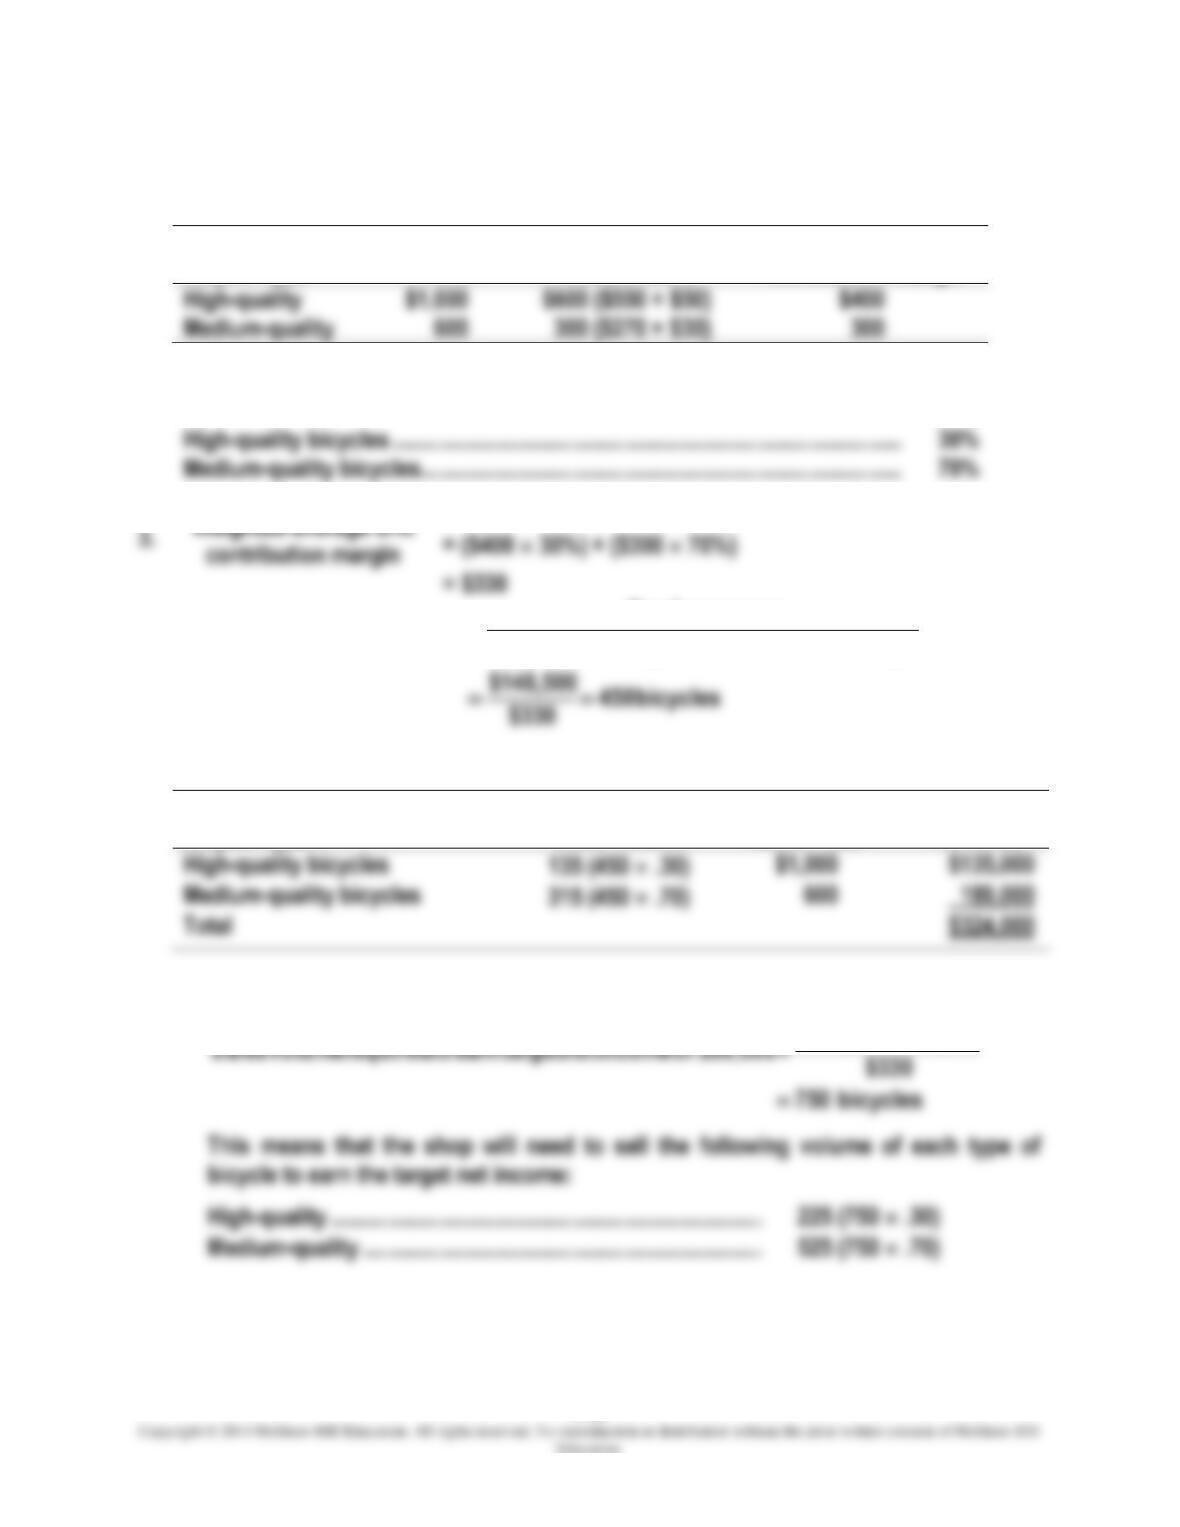
High-quality
$600 ($550 + $50)
Medium-quality
300 ($270 + $30)
2.
Sales mix:
High-quality bicycles …………………………………………………………………………….
30%
Medium-quality bicycles ………………………………………………………………………..
70%
= $330
4.
margin oncontributiunit average–weighted
expenses fixed
units) (inpoint even–Break
=
Bicycle Type
Break-Even
Sales Volume
Sales Price
Sales
Revenue
5. Target net income:
$99,00048,5001$
+
Chapter 07 – Cost-Volume-Profit Analysis
7-15
EXERCISE 7-31 (25 MINUTES)
1. The following income statement, often called a common-size income statement,
provides a convenient way to show the cost structure.
Amount
Percent
Revenue ……………………………………………………..
$1,500,000
100
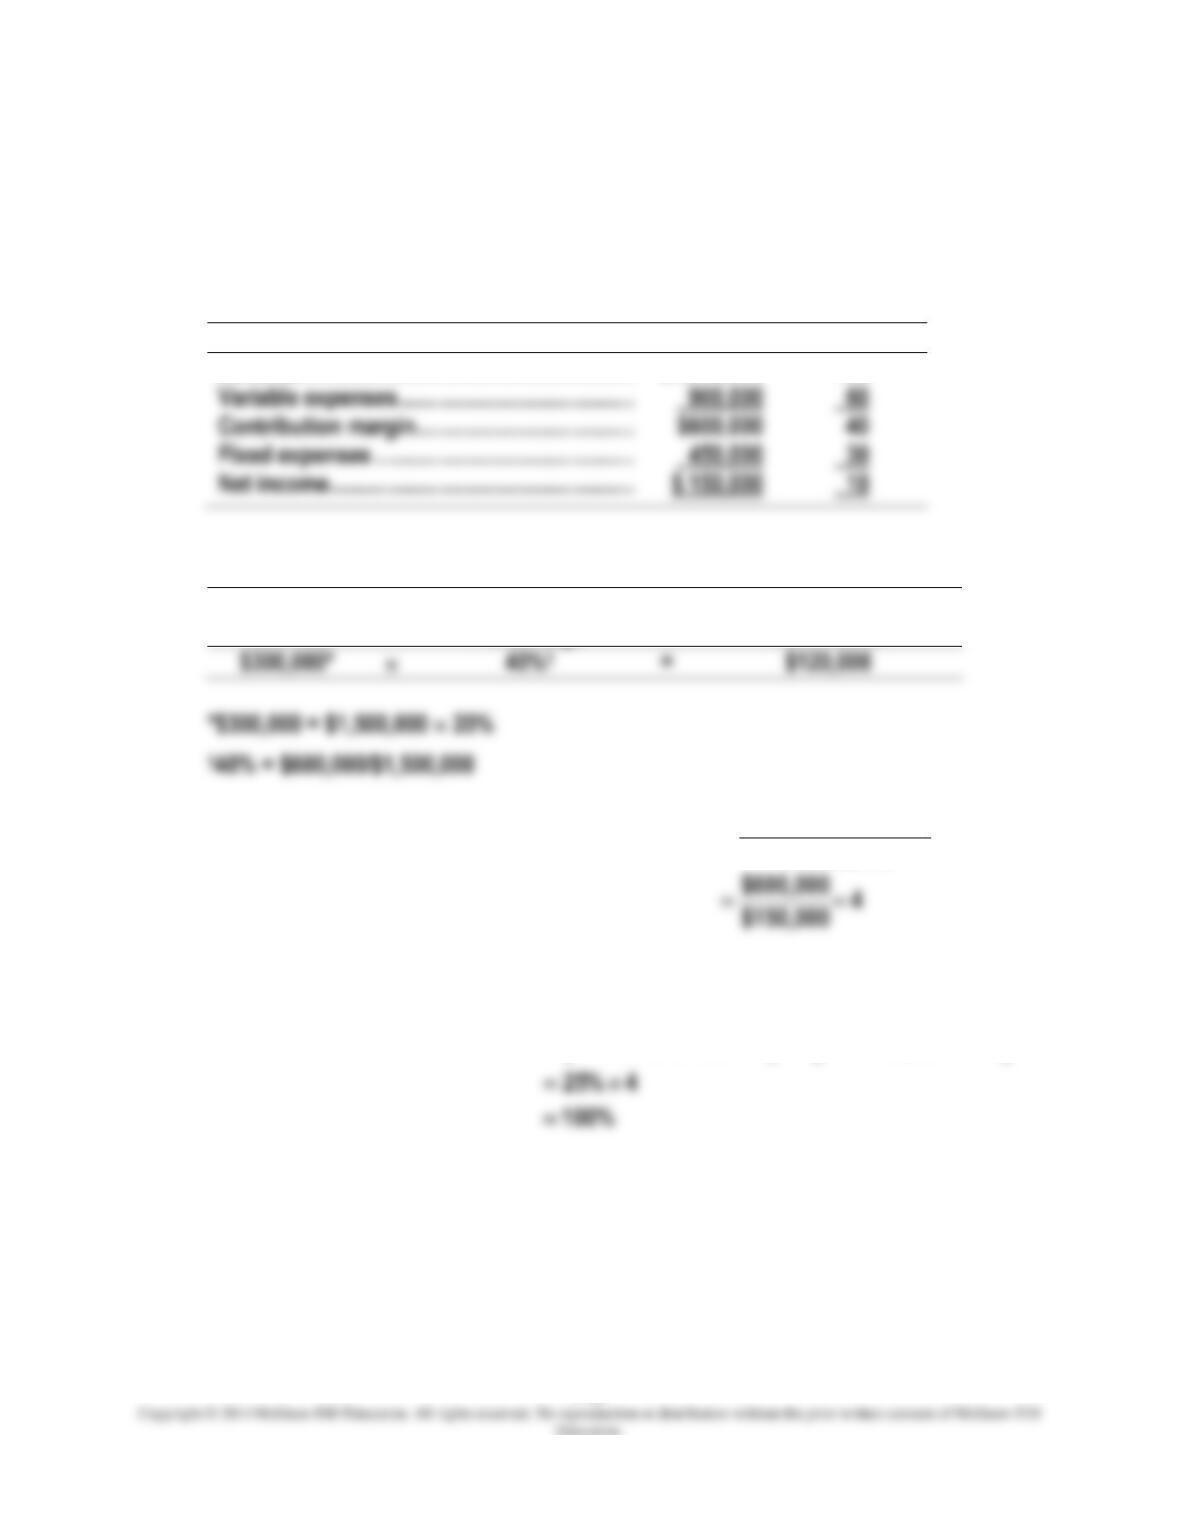
Variable expenses ……………………………………….
Contribution margin …………………………………….
$600,000
Fixed expenses …………………………………………..
2.
Decrease in
Revenue
Contribution Margin
Percentage
Decrease in
Net Income
3.
incomenet
margin oncontributi
)$1,500,000 of revenue(at factor leverage Operating
=
4.
factor
leverage operating
revenue in
increase percentage
incomenet in change Percentage
=
Chapter 07 – Cost-Volume-Profit Analysis
7-16
EXERCISE 7-32 (10 MINUTES)
Requirement (1)
Requirement (2)
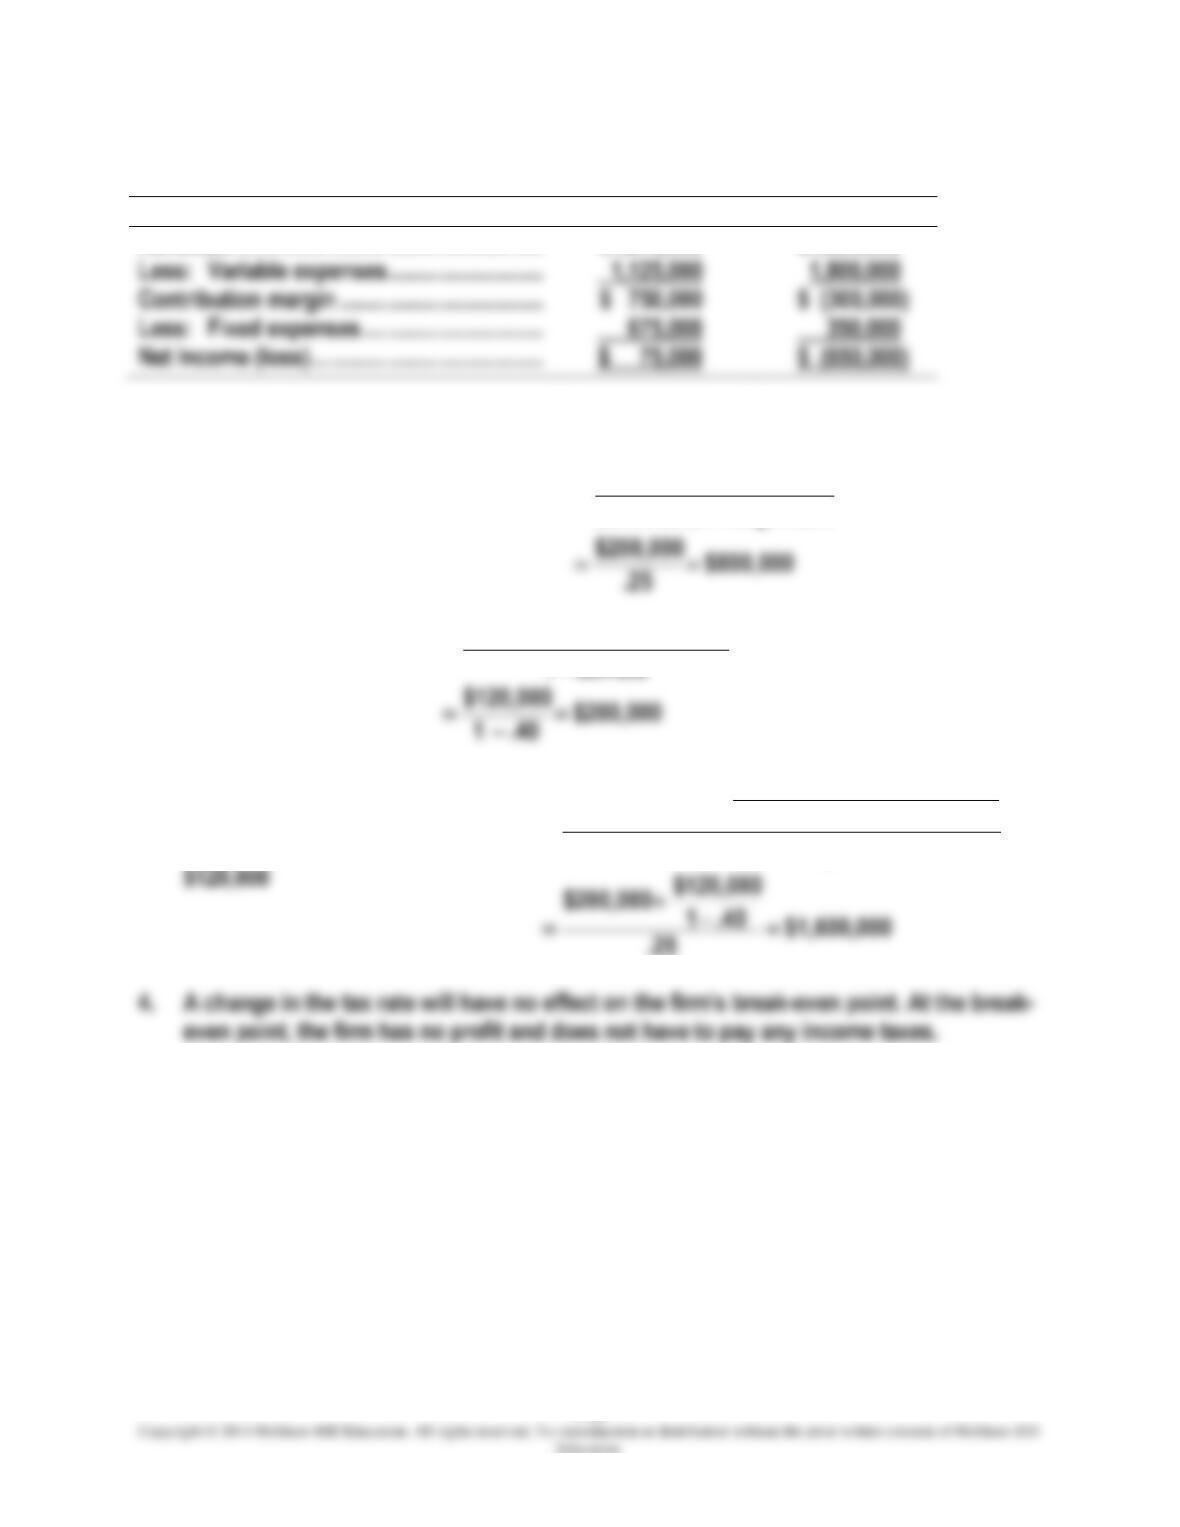
Revenue ……………………………………………….
$1,875,000
$1,500,000
Less: Variable expenses………………………
1,125,000
Contribution margin ……………………………..
$ 750,000
$ (300,000)
Less: Fixed expenses ………………………….
675,000
350,000
EXERCISE 7-33 (20 MINUTES)
1.
ratio margin oncontributi
expenses fixed
revenue service of volumeeven–Break
=
2.
rate tax 1
incomenet tax–aftertarget
income tax–beforeTarget
−
=
3.
Service revenue required to earn
target after-tax income of
ratio margin oncontributi
) (1
incomenet tax–aftertarget
expenses fixed
−
+
=t
Chapter 07 – Cost-Volume-Profit Analysis
7-17
SOLUTIONS TO PROBLEMS
PROBLEM 7-34 (30 MINUTES)
1.
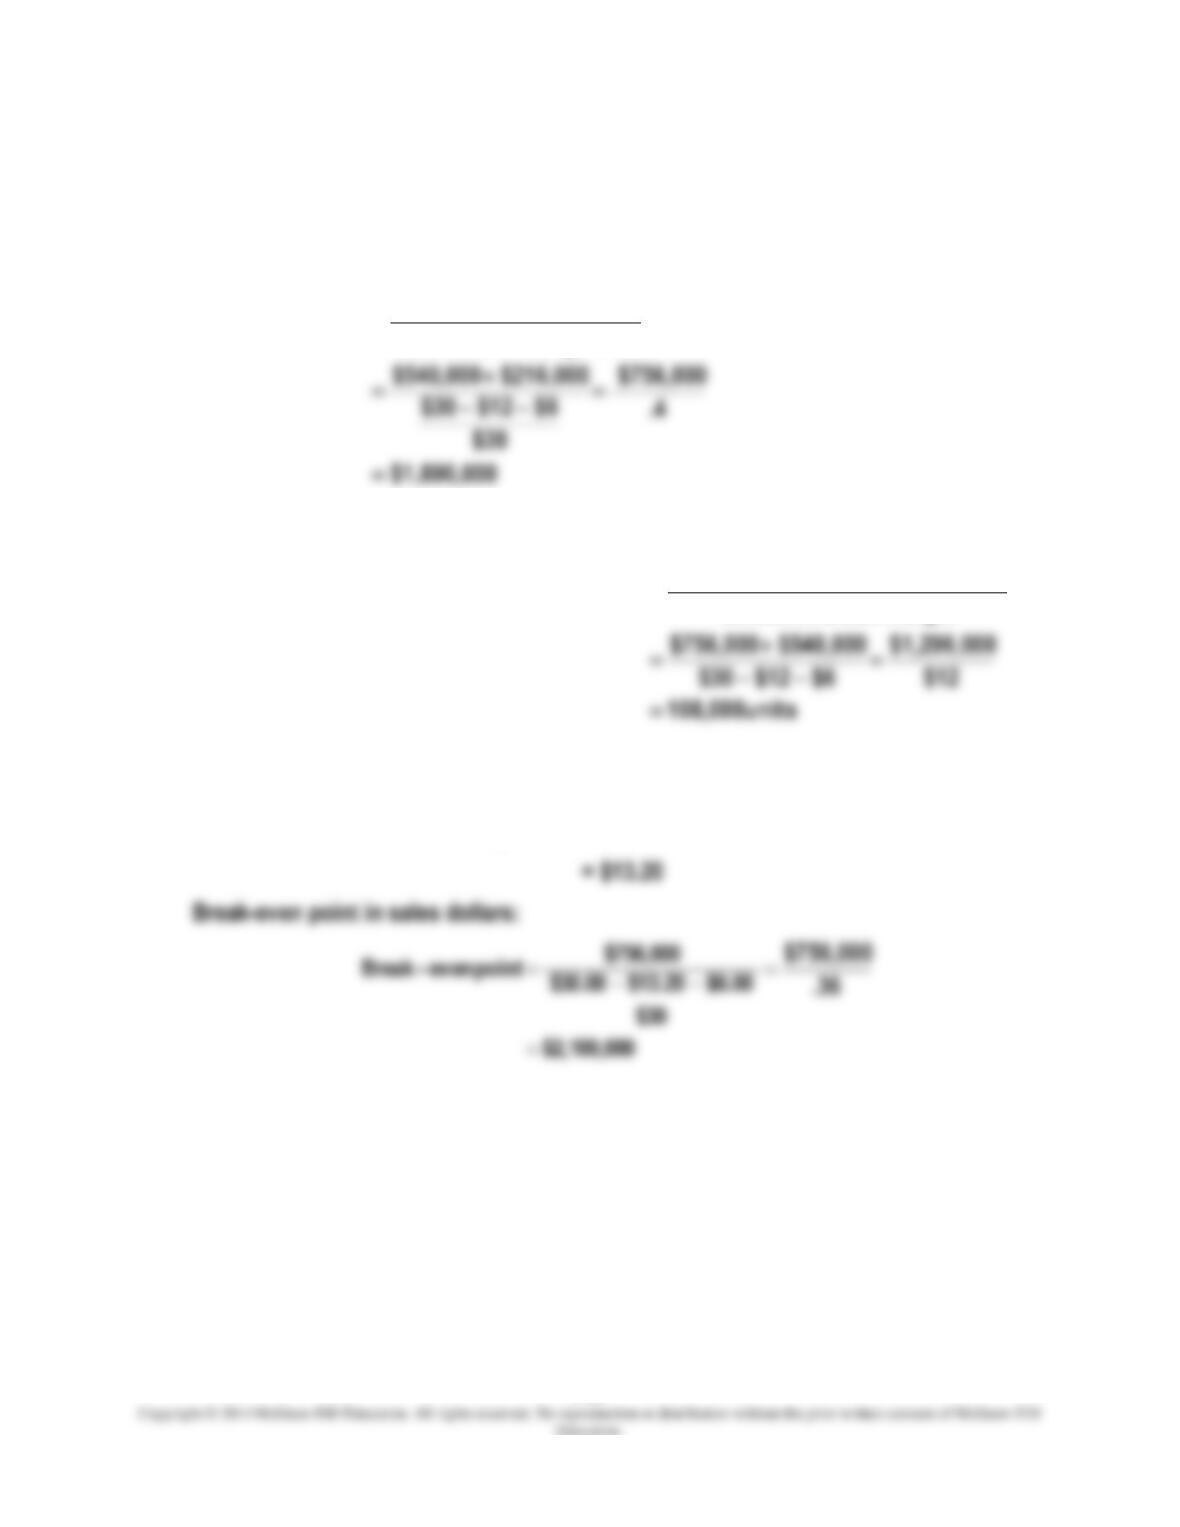
Break-even point in sales dollars, using the contribution-margin ratio:
ratio margin–oncontributi
expenses fixed
point even–Break
=
2.
Target net income, using contribution-margin approach:
margin oncontributiunit
incomenet target expenses fixed
$540,000 of income earn torequired units Sales
+
=
3.
New unit variable manufacturing cost
= $12 110%
Chapter 07 – Cost-Volume-Profit Analysis
7-18
PROBLEM 7-34 (CONTINUED)
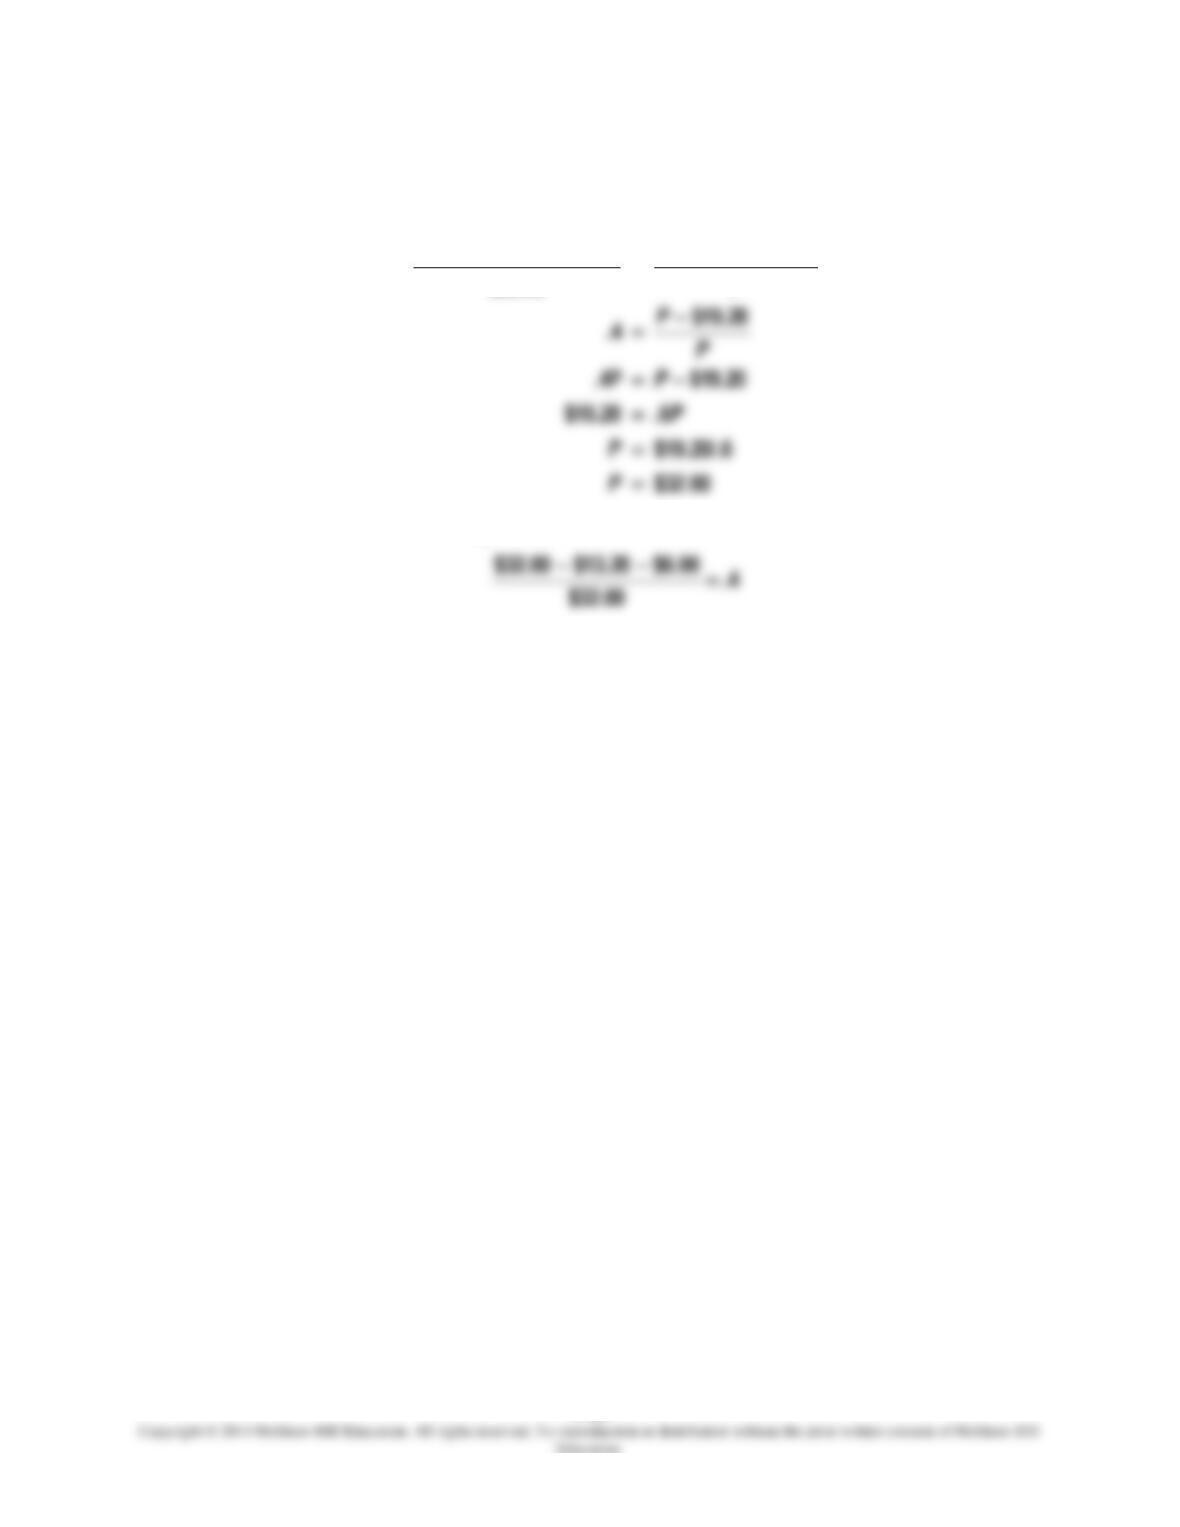
4.
Let P denote the selling price that will yield the same contribution-margin ratio:
$6.00 $13.20
$30.00
$6.00 $12.00 $30.00
−−
=
−−
P
P
Check: New contribution-margin ratio is:
Chapter 07 – Cost-Volume-Profit Analysis
7-19
PROBLEM 7-35 (30 MINUTES)
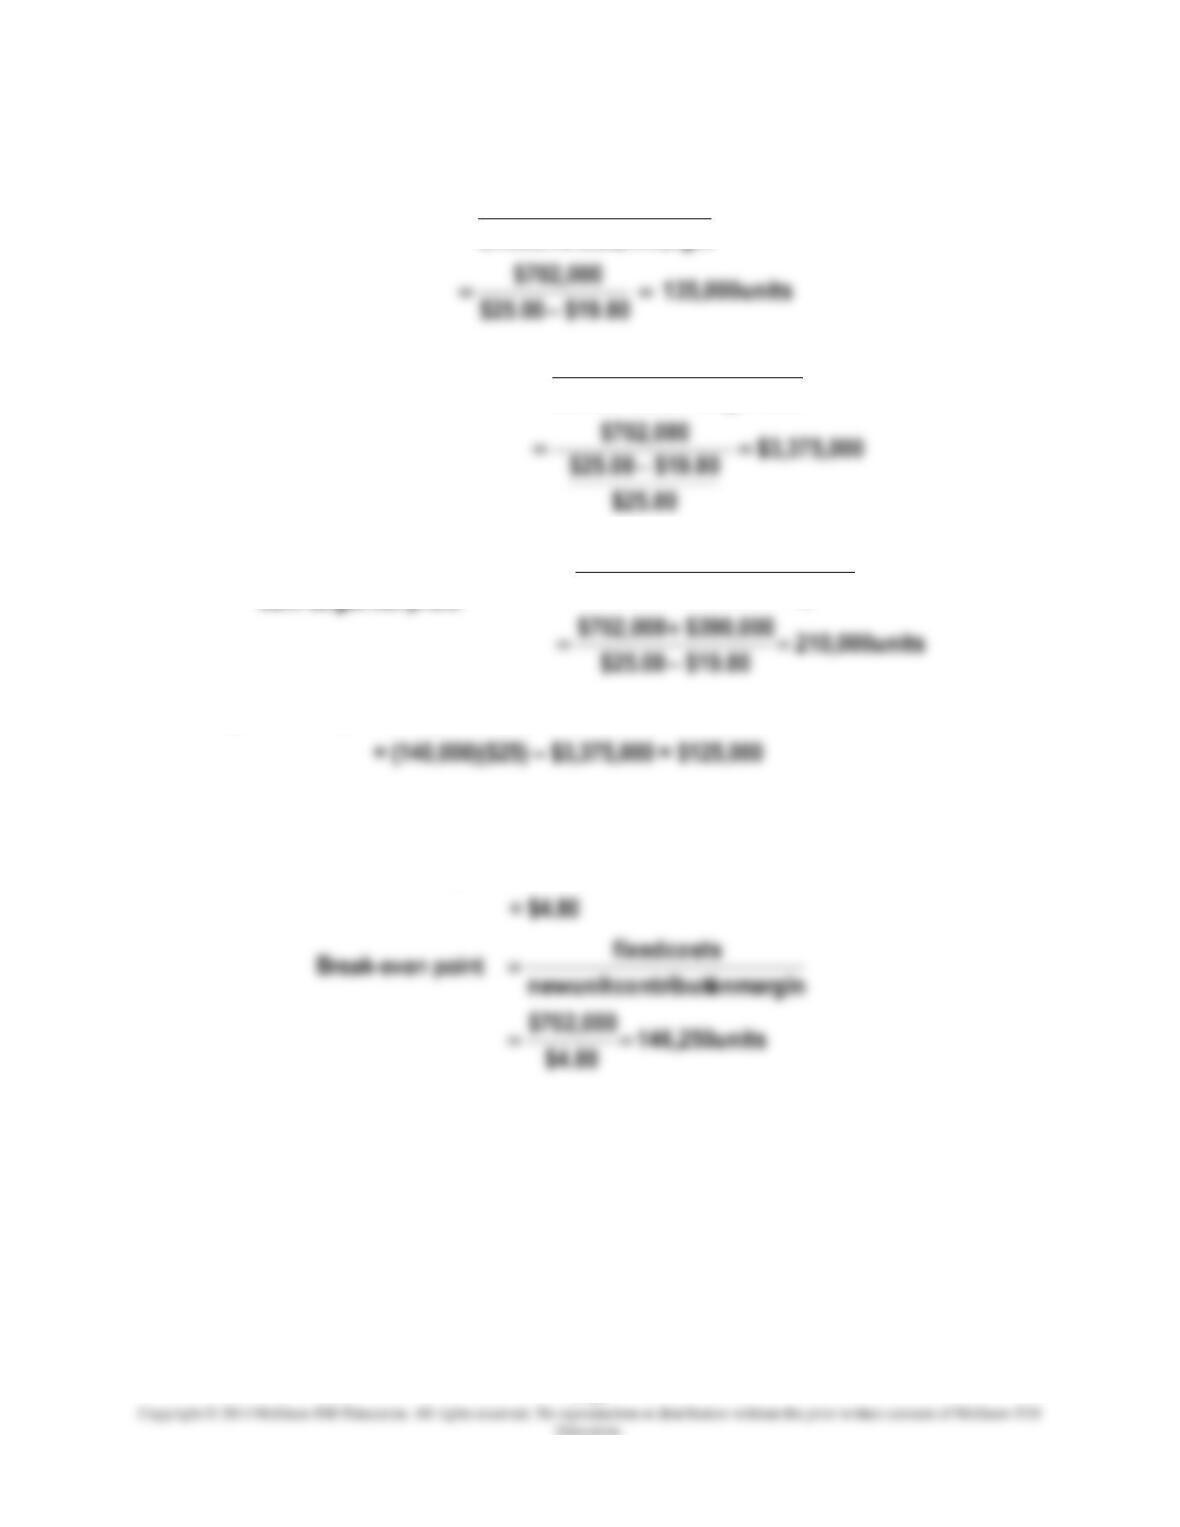
1.
margin oncontributiunit
costs fixed
units) (inpoint even–Break
=
2.
ratio margin–oncontributi
cost fixed
dollars) sales (inpoint even–Break
=
3.
Number of sales units required to
earn target net profit
margin oncontributiunit
profitnet target costs fixed
+
=
4.
Margin of safety
= budgeted sales revenue – break-even sales revenue
= (140,000)($25) – $3,375,000 = $125,000
5.
Break-even point if direct-labor costs increase by 10 percent:
New unit contribution margin
= $25.00 – $8.20 – ($4.00)(1.10) – $6.00 – $1.60
Chapter 07 – Cost-Volume-Profit Analysis
7-20
PROBLEM 7-35 (CONTINUED)
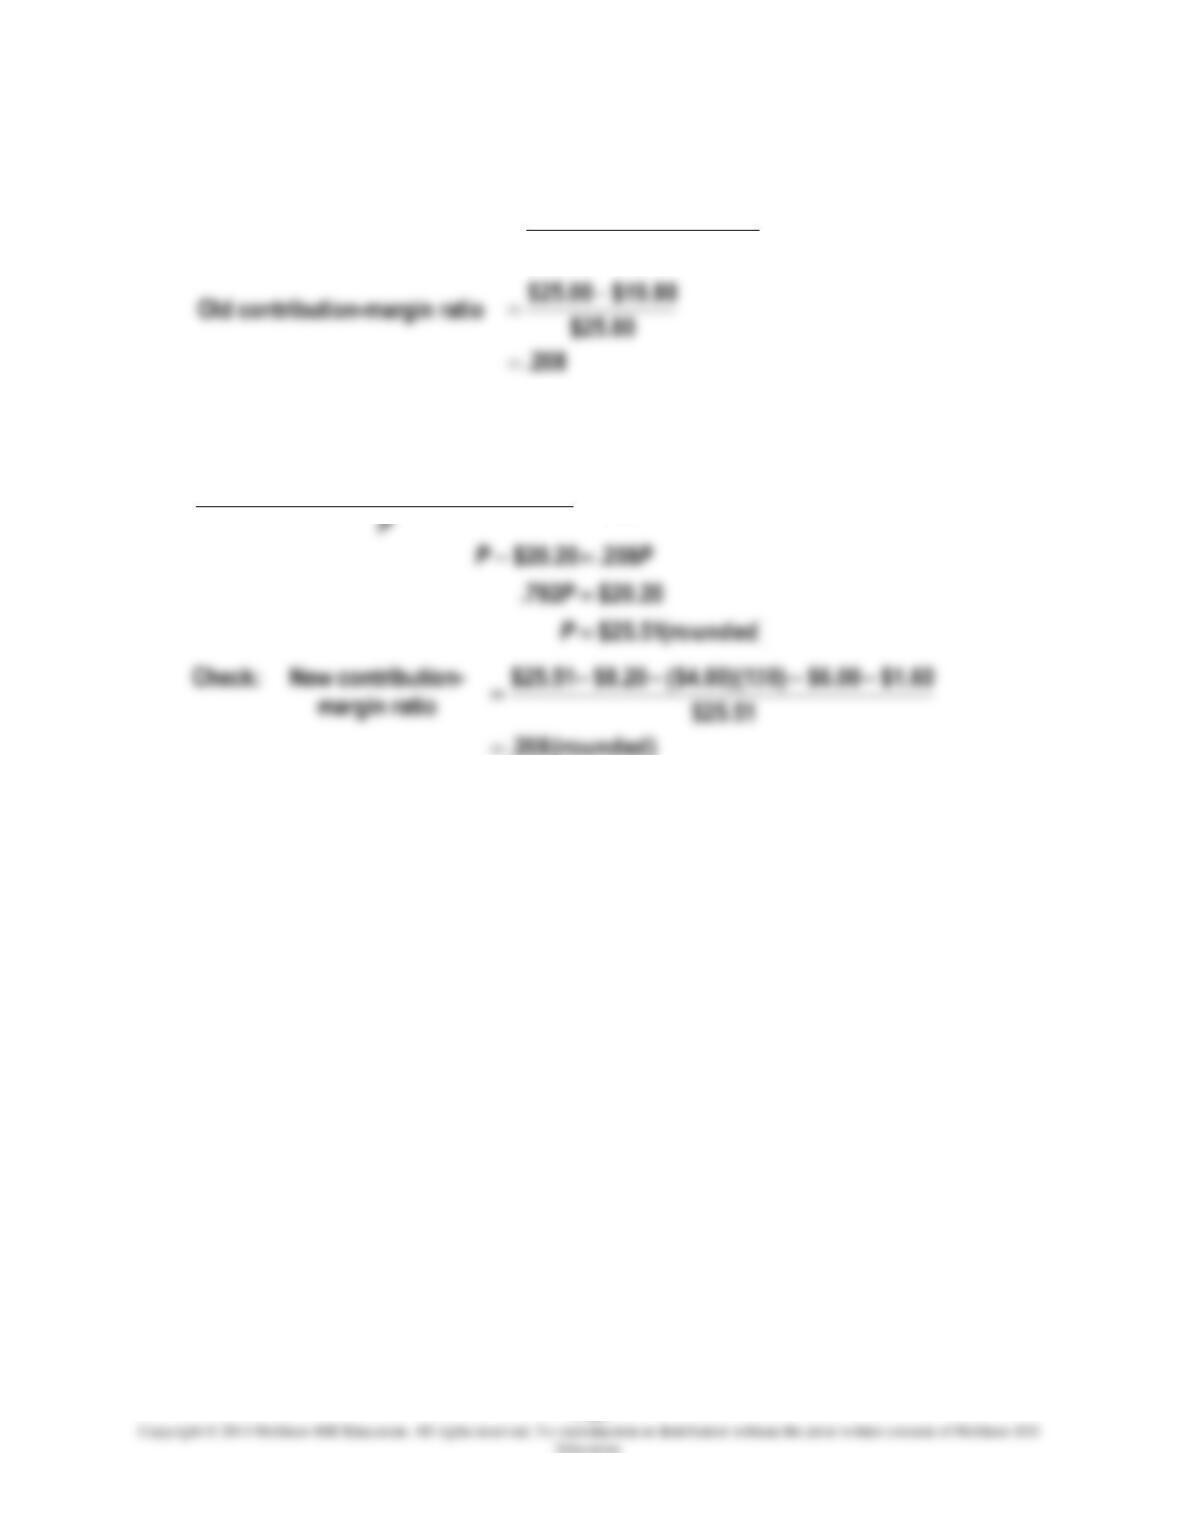
6.
Contribution-margin ratio
price sales
margin oncontributiunit
=
Let P denote sales price required to maintain a contribution-margin ratio of .208. Then
P is determined as follows:
.208
$1.60$6.0010)($4.00)(1.$8.20
=
−−−−
P
(rounded) .208
=