119
HYPOTHESIS TESTING:
ONE SAMPLE
INFERENCE
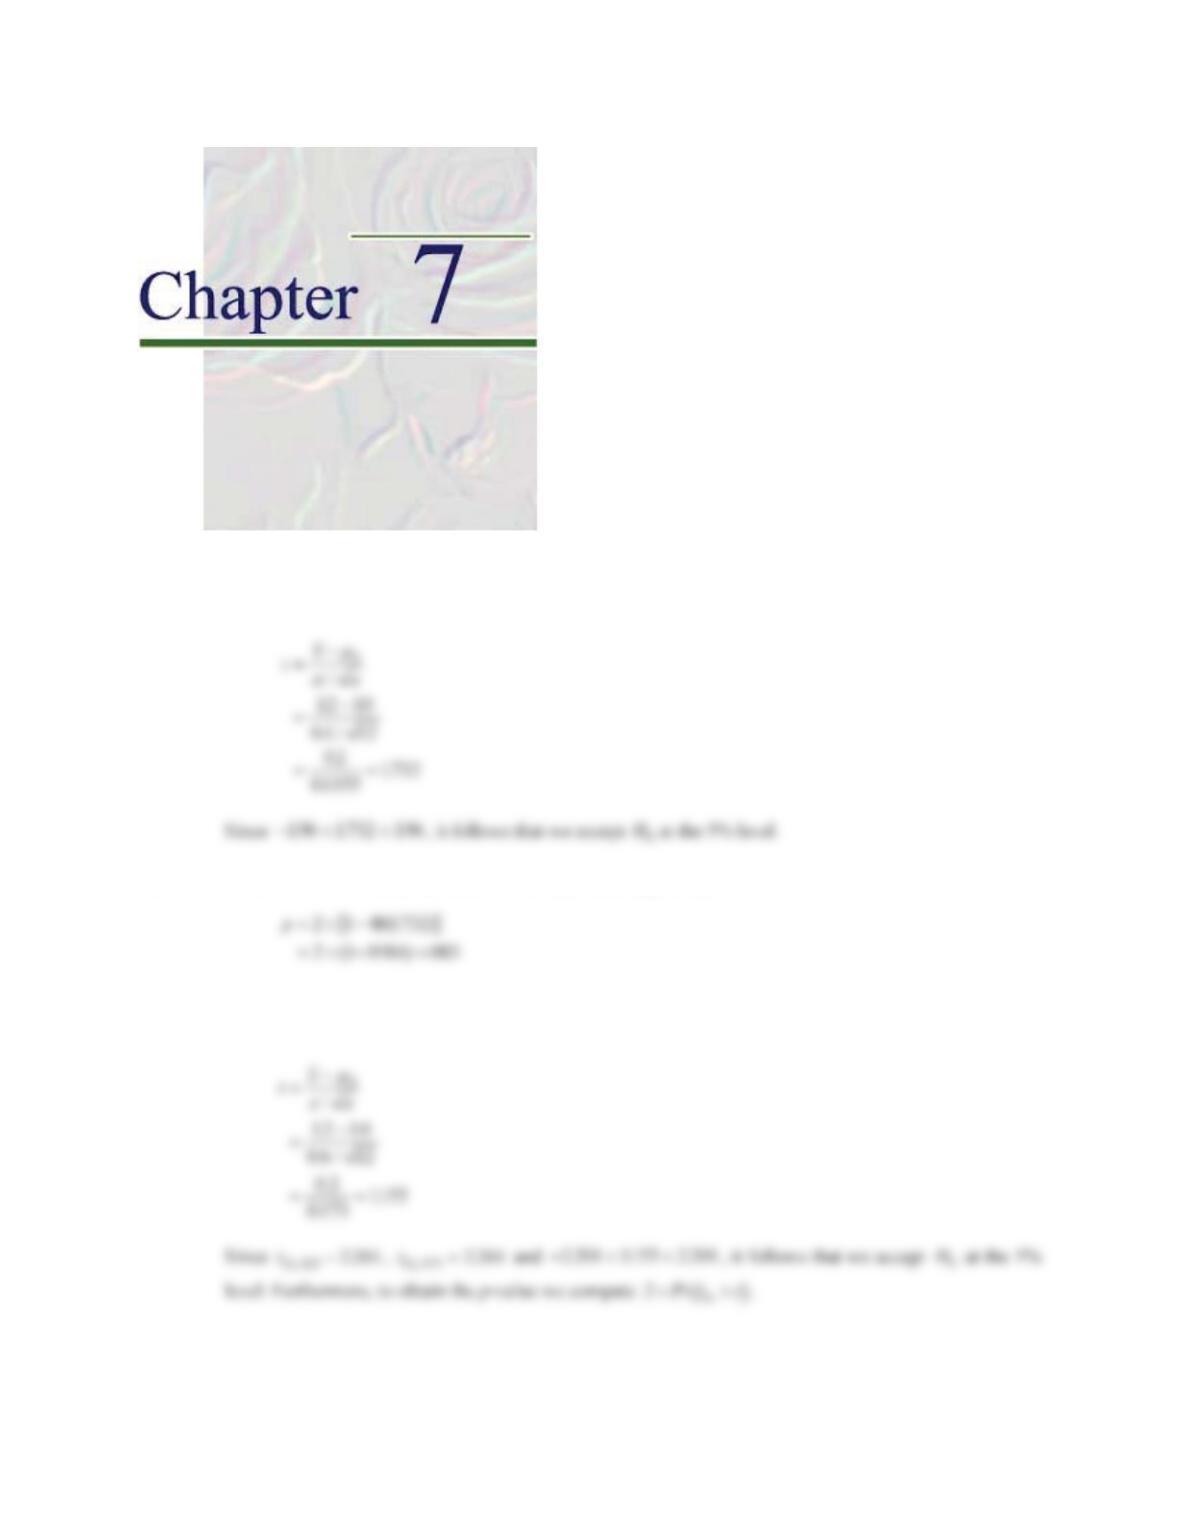
7.1 We test the hypothesis H010:.
P
versus H110:.
P
z, where
V
04. under either hypothesis. We use the
one-sample z-test. The rejection region is defined by zz
..
025 196 or zz!
..
975 196 , where
7.2 Since this is a two-sided test and z!0, the p-value is given by
7.3 We use a one-sample t test. The rejection region is defined by tt11 025,. or tt!11 975,. . We have the test
statistic
P
120 CHAPTER 7/HYPOTHESIS TESTING: ONE SAMPLE INFERENCE
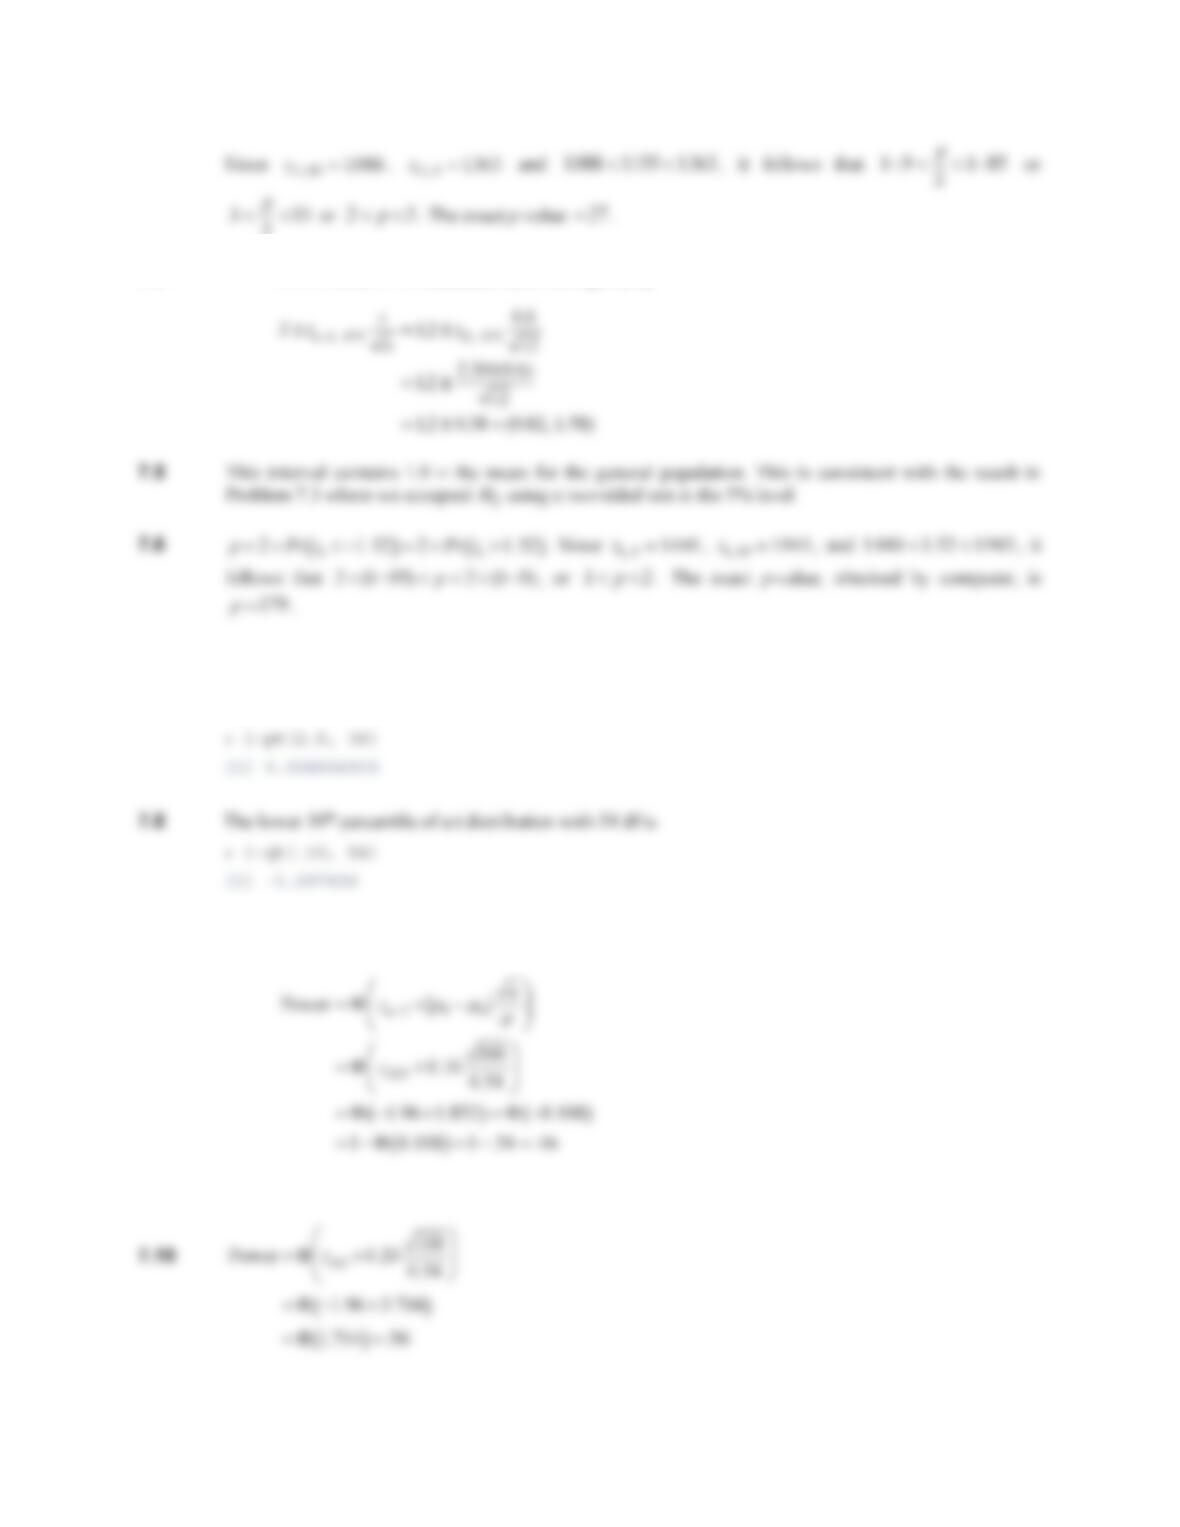
7.4 A two-sided 95% confidence interval is given by
7.7 The probability that a t distribution with 36 df exceeds 2.5 is
Pr(t
36,.05
!2.5) 1P(t
36,.05
d2.5)
. In R, we
have:
7.9 We wish to test the hypothesis H00
:
P
P
versus H10
:
P
P
z. Use the following power formula:
Thus, the study has 46% power.
CHAPTER 7/HYPOTHESIS TESTING: ONE SAMPLE INFERENCE 121
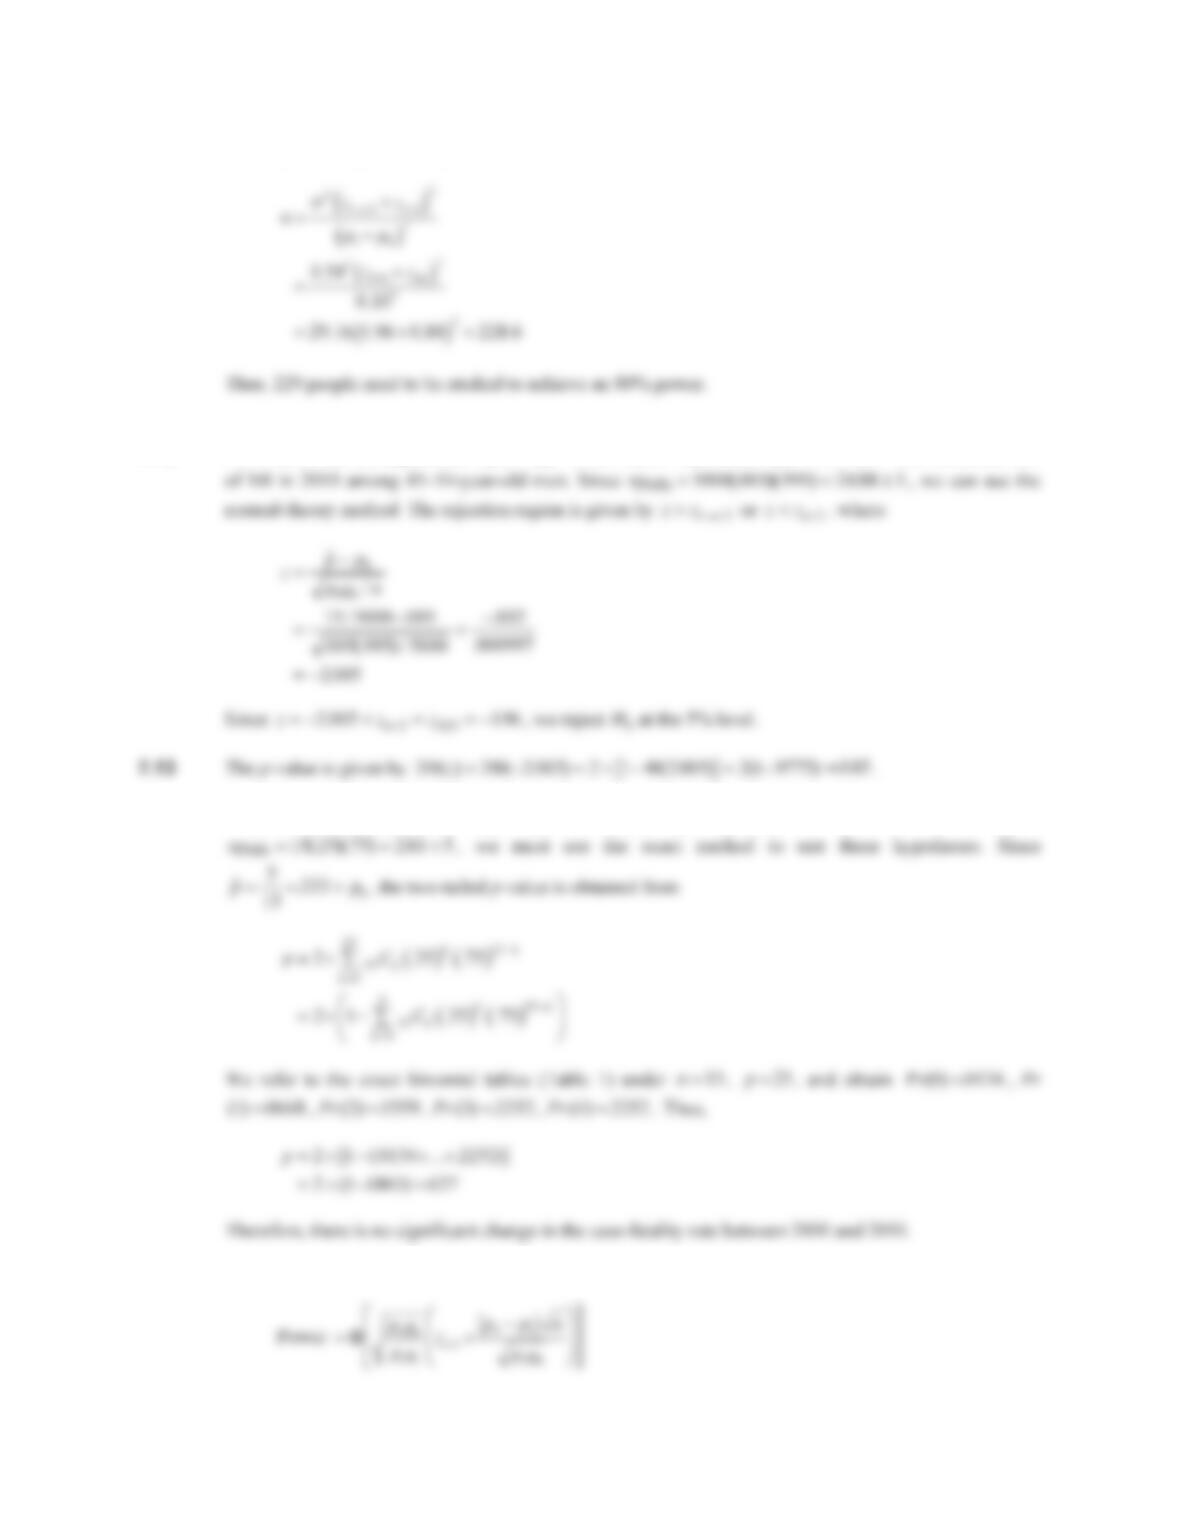
7.11 The required sample size is given by
7.12 We wish to test the hypothesis Hp p
00
: versus Hp p
10
:z, where p0005 ., p true incidence rate
7.14 We wish to test the hypothesis Hp p
00
: versus Hp p
10
:z, where p025 .. Since
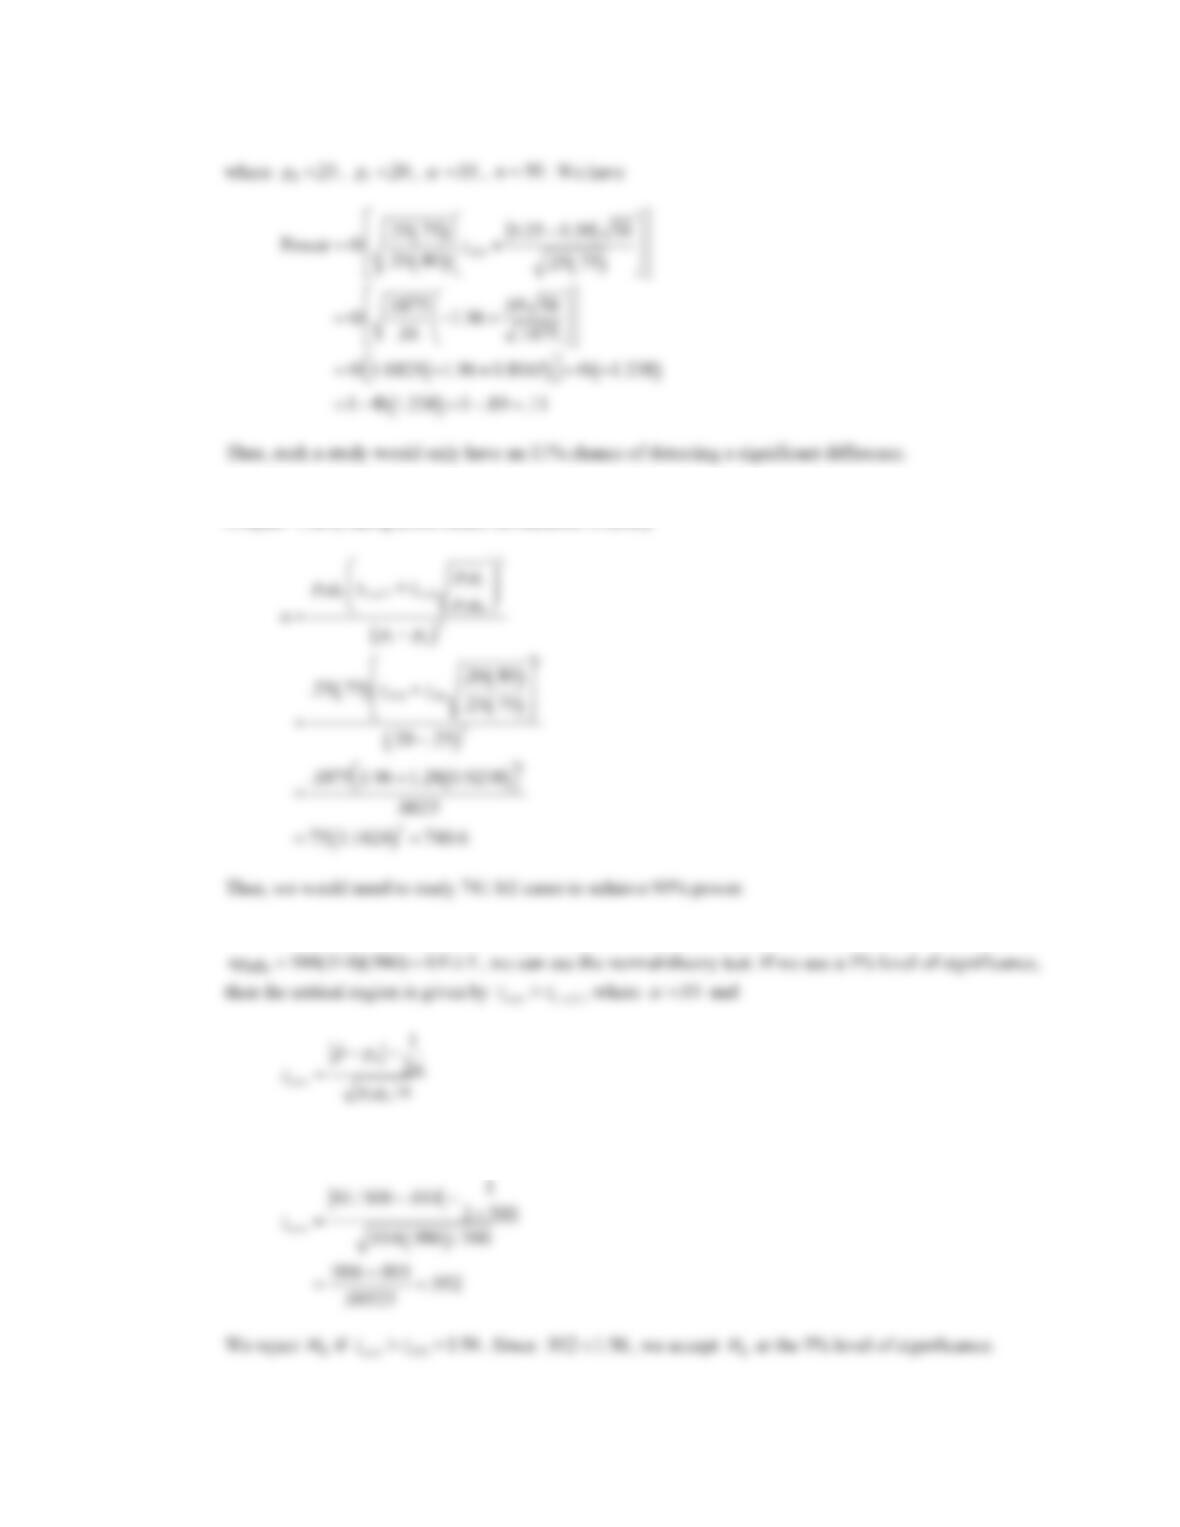
7.15 We use the power formula in Equation 7.32 (in Chapter 7, text) using a two-sided formulation whereby
122 CHAPTER 7/HYPOTHESIS TESTING: ONE SAMPLE INFERENCE
7.16 To compute the sample size needed to achieve 90% power, we use the formula in Equation 7.33 (in
Chapter 7, text) using a two-sided formulation whereby
7.17 We wish to test the hypothesis Hp p
00
: versus Hp p
10
:z, where p0014 ., n 500 . Since
In this example,
CHAPTER 7/HYPOTHESIS TESTING: ONE SAMPLE INFERENCE 123
7.19 We wish to test the hypothesis Hp p
00
: versus Hp p
10
:z, where p001 ., n 300 . Since
7.21 We wish to test the hypothesis Hp p
00
79:. versus Hp p
10
:z. Since np q
00 100 79)(.21 16 6 5 t(. ) .
, we can use the normal-theory method. The critical values are given by z..
975 196 , where we use a 5%
124 CHAPTER 7/HYPOTHESIS TESTING: ONE SAMPLE INFERENCE
7.26 We wish to test the hypothesis Hp p
00
04:. versus Hp
104:.!. Since np q
00 50 04 96 192 5 uu .. . ,
we cannot use the normal test, but instead must use the exact binomial test. The p-value is given by
7.27 Use a one-sample test for binomial proportions. We have the hypotheses
CHAPTER 7/HYPOTHESIS TESTING: ONE SAMPLE INFERENCE 125
7.28 We use the sample-size formula given in Equation 7.21 (Chapter 7, text). We have
7.29 We use the power formula for a one-sided test given in Equation 7.18 (Chapter 7, text), whereby
7.30 Let p true proportion of deaths due to lung cancer among workers in the chemical plant. We wish to
7.32 Since np q
00 20 12 88 2 1 5 uu .. . , we must use the exact test. Since ..pp ! 25 12
0, we have that
126 CHAPTER 7/HYPOTHESIS TESTING: ONE SAMPLE INFERENCE
7.33 We wish to test the hypothesis Hp p
00
: versus Hp p
10
:z, where p012 . . In this case,
7.34 If we exclude deaths due to IHD, then .p
19
19
12
12
.
.
7.35 We wish to test the hypothesis H00
:
P
P
versus H10
:
P
P
z, where
P
true mean daily iron intake for
P
7.36 We must use a one-sample t test. We reject H0 if tt
n
12,/
D
, or tt
n
!11 2,/
,
D
where tx
sn
P
0
/, and
P
D
CHAPTER 7/HYPOTHESIS TESTING: ONE SAMPLE INFERENCE 127
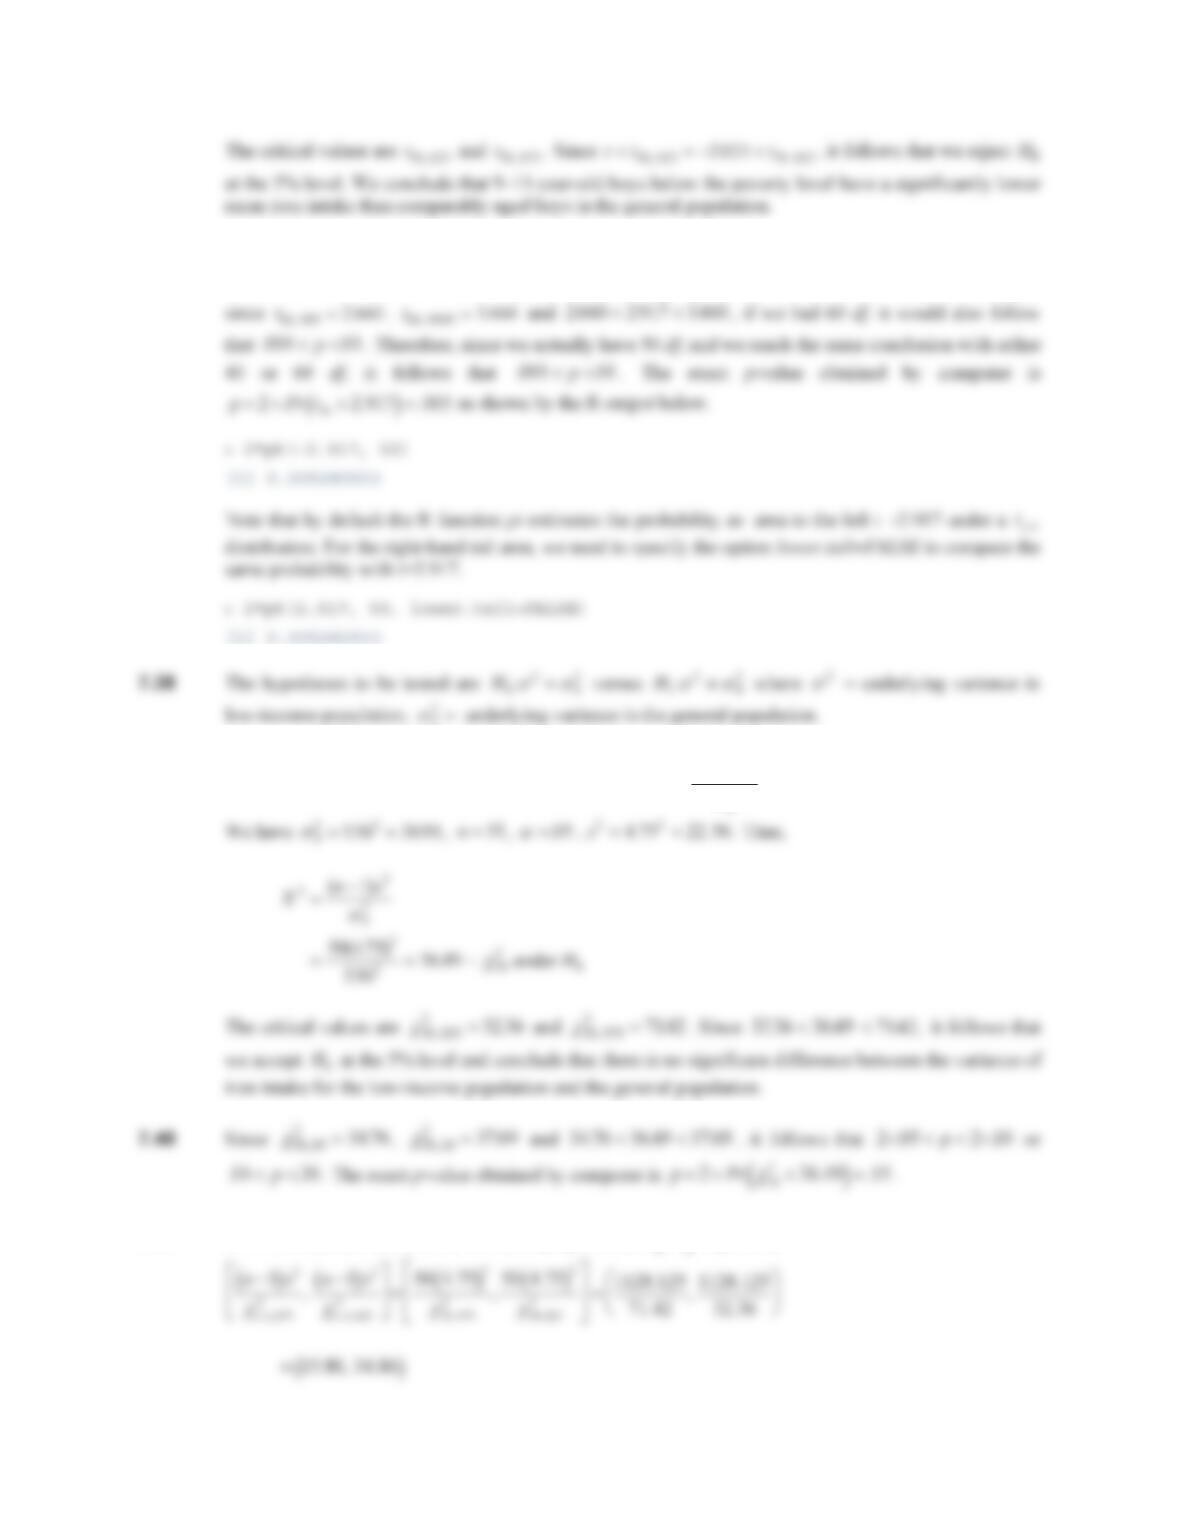
7.37 To obtain the p-value, we must compute
2uPr t
50
!2.917
. Since t40 995 2 704
,. . , t40 9995 3551
,. . and
2 704 2 917 3551...
, if we had 40 df, then 2 1 9995 2u
.pu
1995. or ..001 01p. Similarly,
0
7.39 We use a one-sample chi-square test. We reject H0 if Xns
n
2
2
0
212
2
1
VF
D
,/ or Xn
2
11 2
2
!
F
D
,/
.
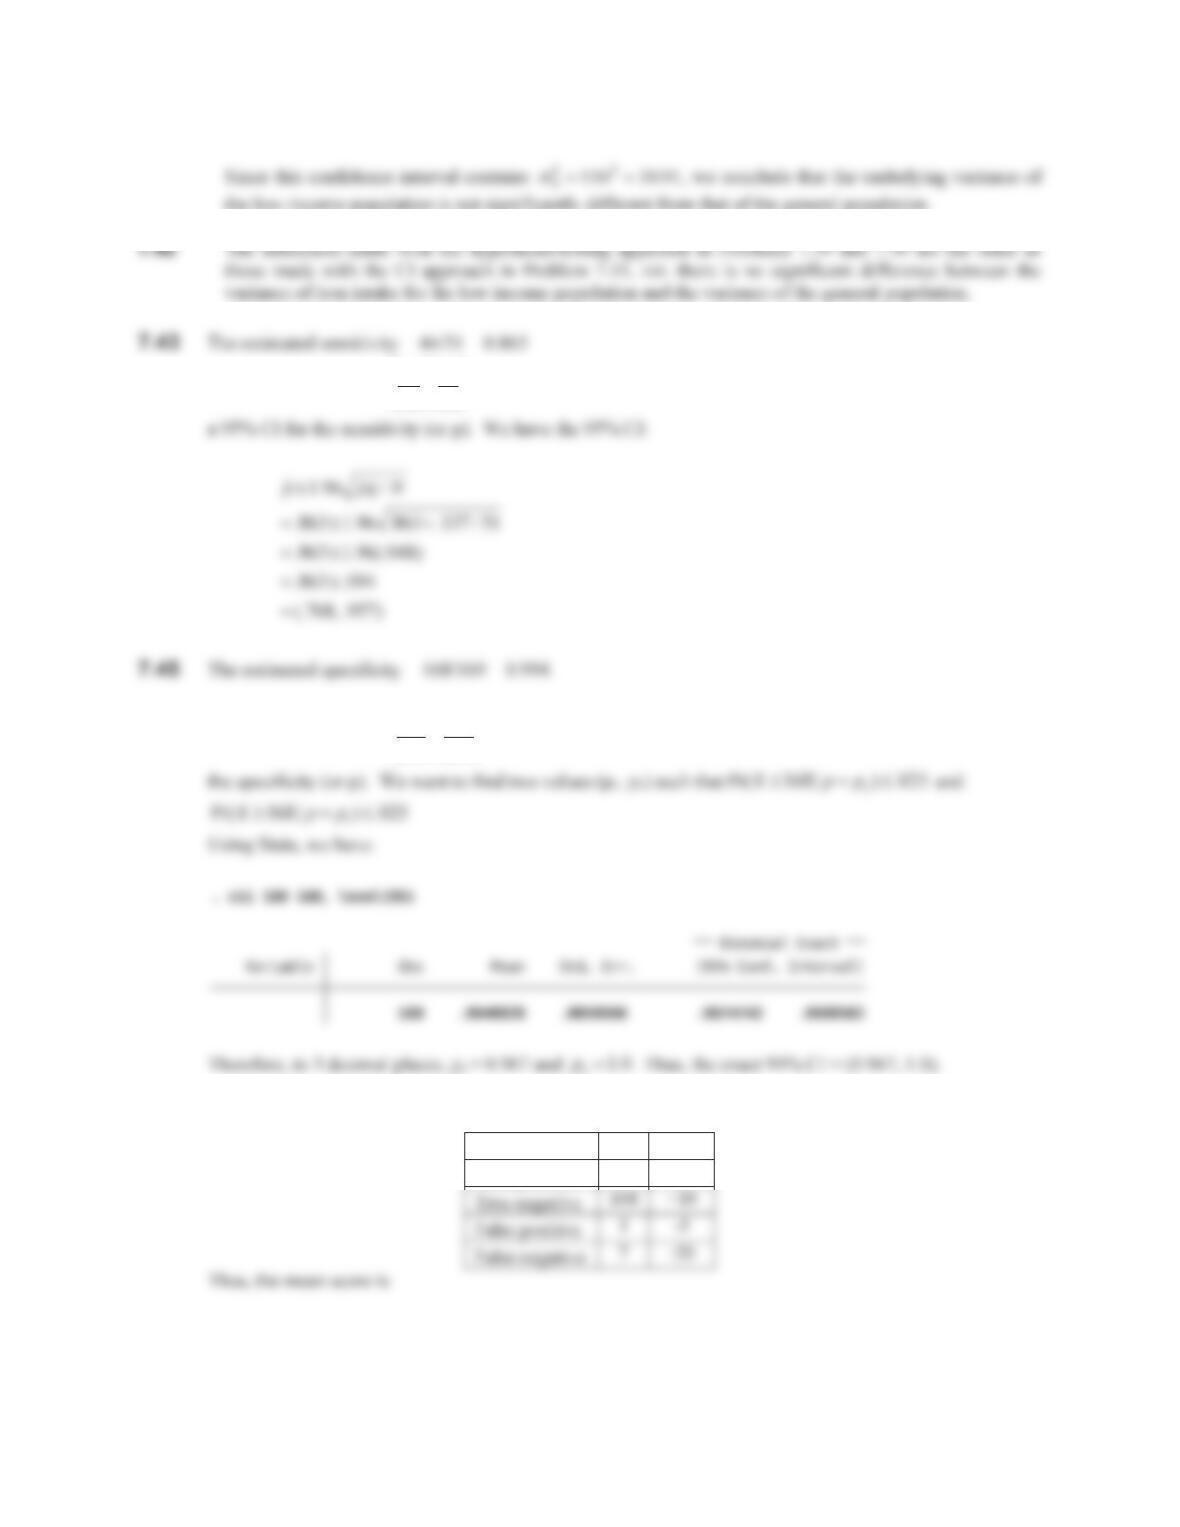
7.41 A 95% confidence interval for the underlying variance
V
2
is given by
128 CHAPTER 7/HYPOTHESIS TESTING: ONE SAMPLE INFERENCE
the low-income population is not significantly different from that of the general population.
7.44We have that
Nˆ
pˆ
q 51 44
51
§
©
¨
·
¹
¸7
51
§
©
¨
·
¹
¸ 6.04 t5
. Thus, we can use the large sample method to estimate
7.46In this case,
Nˆ
pˆ
q 169 168
169
§
©
¨
·
¹
¸1
169
§
©
¨
·
¹
¸ 0.99 5
. Thus, we must use the exact method to obtain a 95% CI for
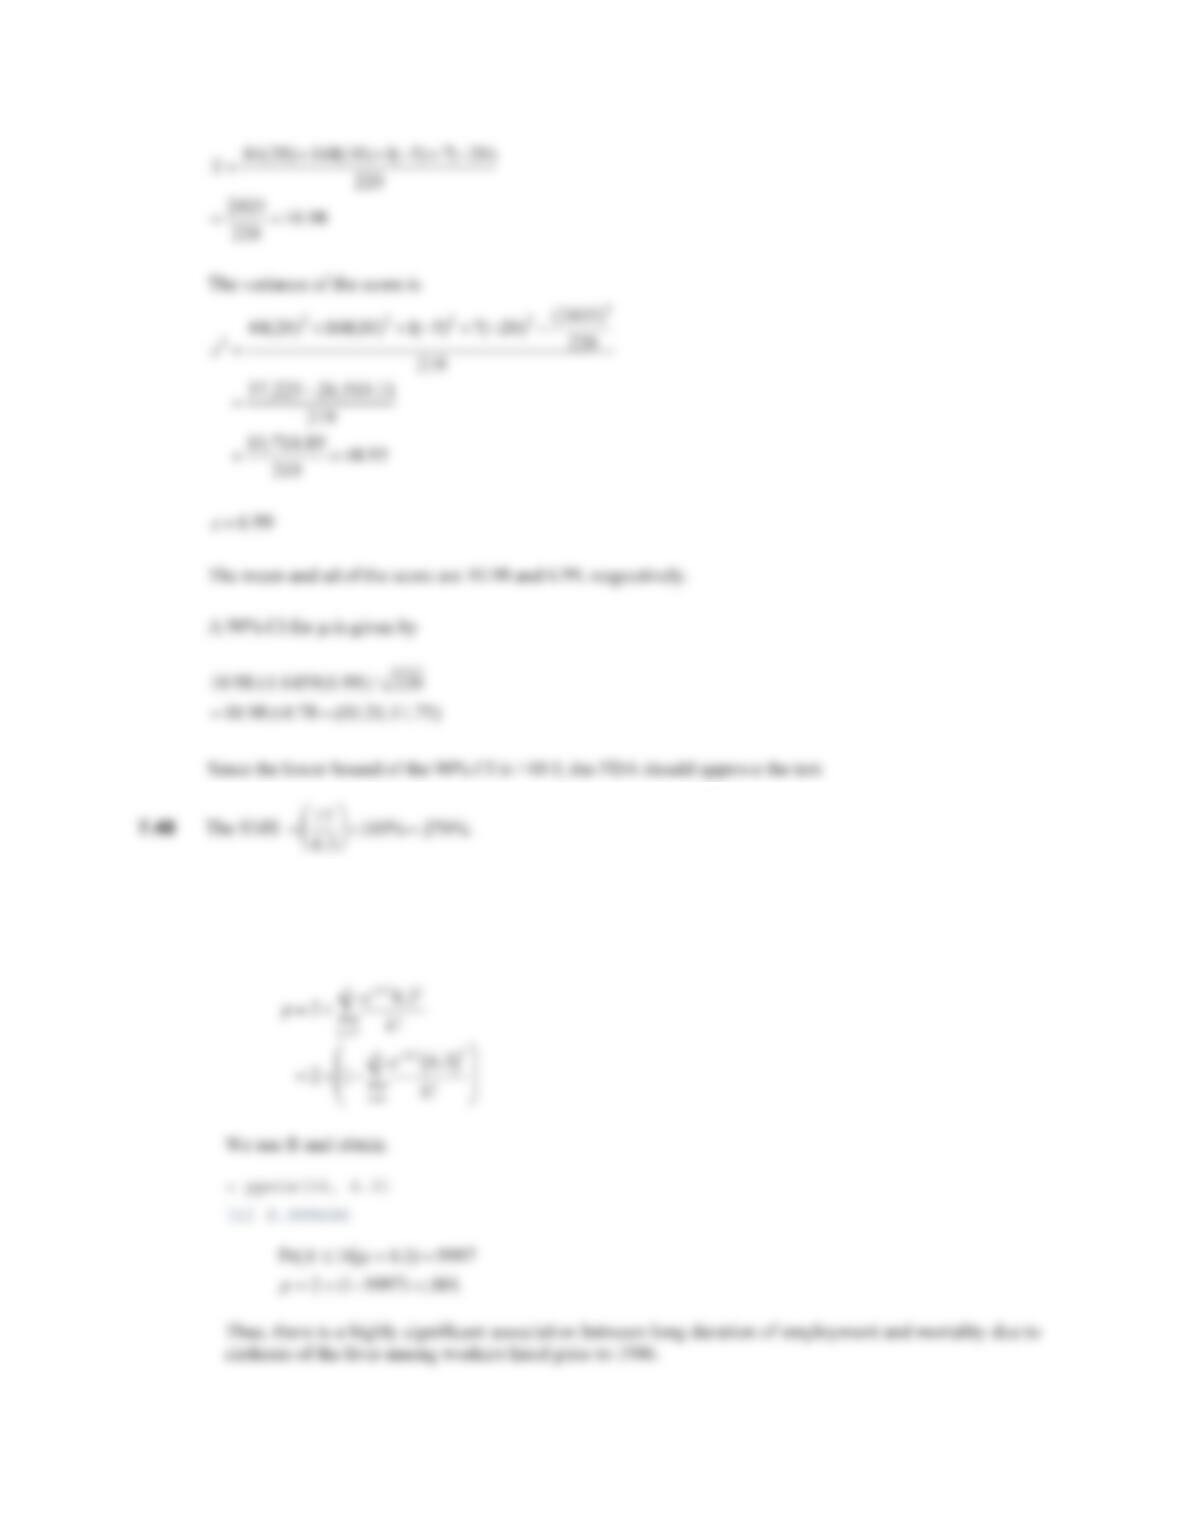
7.47We have the following 4 outcomes:
N Score
True positive 44 +20
CHAPTER 7/HYPOTHESIS TESTING: ONE SAMPLE INFERENCE 129
7.49 Since the expected number of events is 10 , we must use exact methods. We refer to Table 8 in the
Appendix and note that if
x
17, then a 95% CI for
P
is given by (9.90, 27.22). Since this interval
excludes 6.3, we reject H0 at the 5% level. To obtain an exact p-value, we could compute
P
130 CHAPTER 7/HYPOTHESIS TESTING: ONE SAMPLE INFERENCE
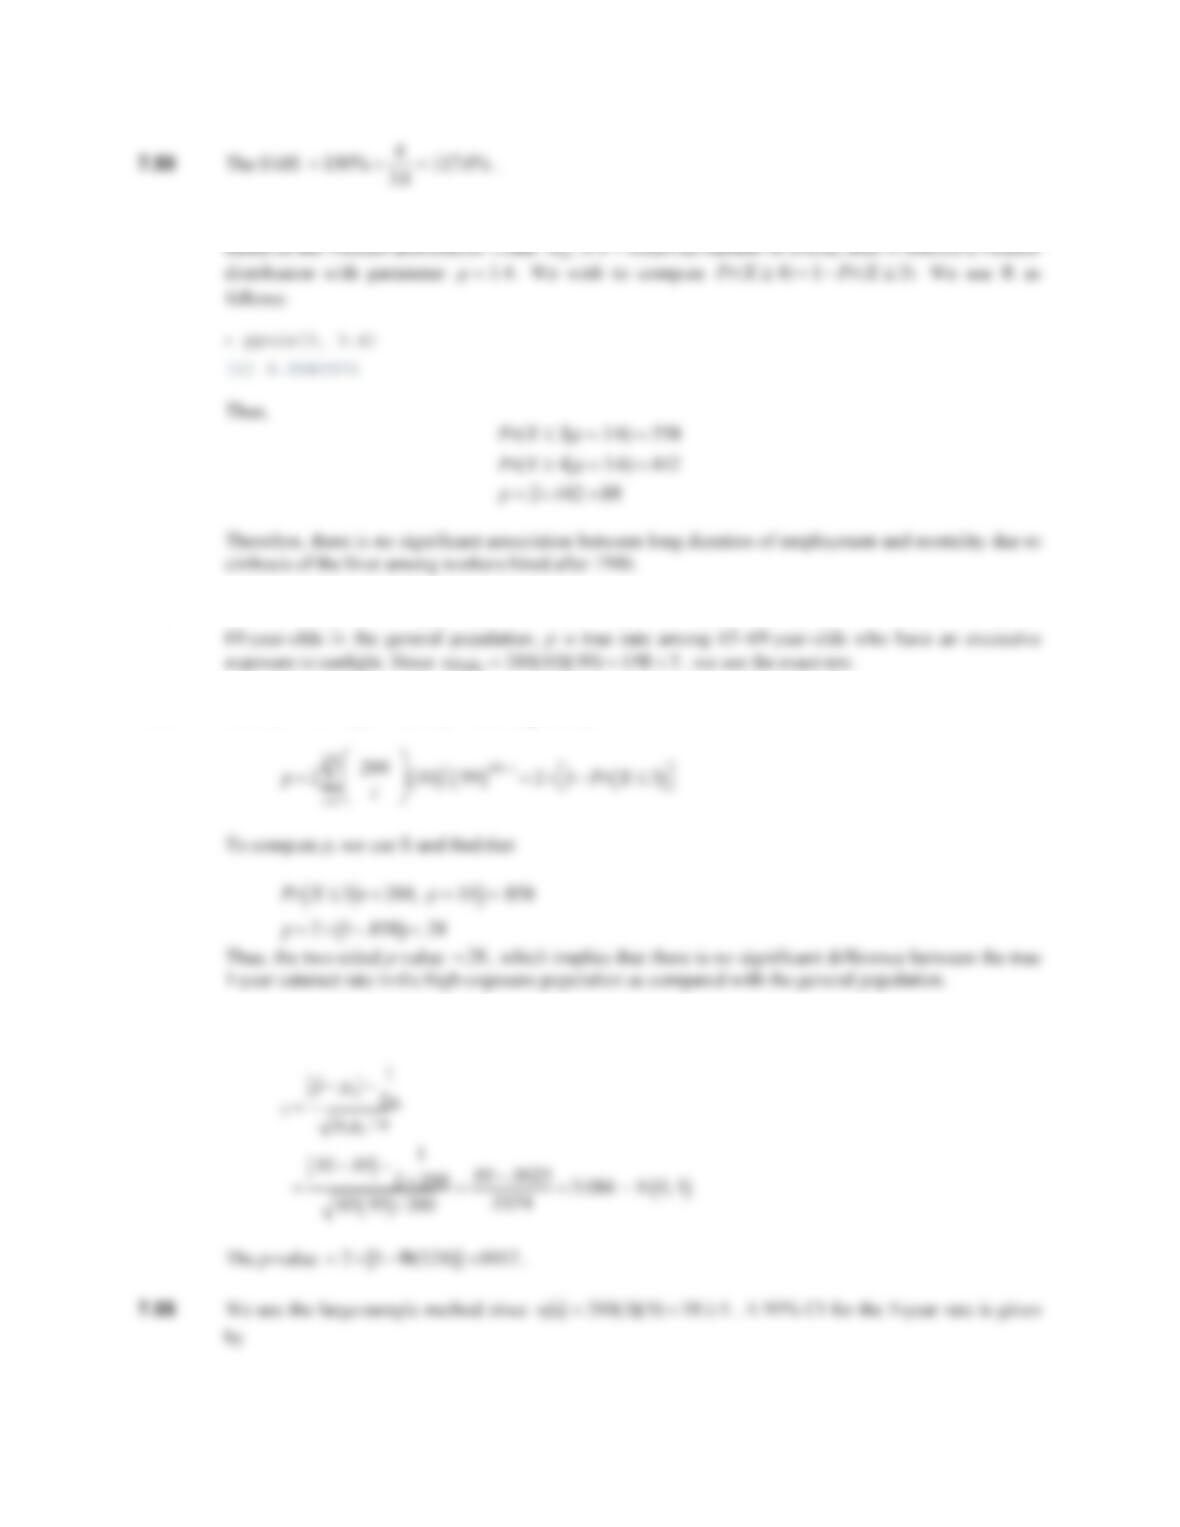
7.51 Since the expected number of deaths is less than 5, we must use an exact method to assess significance
7.52 We test the hypothesis Hp p
00
: versus Hp p
10
:z, where p0 true 1-year rate of cataract among 65
00 200 01 99 198 5
7.53 Since ..pp ! 02 01
0, the p-value is given by
7.54 Since np q
00 200 05 95 9 5 5 t
.. . , we can use the normal-theory method. We have the test statistic
CHAPTER 7/HYPOTHESIS TESTING: ONE SAMPLE INFERENCE 131
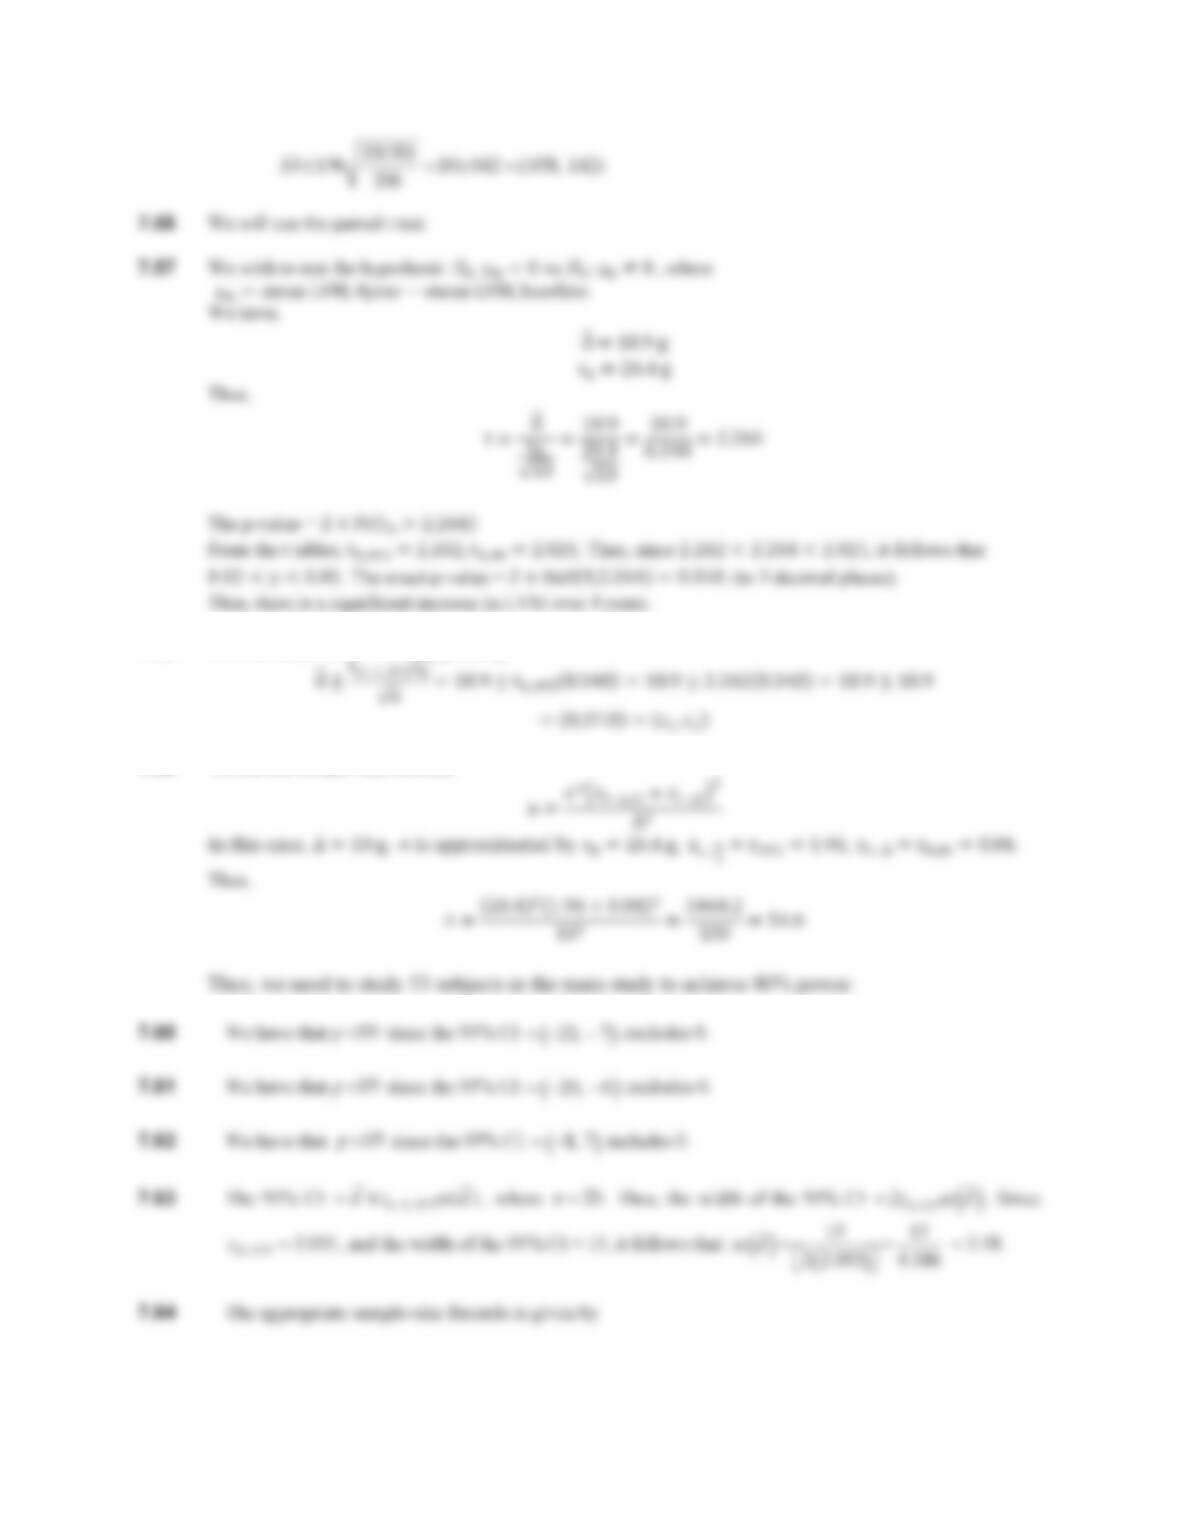
7.58 We first find a 95% CI for Ɋୢ given by:
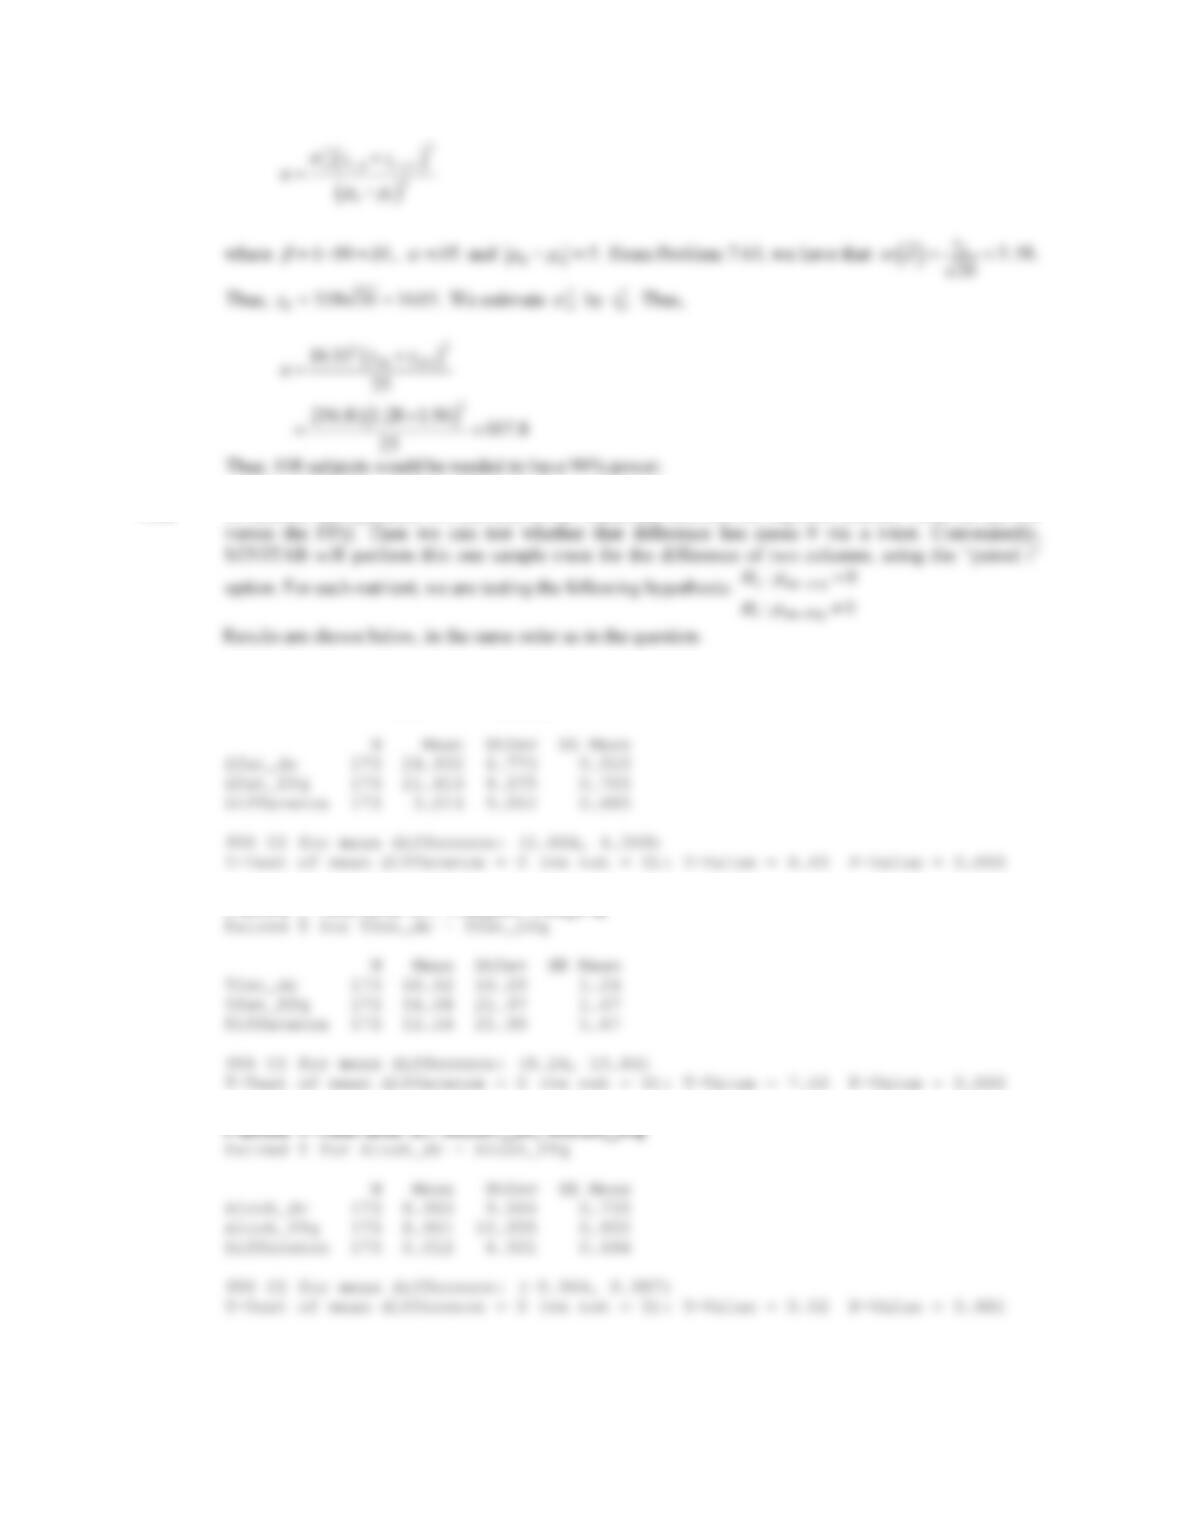
7.59 We use the sample size formula
132 CHAPTER 7/HYPOTHESIS TESTING: ONE SAMPLE INFERENCE
7.65 To address this question, we can look at the difference between the reported nutrient value on the DR
Paired T-Test and CI: Sfat_dr, Sfat_ffq
Paired T for Sfat_dr – Sfat_ffq
Paired T-Test and CI: Tfat_dr, Tfat_ffq
Paired T-Test and CI: Calor_dr, Calor_ffq
Paired T for Calor_dr – Calor_ffq