1. The receiving report should be reconciled to the initial purchase order and the vendor’s invoice
b
efore inventory purchases are recorded and paid. This procedure will verify that the inventory
received matches the type and quantity of inventory ordered. It also verifies that the vendor’s
invoice is charging the company for the actual quantity of inventory received at the agreed-
upon price.
4. a. LIFO c. LIFO
b. FIFO d. FIFO
5. FIFO.
6. LIFO. In periods of rising prices, the use of LIFO will result in the lowest net income and thus the
lowest income tax expense.
7. The merchandise should be valued using the lower of its cost of $1,350 or its market (net realizable)
value of $1,295 ($1,475
–
$180). Thus, the merchandise should be valued at its market value of
10. Manufacturer’s. The manufacturer retains title until the goods are sold. Thus, any unsold
merchandise at the end of the year is part of the manufacturer’s (consignor’s) inventory, even
though the merchandise is in the hands of the retailer (consignee).
CHAPTER 7
INVENTORIES
DISCUSSION QUESTIONS
CHAPTER 7 Inventories
PE 7-1A
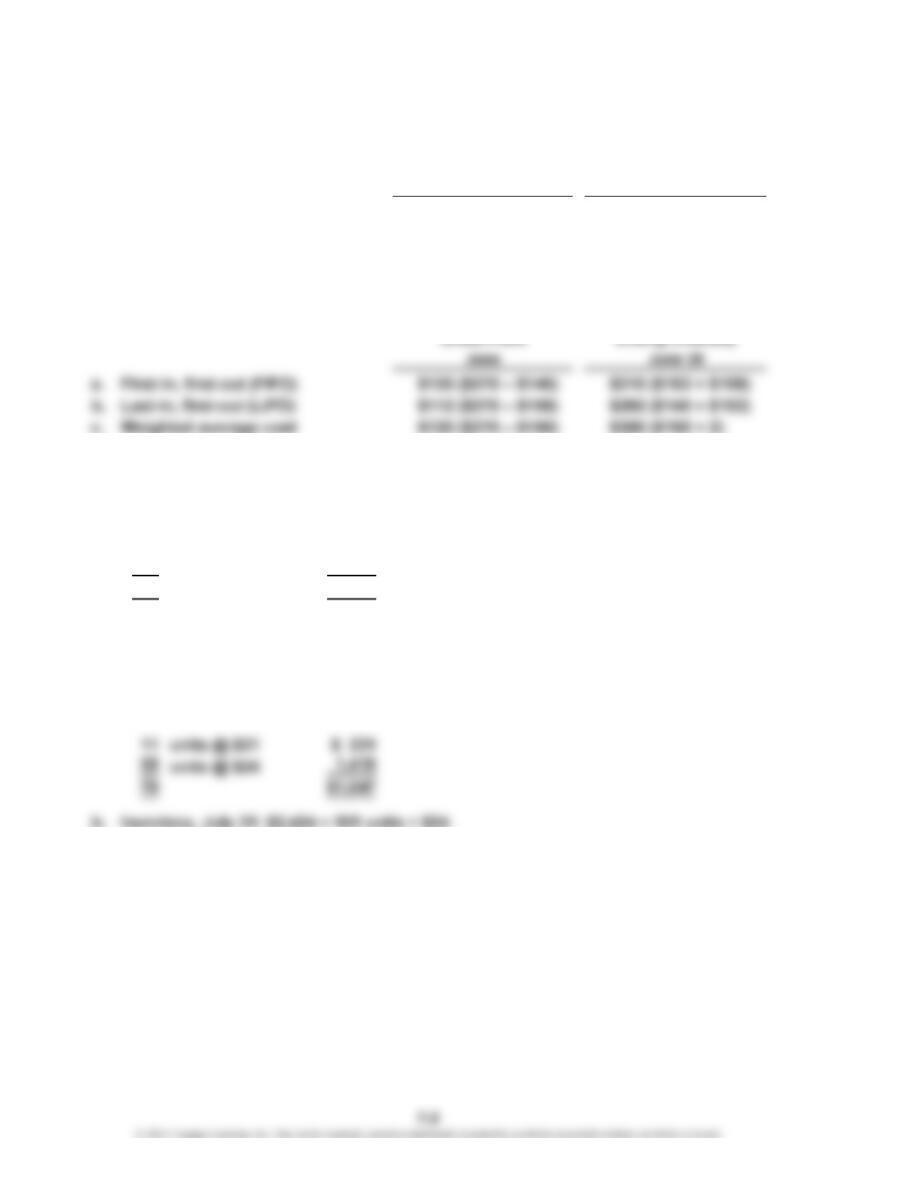
a. First-in, first-out (FIFO)
b. Last-in, first-out (LIFO)
c. Weighted average cost
PE 7-1B
PE 7-2A
a. Cost of merchandise sold (March 25):
60 units @ $7 $ 420
280 units @ $8 2,240
340 $2,660
b. Inventory, March 31: $1,040 = 130 units × $8
PE 7-2B
a. Cost of merchandise sold (July 24):
$164 ($81 + $83)$56 ($132 – $76)
$157 ($76 + $81)
$160 ($80 × 2)
$49 ($132 – $83)
$52 ($132 – $80)
PRACTICE EXERCISES
Gross Profit
April
Ending Inventory
April 30
CHAPTER 7 Inventories
PE 7-3A
a. Cost of merchandise sold (September 27):
$27,300 = (105 units × $260)
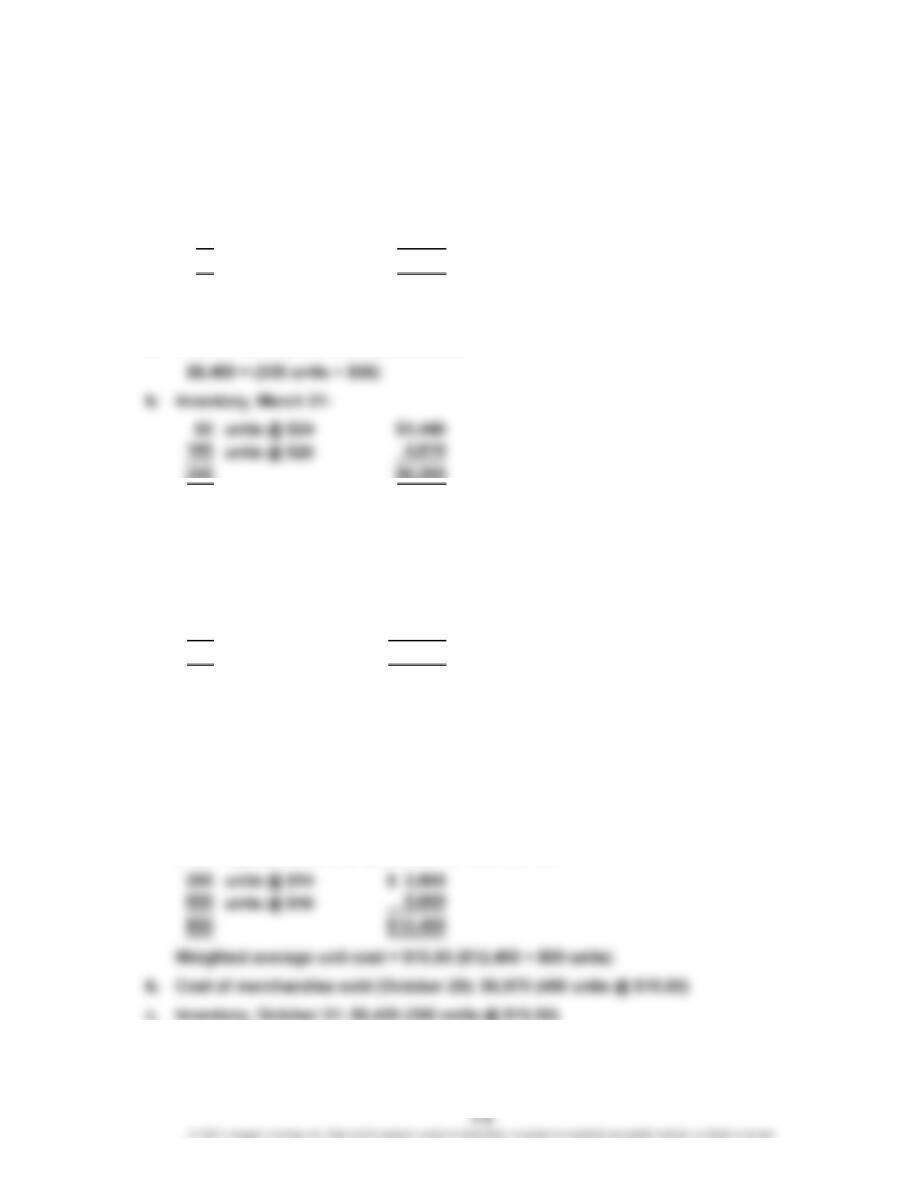
b. Inventory, September 30:
15 units @ $255 $3,825
5units @ $260 1,300
20 $5,125
PE 7-3B
a. Cost of merchandise sold (March 27):
PE 7-4A
a. Weighted average unit cost: $132
Inventory total cost after purchase on July 23:
90 units @ $120 $10,800
360 units @ $135 48,600
450 $59,400
Weighted average unit cost = $132 ($59,400 ÷ 450 units)
b. Cost of merchandise sold (July 26): $43,560 (330 units @ $132)
c. Inventory, July 31: $15,840 (120 units @ $132)
PE 7-4B
a. Weighted average unit cost: $15.50
Inventory total cost after purchase on October 22:
CHAPTER 7 Inventories
PE 7-5A
a. First-in, first-out (FIFO) method: $86,700 = 17 units × $5,100
b. Last-in, first-out (LIFO) method: $69,200 = [(15 units × $4,000) + (2 units × $4,600)]
c. Weighted average cost method: $78,200 (17 units × $4,600), where average cost =
$4,600 = $248,400 ÷ 54 units
PE 7-5B
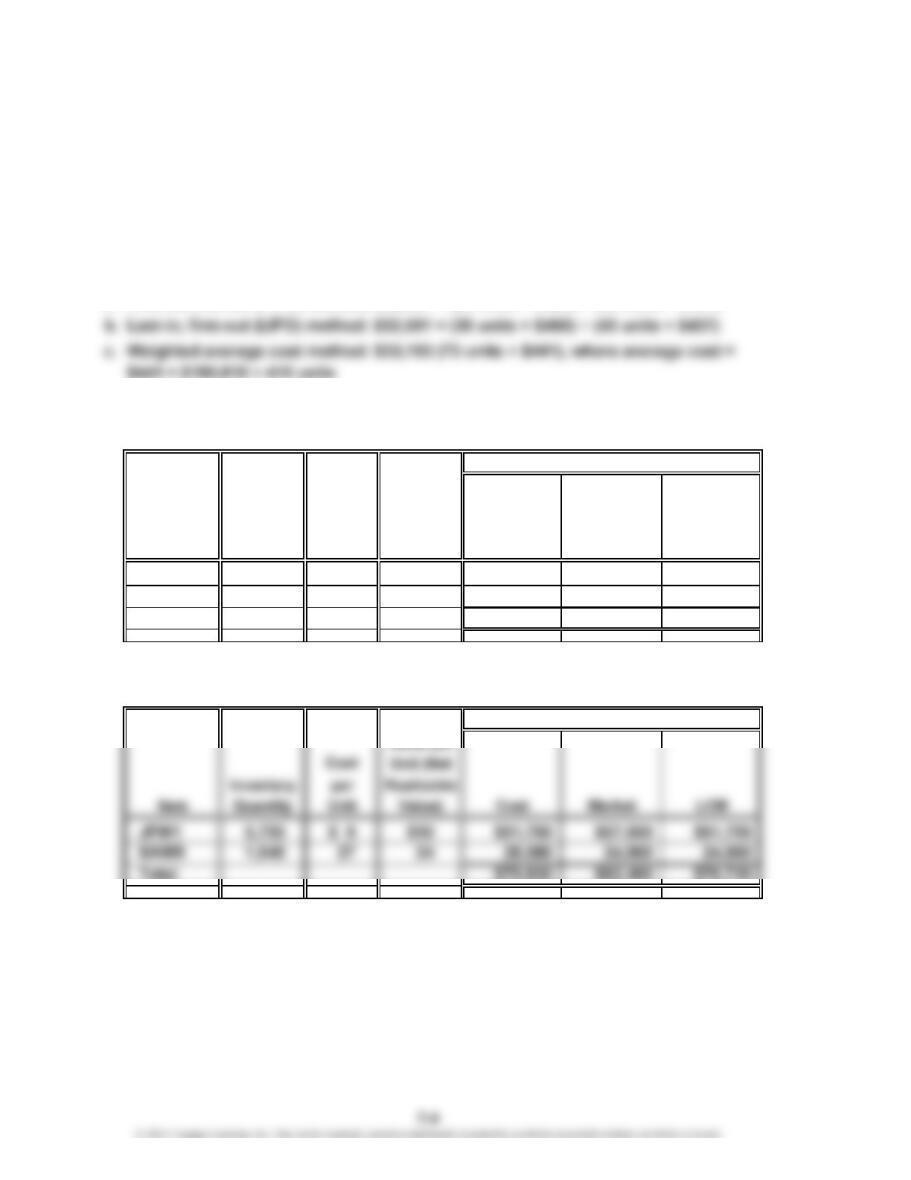
a. First-in, first-out (FIFO) method: $32,851 = (50 units × $456) + (23 units × $437)
PE 7-6A
Market
Value per
Cost Unit (Net
Inventory per Realizable
Item Quantity Unit Value) Cost Market LCM
Raven 10 1,700 $163 $159 $277,100 $270,300 $270,300
Dove 23 9,200 24 30 220,800 276,000 220,800
Total $497,900 $546,300 $491,100
PE 7-6B
Market
Total
Total
PE 7-7A
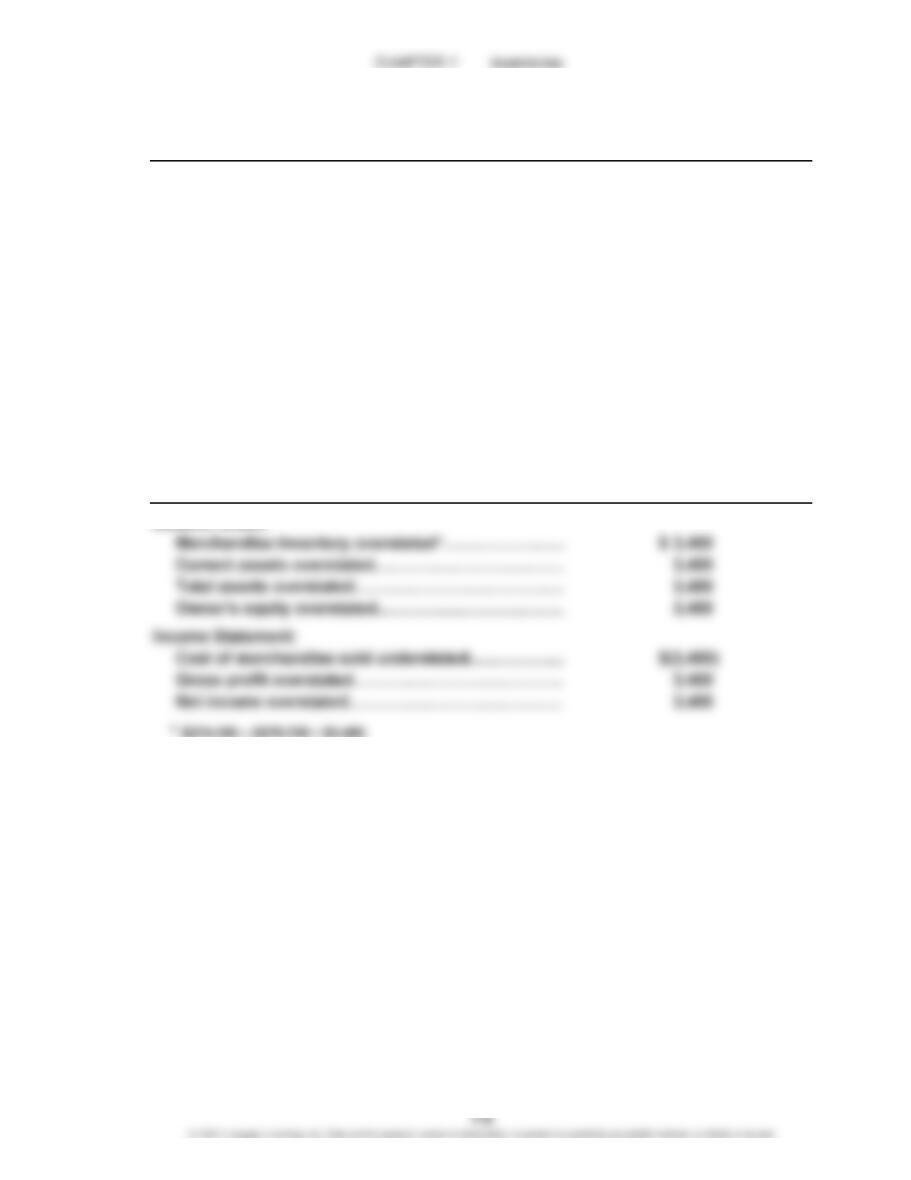
Balance Sheet:
Merchandise inventory understated*………………
…
Current assets understated……………………………
…
Total assets understated………………………………
…
Owner’s equity understated……………………………
Income Statement:
Cost of merchandise sold overstated………………
…
Gross profit understated………………………………
…
Net income understated………………………………
…
*$560,700 – $543,500 = $17,200
PE 7-7B
…
…
…
…
Overstatement (Understatement)
Amount of Misstatement
Amount of Misstatement
Overstatement (Understatement)
(17,200)
$(17,200)
(17,200)
(17,200)
(17,200)
$ 17,200
(17,200)
CHAPTER 7 Inventories
PE 7-8A
a.
Cost of merchandise sold
b.
Cost of merchandise sold
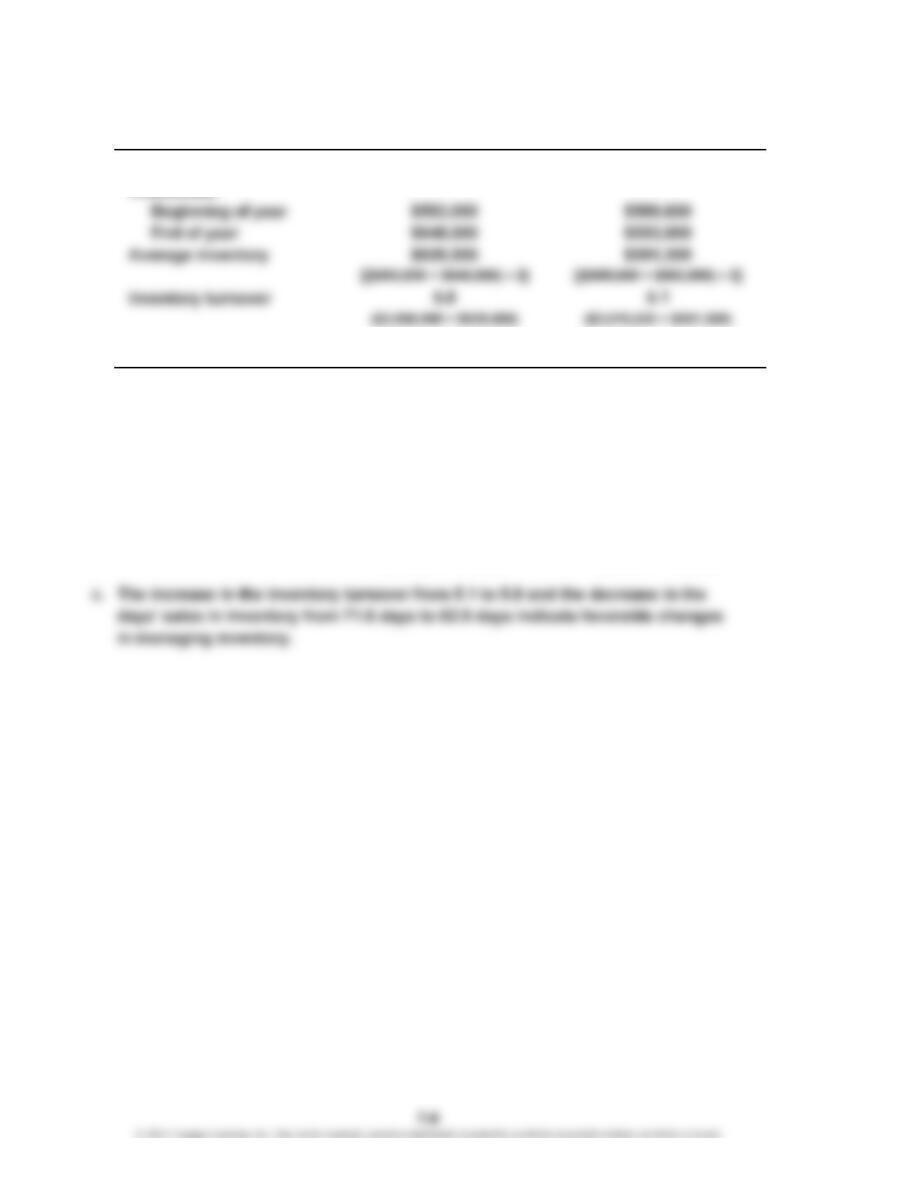
Average daily cost of
merchandise sold
Average inventory
Days’ sales in inventory
($620,500 ÷ $9,860) ($591,300 ÷ $8,262)
($3,598,900 ÷ 365 days) ($3,015,630 ÷ 365 days)
$620,500 $591,300
[($593,000 + $648,000) ÷ 2] [($589,600 + $593,000) ÷ 2]
62.9 71.6
$9,860 $8,262
$3,598,900 $3,015,630
20Y4 20Y3
Days’ Sales in Inventory
20Y4 20Y3
$3,598,900 $3,015,630
Inventory Turnover
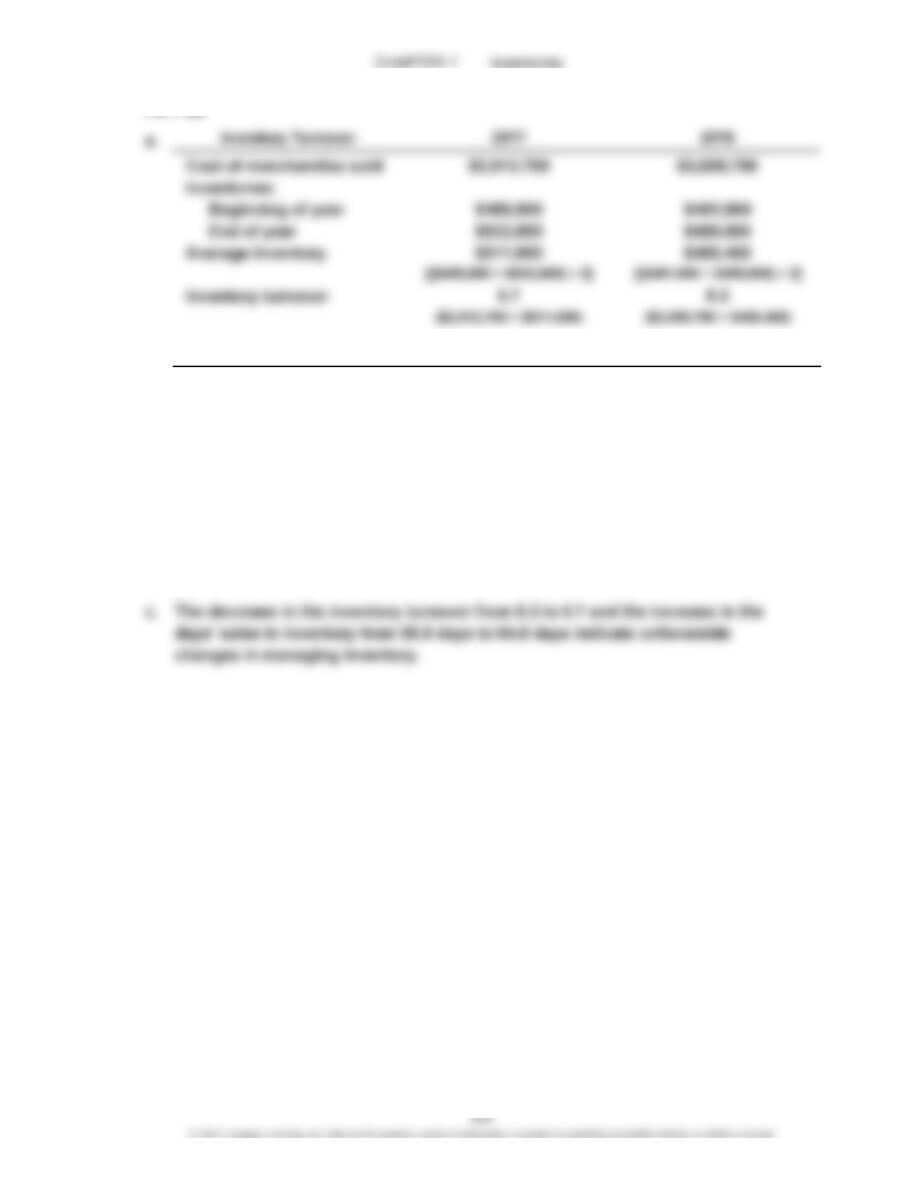
b.
Cost of merchandise sold
Average daily cost of
merchandise sold
Average inventory
Days’ sales in inventory
$3,009,790
20Y7 20Y6
(
$511
,
000 ÷ $7
,
980
)
(
$485
,
450 ÷ $8
,
246
)
Days’ Sales in Inventory
[($489,000 + $533,000) ÷ 2] [($481,900 + $489,000) ÷ 2]
$7,980 $8,246
($2,912,700 ÷ 365 days) ($3,009,790 ÷ 365 days)
$511,000 $485,450
64.0 days 58.9 days
$2,912,700
CHAPTER 7 Inventories
Ex. 7-1
Switching to a perpetual inventory system will strengthen Triple Creek Hardware’s
internal controls over inventory because the store managers will be able to keep
track of how much of each item is on hand. This should minimize shortages of
good-selling items and excess inventories of poor-selling items.
Ex. 7-2
a. Appropriate. The inventory tags will protect the inventory from customer theft.
b. Inappropriate. The control of using security measures to protect the inventory
is violated if the stockroom is not locked.
EXERCISES
CHAPTER 7 Inventories
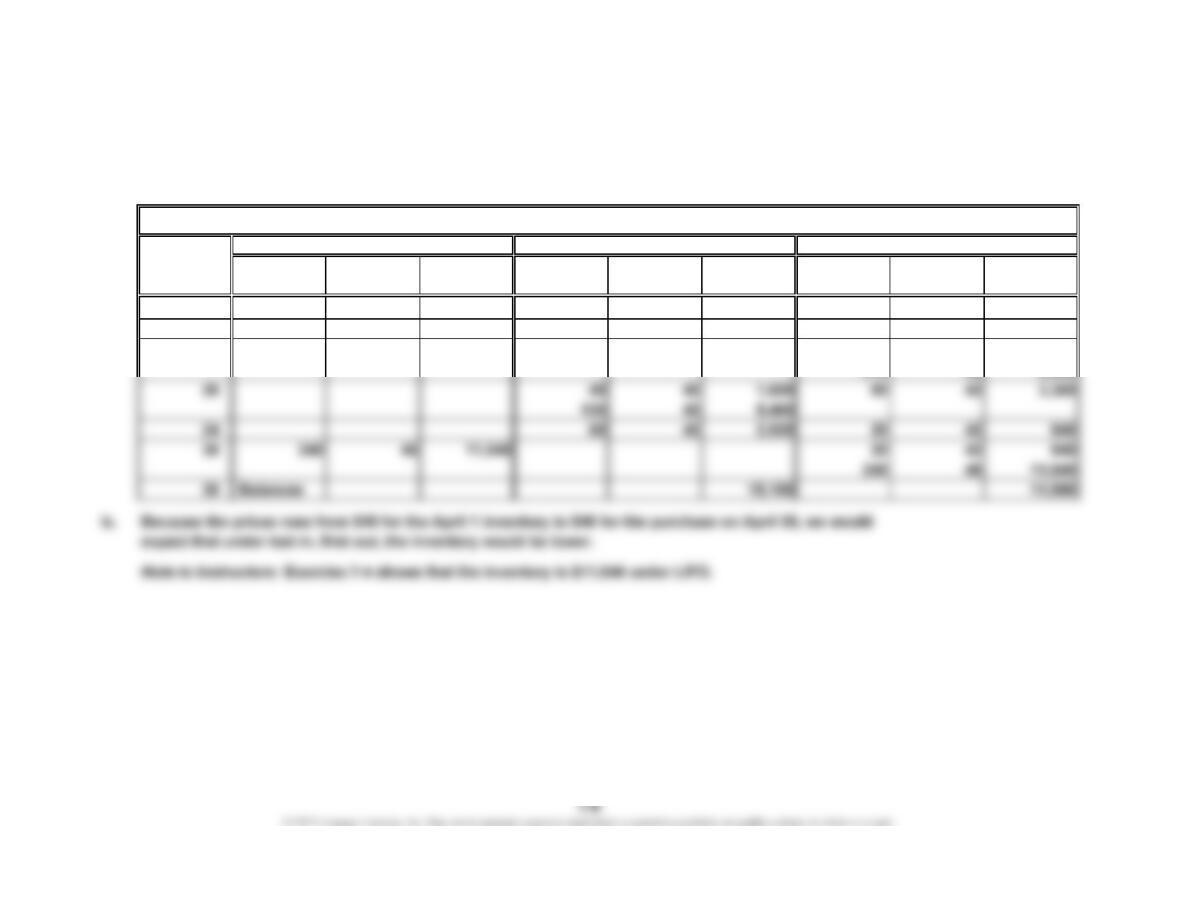
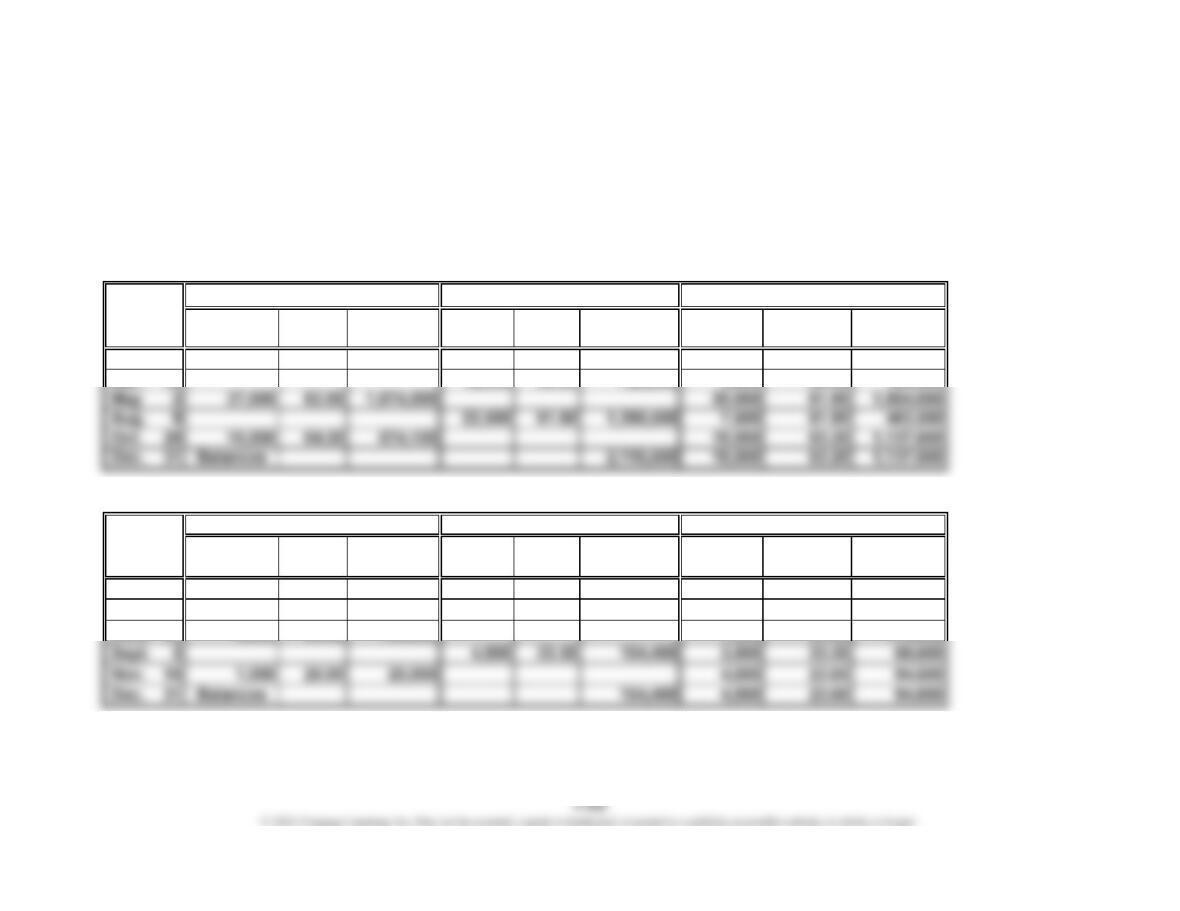
Ex. 7-3
a.
Unit Total Unit Total Unit Total
Quantity Cost Cost Quantity Cost Cost Quantity Cost Cost
Apr. 1 180 40 7,200
10 140 40 5,600 40 40 1,600
15 210 42 8,820 40 40 1,600
Date
Portable Game Players
Purchases Cost of Merchandise Sold Inventory
CHAPTER 7 Inventories
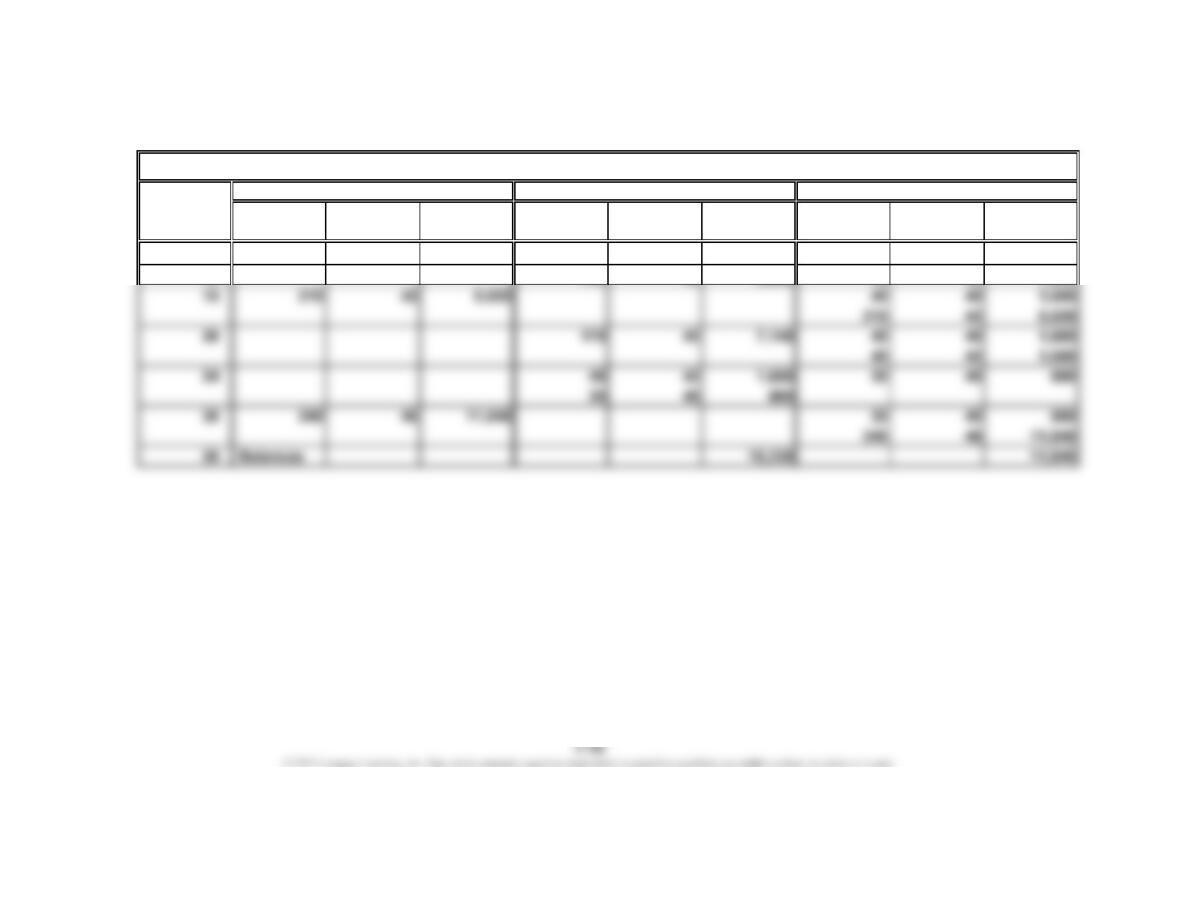
Ex. 7-4
Unit Total Unit Total Unit Total
Quantity Cost Cost Quantity Cost Cost Quantity Cost Cost
Apr. 1 180 40 7,200
Date
Portable Game Players
Purchases Cost of Merchandise Sold Inventory
CHAPTER 7 Inventories
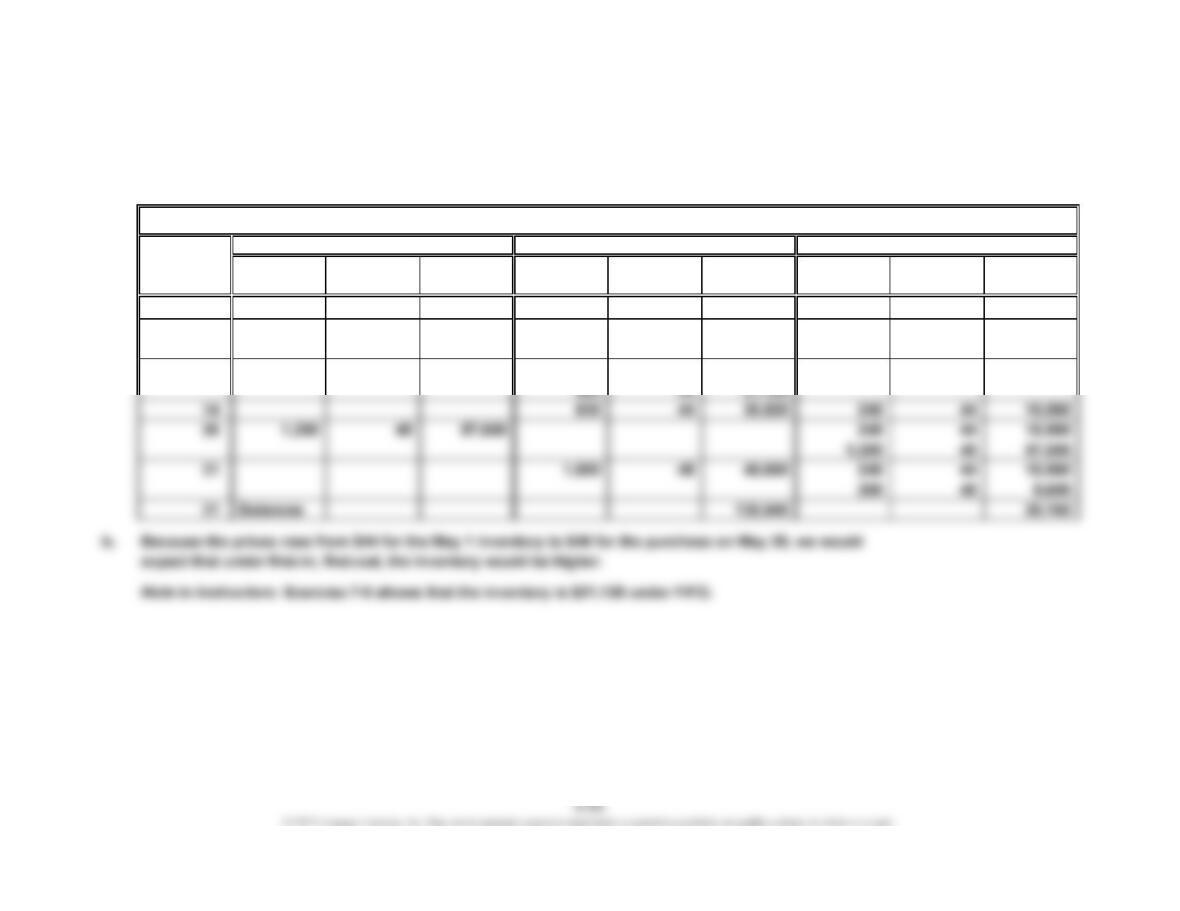
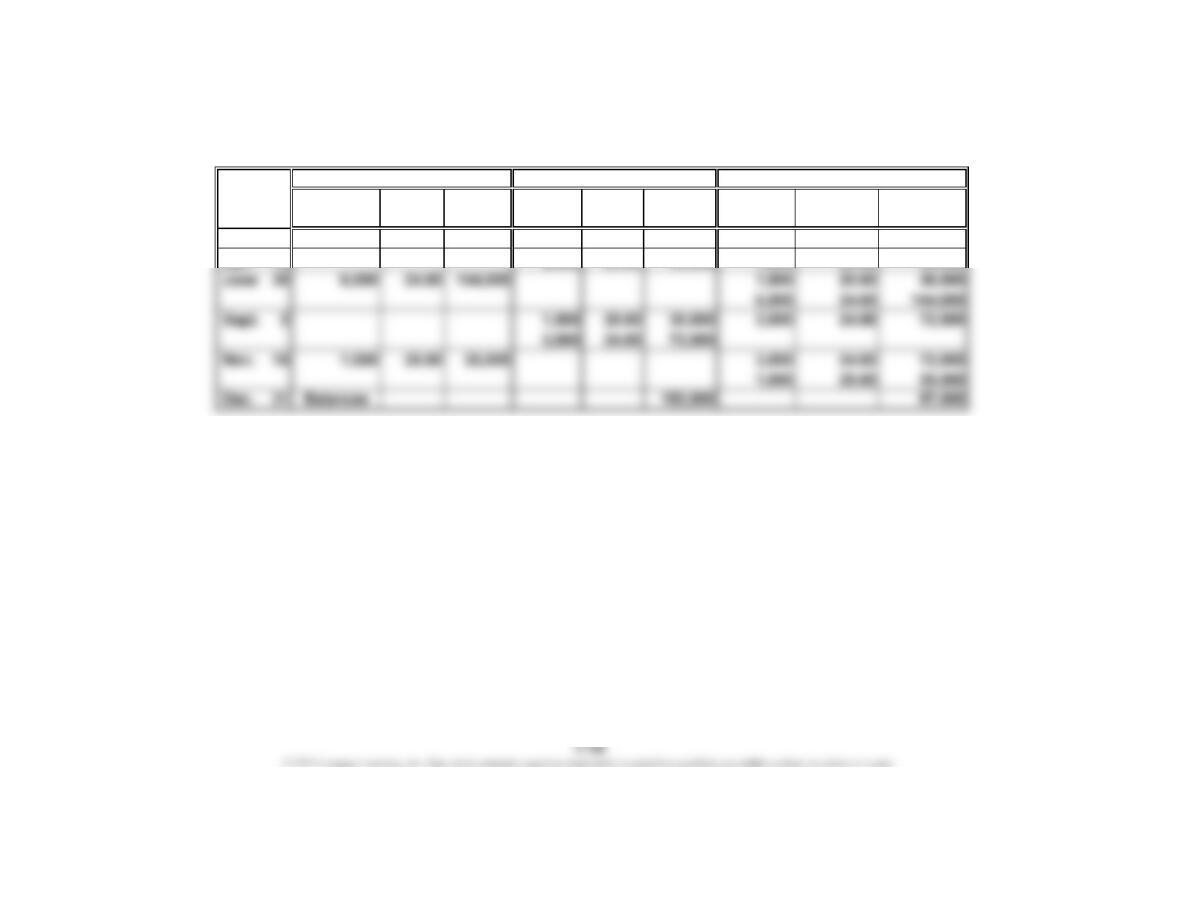
Ex. 7-5
a.
Unit Total Unit Total Unit Total
Quantity Cost Cost Quantity Cost Cost Quantity Cost Cost
May 1 1,550 44 68,200
10 720 45 32,400 1,550 44 68,200
720 45 32,400
12 720 45 32,400 1,070 44 47,080
Date
Prepaid Cell Phones
Purchases Cost of Merchandise Sold Inventory
CHAPTER 7 Inventories
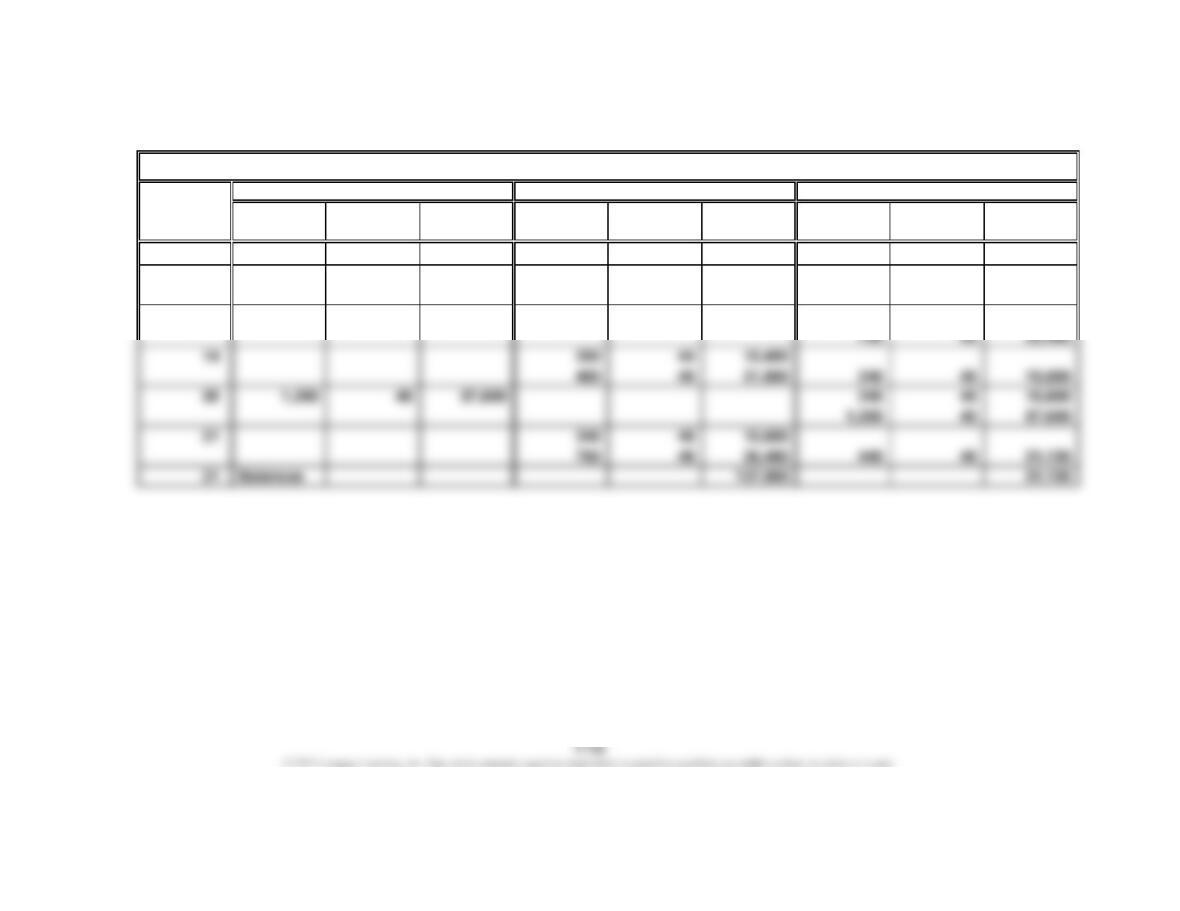
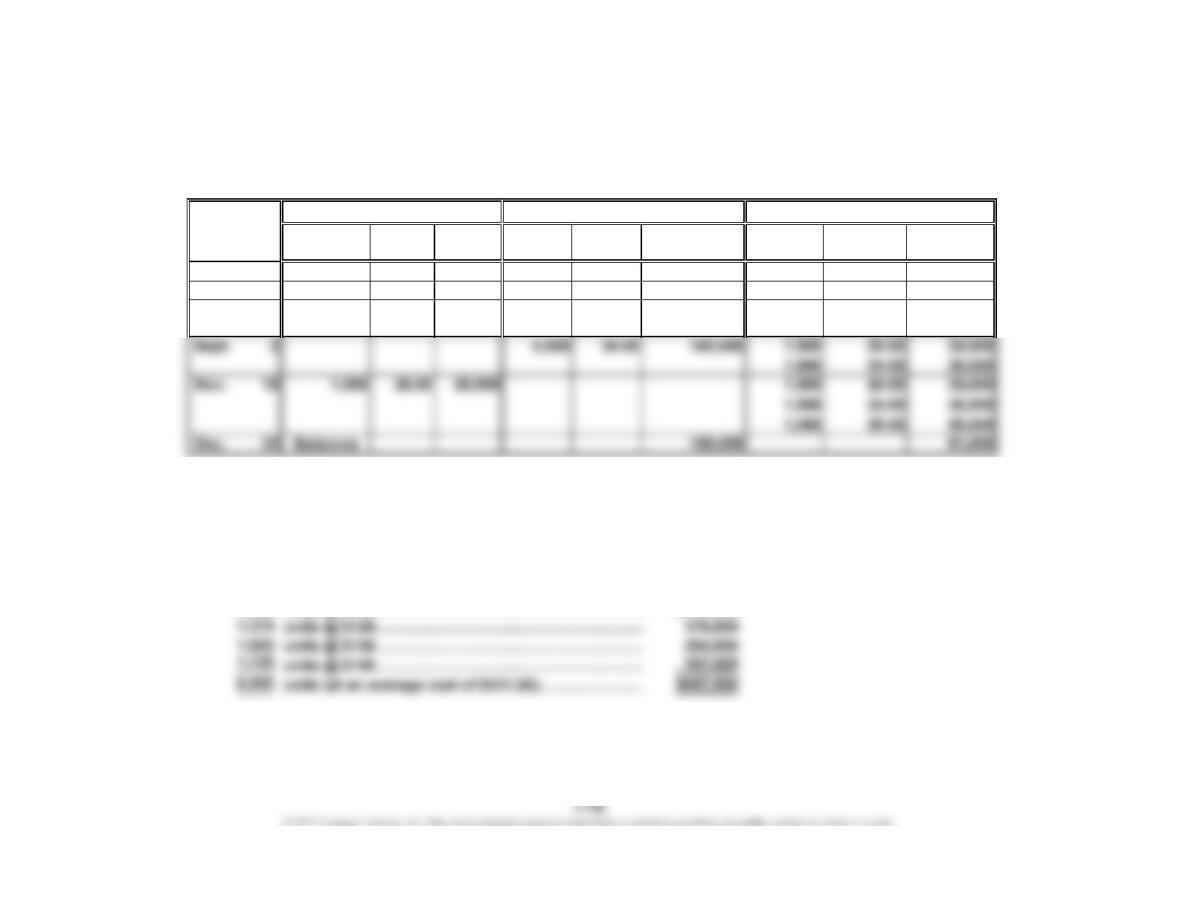
Ex. 7-6
Unit Total Unit Total Unit Total
Quantity Cost Cost Quantity Cost Cost Quantity Cost Cost
May 1 1,550 44 68,200
10 720 45 32,400 1,550 44 68,200
720 45 32,400
12 1,200 44 52,800 350 44 15,400
Date
Prepaid Cell Phones
Purchases Cost of Merchandise Sold Inventory
CHAPTER 7 Inventories
Ex. 7-7
a. $823,680 ($26.40 × 31,200 units)
b. $763,200 [($20.00 × 7,200 units) + ($25.20 × 12,000 units) + ($26.40 × 12,000 units)] = $144,000 + $302,400 + $316,800
Ex. 7-8
Unit Total Unit Total Total
Quantity Cost Cost Quantity Cost Cost Quantity Unit Cost Cost
Jan. 1 15,000 60.00 900,000
Ex. 7-9
Unit Total Unit Total Total
Quantity Cost Cost Quantity Cost Cost Quantity Unit Cost Cost
Jan. 1 4,000 20.00 80,000
Apr. 19 2,500 20.00 50,000 1,500 20.00 30,000
Date
Inventory
Inventory
Date
Purchases
Purchases
Cost of Merchandise Sold
Cost of Merchandise Sold
CHAPTER 7 Inventories
Ex. 7-10
Cost of Merchandise Sold
Unit Total Unit Total Total
Quantity Cost Cost Quantity Cost Cost Quantity Unit Cost Cost
Jan. 1 4,000 20.00 80,000
Date
InventoryPurchases
CHAPTER 7 Inventories
Ex. 7-11
Inventory
Unit Total Unit Total Total
Quantit
y
Cost Cost Quantit
y
Cost Cost Quantit
y
Unit Cost Cost
1 4,000 20.00 80,000
19 2,500 20.00 50,000 1,500 20.00 30,000
30 6,000 24.00 144,000 1,500 20.00 30,000
6,000 24.00 144,000
Ex. 7-12
a. $167,700 (1,125 units at $140 plus 75 units at $136) = $157,500 + $10,200
b. $145,600 (1,000 units at $120 plus 200 units at $128) = $120,000 + $25,600
c. $157,800 (1,200 units at $131.50)
Cost of merchandise available for sale:
Cost of Merchandise SoldPurchases
Date
Jan.
Apr.
June
1,000
CHAPTER 7 Inventories
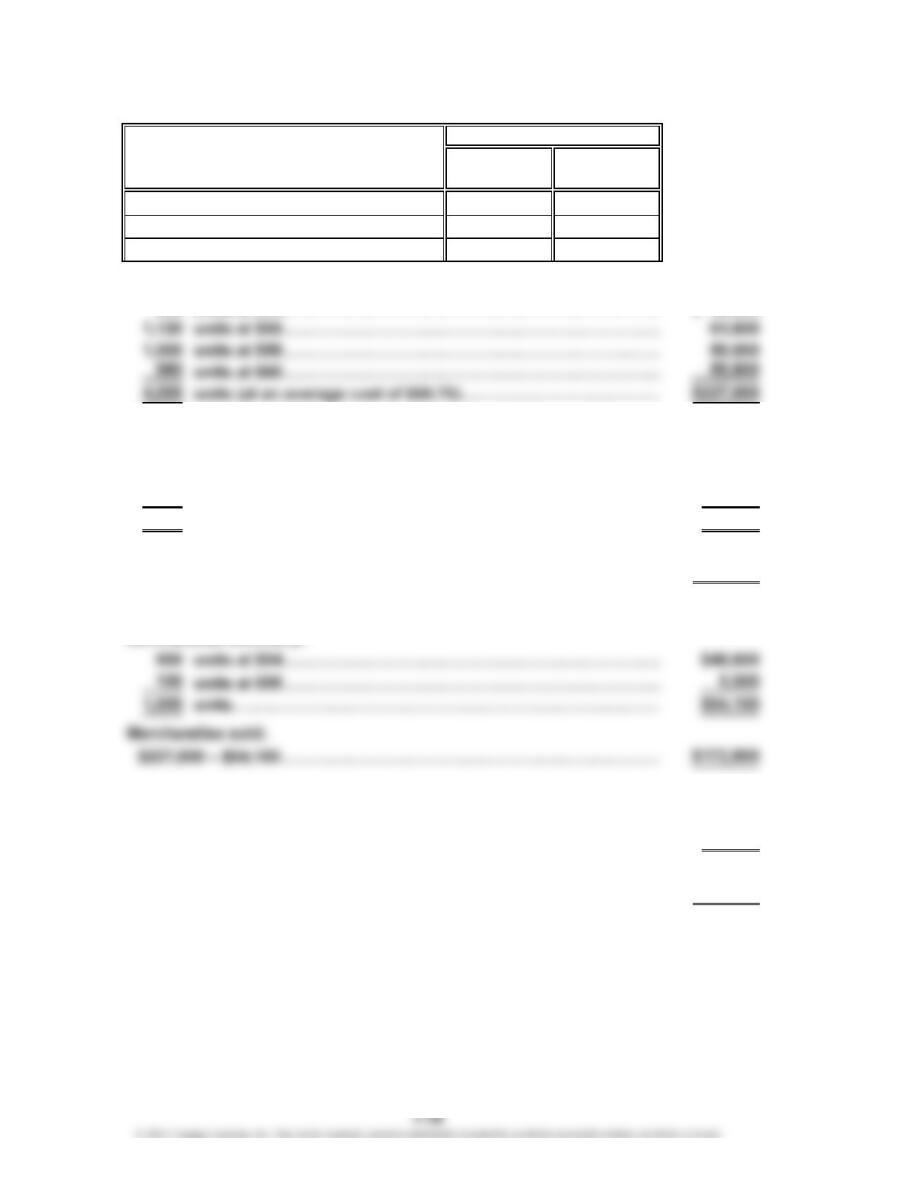
Ex. 7-13
Merchandise Merchandise
Inventory Method Inventory Sold
a. FIFO $59,960 $167,040
b. LIFO 54,100 172,900
c. Weighted average cost 56,750 170,250
Cost of merchandise available for sale:
a. First-in, first-out:
Merchandise inventory:
980 units at $60…………………………………………………..………… $58,800
20 units at $58……………………………………………………………
…
1,160
1,000 units……………………………………………………..……………… $59,960
Merchandise sold:
$227,000 – $59,960…………………………………….………………………
…
$167,040
b. Last-in, first-out:
…
c. Weighted average cost:
Merchandise inventory:
1,000 units at $56.75 ($227,000 ÷ 4,000 units)……………………………
…
$56,750
Merchandise sold:
$227,000 – $56,750……………………………………………………………
…
$170,250
Cost
…
…
CHAPTER 7 Inventories
Ex. 7-14
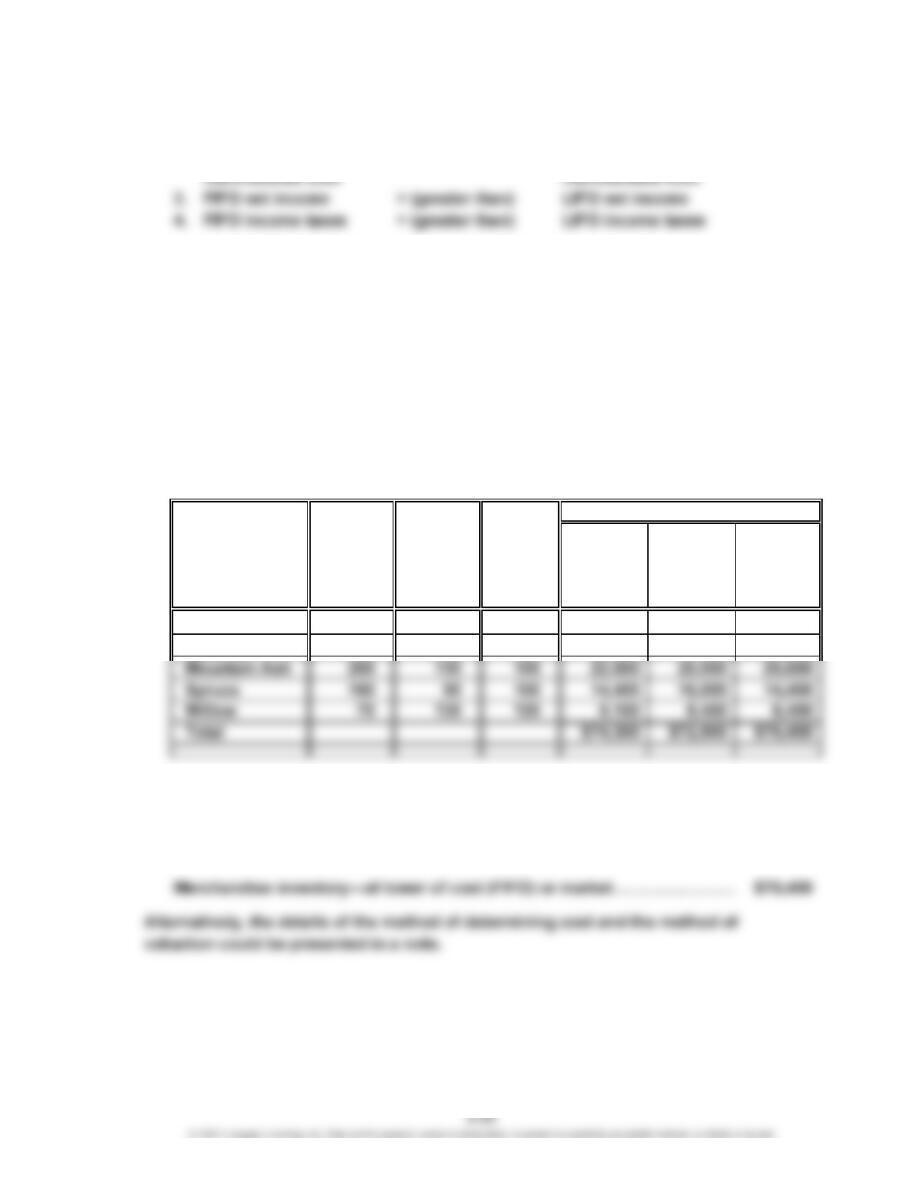
a. 1. FIFO inventory > (greater than) LIFO inventory
2. FIFO cost of < (less than) LIFO cost of
b. In periods of rising prices, the income shown on the company’s tax return
would be lower if LIFO rather than FIFO were used; thus, there is a tax advantage
of using LIFO.
Note to Instructors: The federal tax laws require that if LIFO is used for tax
purposes, LIFO must also be used for financial reporting purposes. This is
known as the LIFO conformity rule. Thus, selecting LIFO for tax purposes means
that the company’s reported income will also be lower than if FIFO had been
used. Companies using LIFO believe the tax advantages from using LIFO
outweigh any negative impact of reporting a lower income to shareholders.
Ex. 7-15
Market
Value per
Cost Unit (Net
Inventory per Realizable
Quantity Unit Value) Cost Market LCM
120 $150 $140 $18,000 $16,800 $16,800
90 120 130 10,800 11,700 10,800
Ex. 7-16
The merchandise inventory would appear in the Current Assets section, as
follows:
Inventory
Birch
Total
Item
Cypress
CHAPTER 7 Inventories
Ex. 7-17
a.
Merchandise inventory*………………………………………
…
$5,200 understated
Current assets…………………………………………………
…
$5,200 understated
Total assets……………………………………………………
…
$5,200 understated
Owner’s equity…………………………………………………
…
$5,200 understated
*$5,200 = $238,600 – $233,400
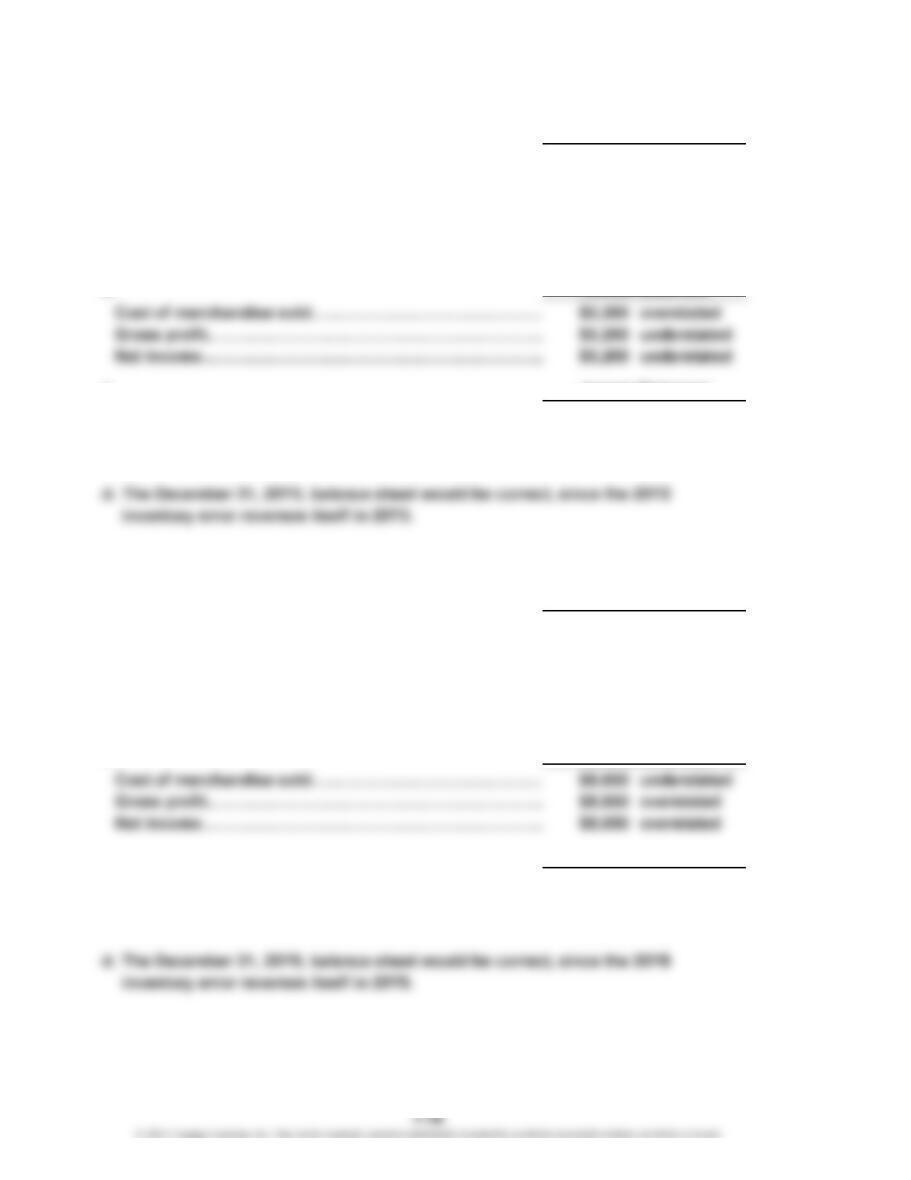
c.
Cost of merchandise sold……………………………………
…
$5,200 understated
Gross profit……………………………………………………
…
$5,200 overstated
Net income………………………………………………………
…
$5,200 overstated
Ex. 7-18
a.
Merchandise inventory*………………………………………
…
$8,650 overstated
Current assets…………………………………………………
…
$8,650 overstated
Total assets……………………………………………………
…
$8,650 overstated
Owner’s equity…………………………………………………
…
$8,650 overstated
*$8,650 = $337,500 – $328,850
b.
…
…
…
c.
Cost of merchandise sold……………………………………
…
$8,650 overstated
Gross profit……………………………………………………
…
$8,650 understated
Net income………………………………………………………
…
$8,650 understated
Balance Sheet
Income Statement
Income Statement
Balance Sheet
Income Statement
…
…
…
CHAPTER 7 Inventories
Ex. 7-19
When an error is discovered affecting the prior period, it should be corrected. In
this case, the merchandise inventory account should be debited and the owner’s
capital account credited for $42,750.
Failure to correct the error for 20Y4 and purposely misstating the inventory and
the cost of merchandise sold in 20Y5 would cause the income statements for the
two years not to be comparable. The balance sheet at the end of 20Y5 would be
correct, however, because the 20Y4 inventory error reverses itself in 20Y5.
Ex. 7-20
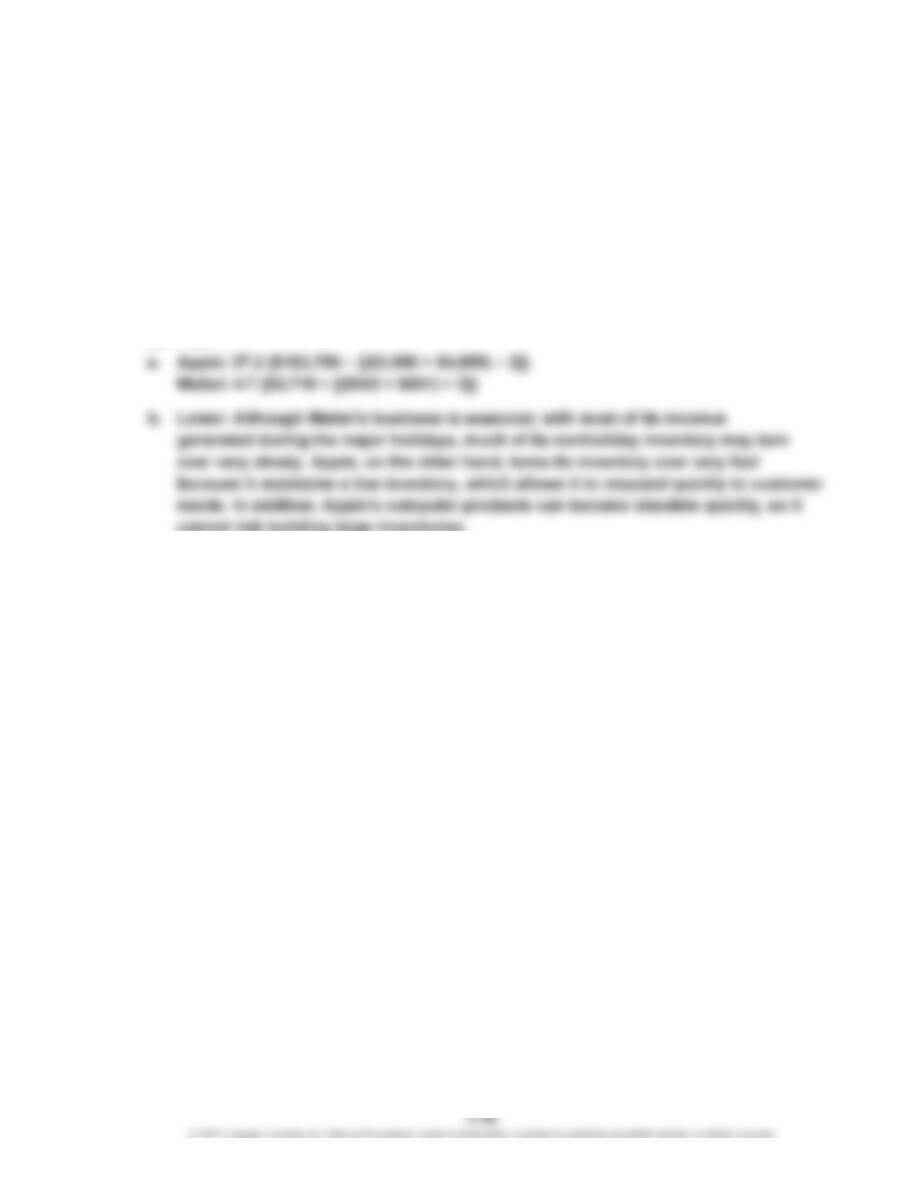
cannot risk building large inventories.
CHAPTER 7 Inventories
Ex. 7-21
$7,952.0
$260.0
$247.0
$9.5
$360.5
$8.5
Alternatively, the day’s sales in inventory could be computed by dividing 365
days by the inventory turnover as follows:
Kroger: 30.6 days (365 ÷ 11.93)
Sprouts: 26.1 days* (365 ÷ 14.01)
Ingles: 42.2 days* (365 ÷ 8.64)
* Difference is due to rounding.
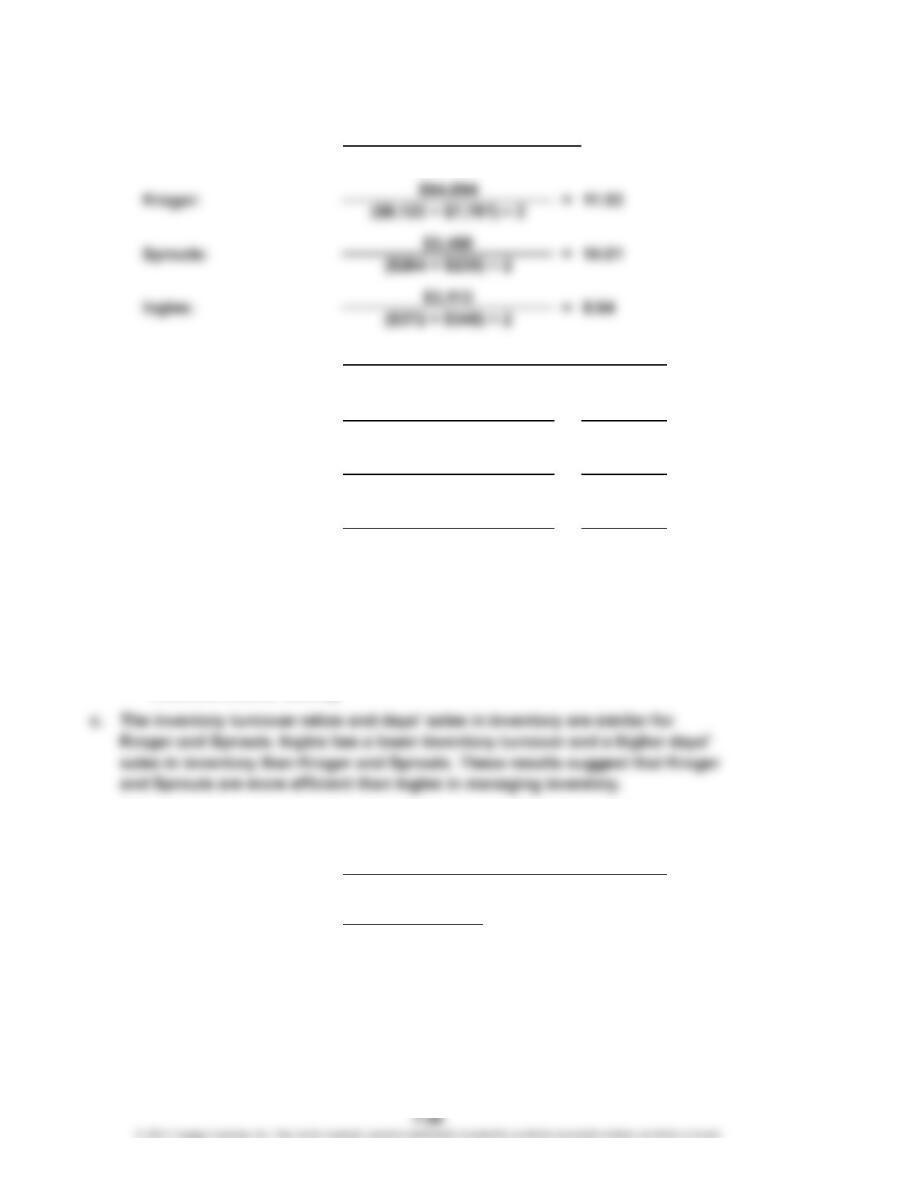
d. If Ingles matched Kroger’s days’ sales in inventory, then its hypothetical ending
inventory would be determined as follows:
X= 30.6 × ($3,113 ÷ 365) = 30.6 × $8.5
X=
30.6 days X
($3,113 ÷ 365)
=
Days’ Sales in Inventory Average Inventory
Cost of Merchandise Sold ÷ 365
=
a.
b.
Inventory Turnover Cost of Merchandise Sold
Average Inventory
=
=
42.4 days=
$3,460 ÷ 365
==
= 30.6 days=
26.0 days
$260.1
Days’ Sales in Inventory Cost of Merchandise Sold ÷ 365
Average Inventory
$3,113 ÷ 365
($372 + $349) ÷ 2
Ingles: =
Sprouts:
Kroger: ($8,123 + $7,781) ÷ 2
$94,894 ÷ 365
($264 + $230) ÷ 2