CHAPTER 7 Cost-Volume-Profit Analysis
E 7-43
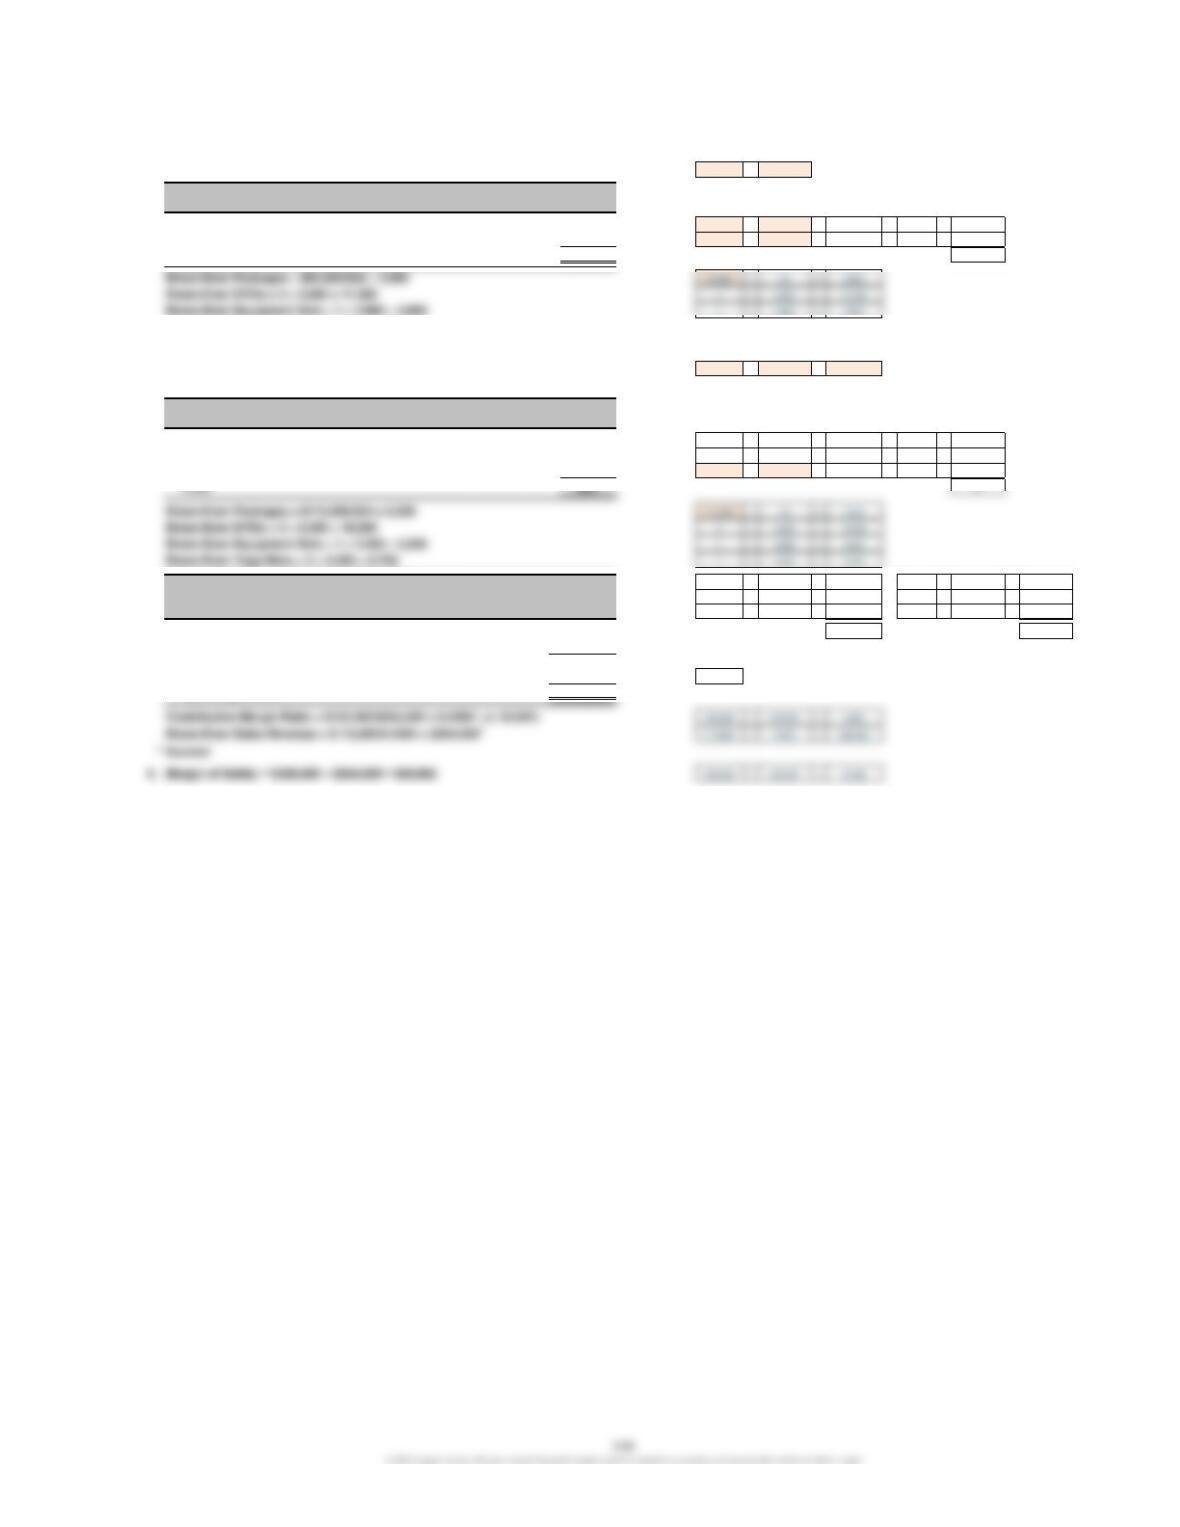
1. Sales mix is 3:1 (three times as many DVDs are sold as equipment sets). 3 : 1
2. Variable Sales Total
Product Price –Cost = CM × Mix = CM
DVDs $ 8 $ 4 $ 4 3 $12 8 – 4 = 4 × 3 = 12
Equipment sets 25 15 10 110 25 – 15 = 10 × 1 = 10
Total $22 22
E 7-44
1. Sales mix is 3:1:2 (three times as many DVDs will be sold as equipment sets, 3 : 1 : 2
and twice as many yoga mats will be sold as equipment sets).
2. Variable Sales Total
Product Price –Cost = CM × Mix = CM
DVDs $ 8 $ 4 $ 4 3 $12 8 – 4 = 4 × 3 = 12
Equipment sets 25 15 10 110 25 – 15 = 10 × 1 = 10
Yoga mats 15 9 6 2 12 15 – 9 = 6 × 2 = 12
Total $34 34
3. 8 × 13,500 = 108,000 4 × 13,500 = 54,000
25 × 4,500 = 112,500 15 × 4,500 = 67,500
15 × 9,000 = 135,000 9 × 9,000 = 81,000
Sales………………………………………………………………………………….………………………………….
355,500 202,500
Total variable cost………………………………………………………………………………………………………..
Contribution margin…………………………………………………………………………………….……………
Total fixed cost……………………………………………………………………………………………….………..………
113,900
Operating income…………………………………………………………………………………….…………………
Cherry Blossom Products Inc.
Income Statement
For the Coming Year
$ 39,100
113,900
$355,500
202,500
$153,000
CHAPTER 7 Cost-Volume-Profit Analysis
E 7-45
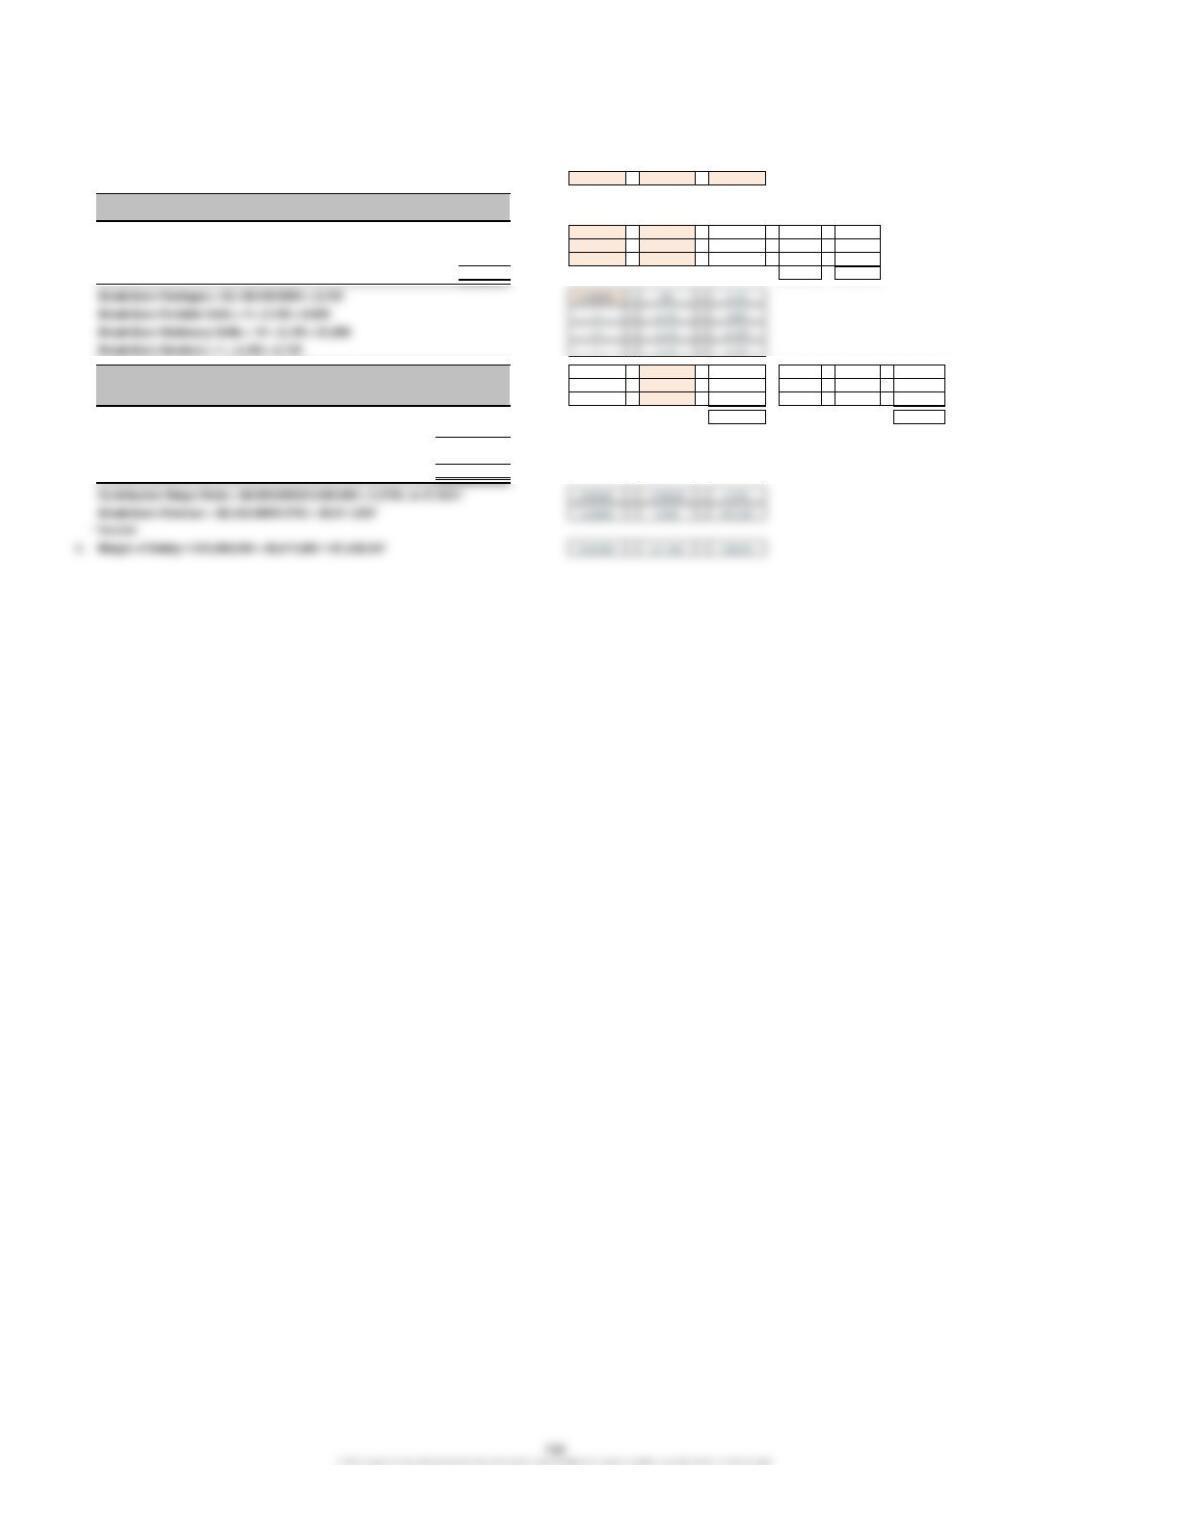
1. Sales mix is 4:10:1 (four times as many portable grills will be sold as smokers,
and 10 times as many stationary grills will be sold as smokers). 4 : 10 : 1
2. Variable Sales Total
Product Price –Cost = CM × Mix = CM
Portable $ 90 $45 $45 4$180 90 – 45 = 45 × 4 = 180
Stationary 200 130 70 ## ## 700 200 – 130 = 70 × 10 = 700
Smoker 250 140 110 1110 250 – 140 = 110 × 1 = 110
Total $990 2,150 990
3. 90 × 20,000 = 1,800,000 45 × 20,000 = 900,000
200 × 50,000 = 10,000,000 130 × 50,000 = 6,500,000
250 × 5,000 = 1,250,000 140 × 5,000 = 700,000
Sales……………………………………………………………………………………………………..…………….
13,050,000 8,100,000
Total variable cost…………………………………………………………………..………………..………………………..
Contribution margin………………………………………………………………………………….………………
Total fixed cost………………………………………………………………..…………………………………………
Operating income…………………………………………………………………………………………………
Income Statement
For the Coming Year
Texas-Q Company
$ 2,821,500
$13,050,000
8,100,000
$ 4,950,000
2,128,500
CHAPTER 7 Cost-Volume-Profit Analysis
E 7-46
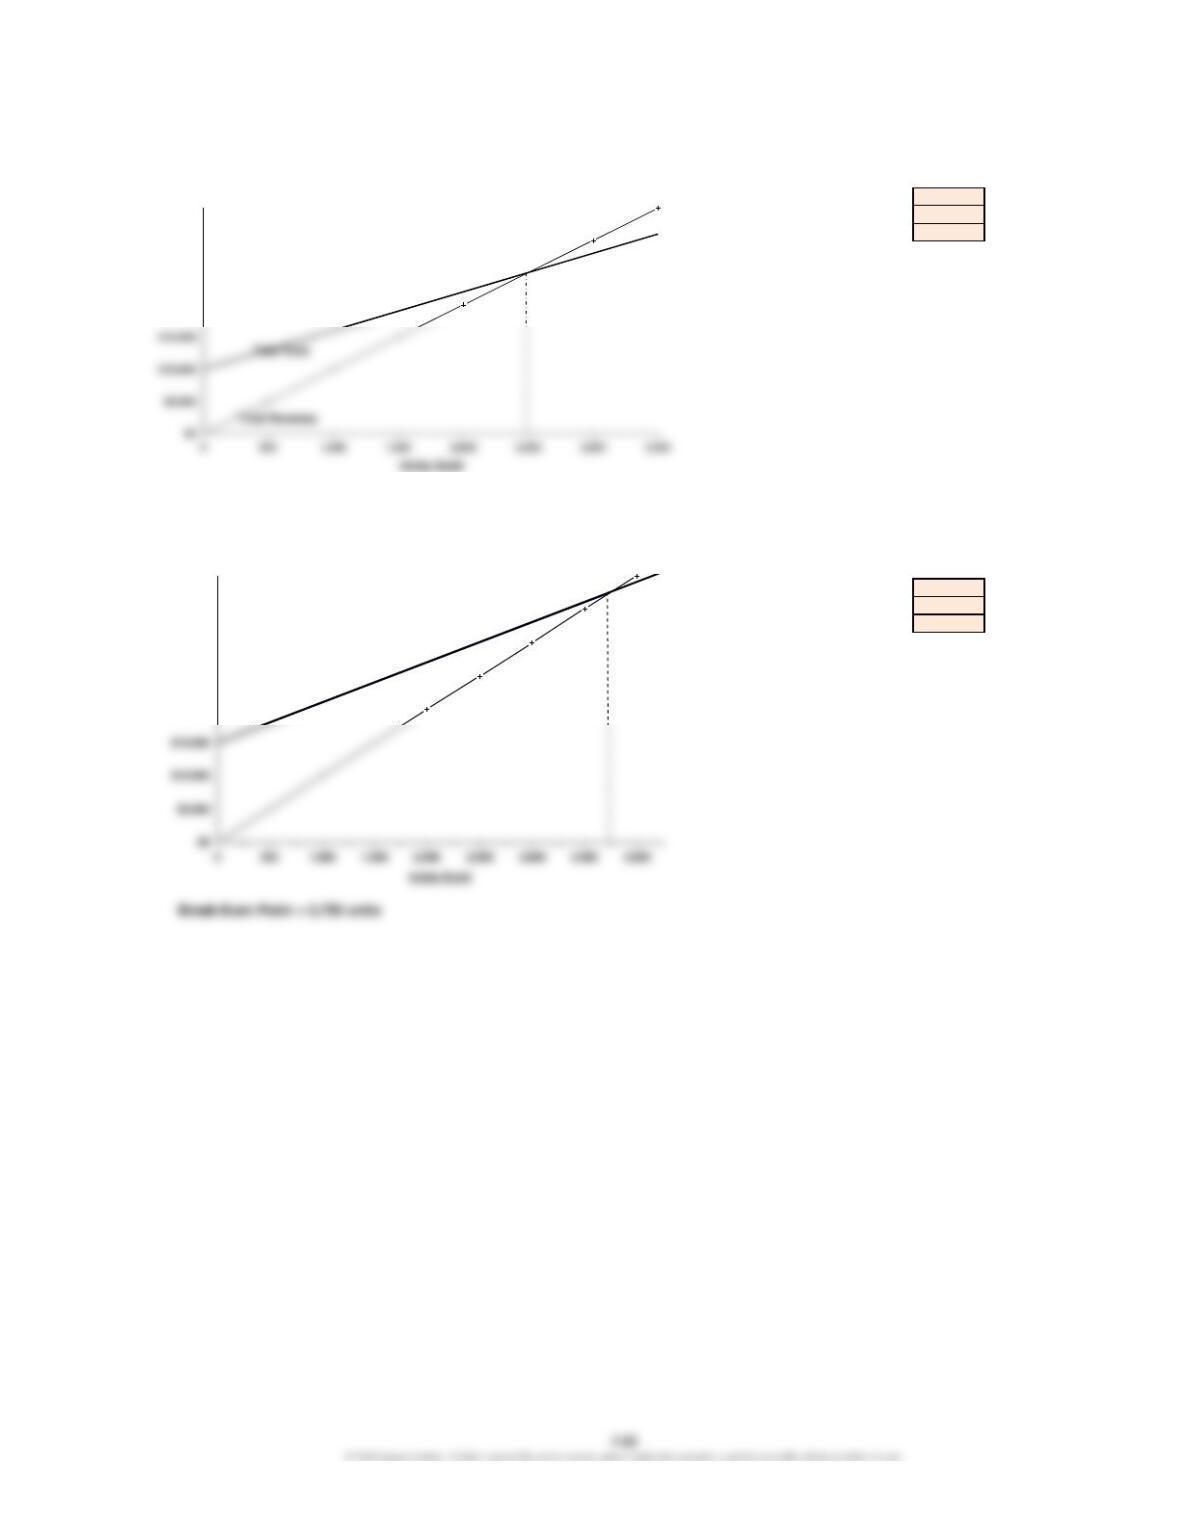
1.
Fixed cost 10,000
Var. cost 6
Selling price 10
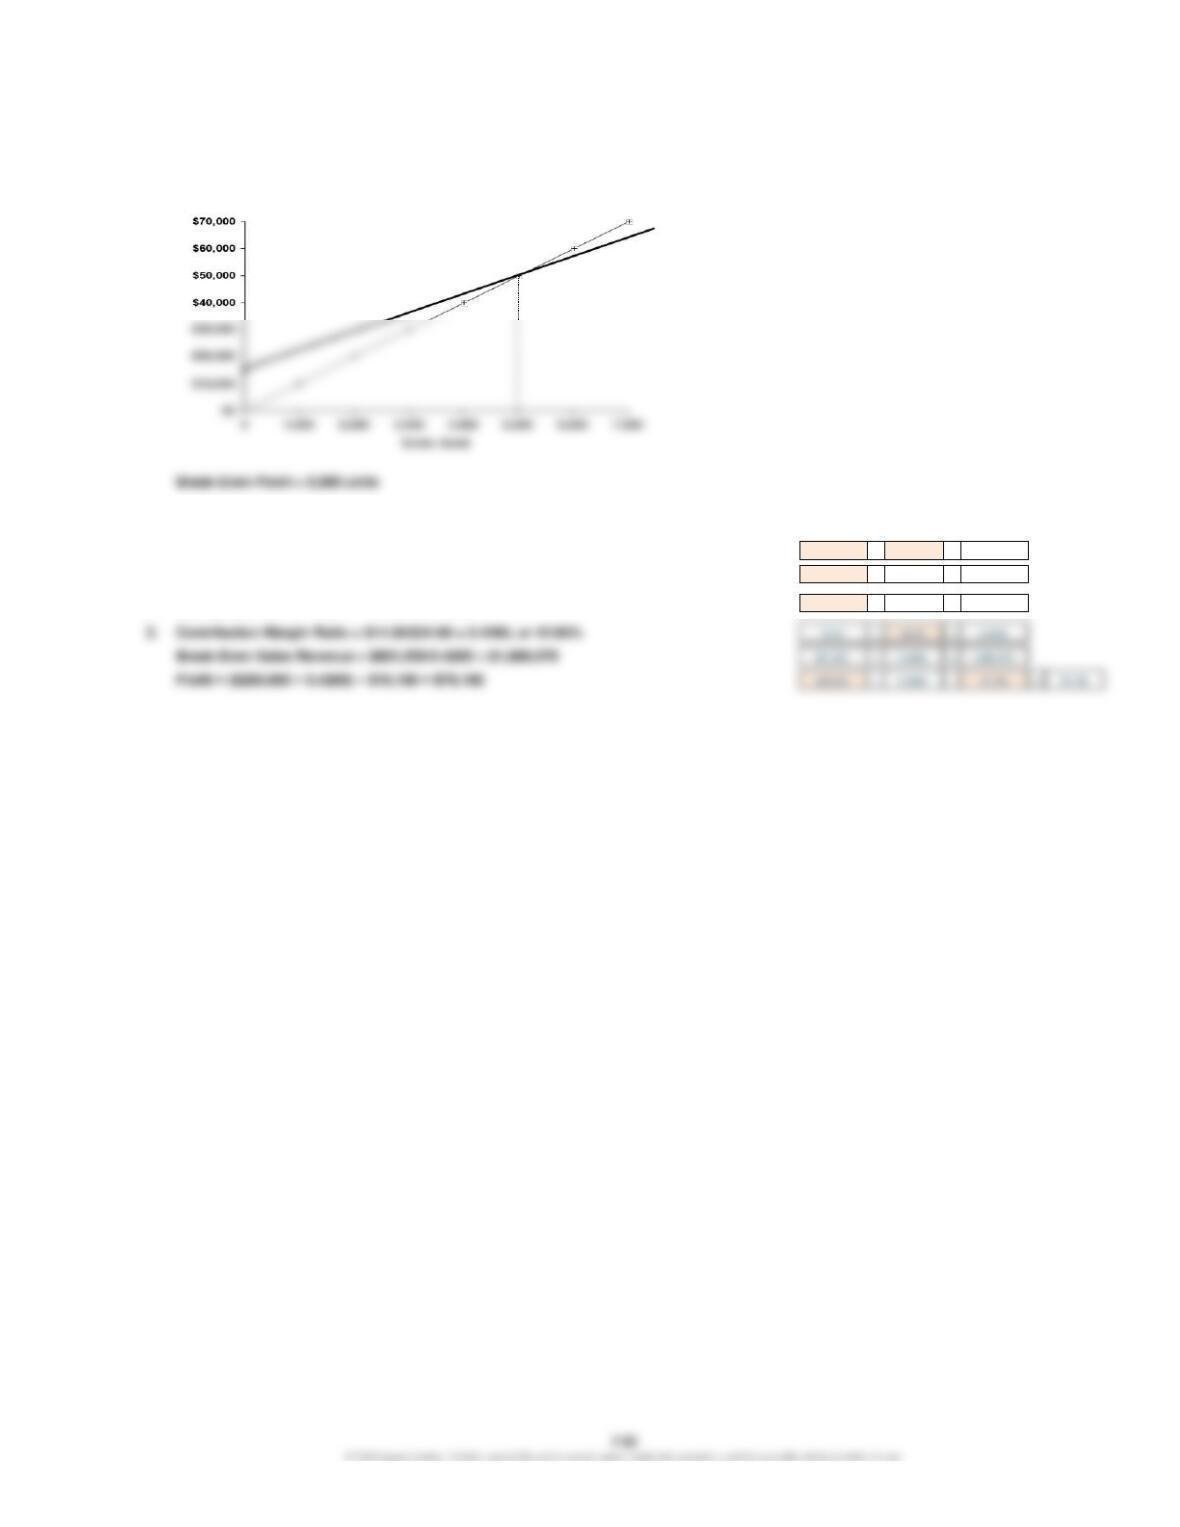
Break-Even Point = 2,500 units; the plus-marked line is total revenue, and the
heavy solid line is total cost.
2. a. Fixed cost increases by $5,000:
Fixed cost incr. 5,000
Var. cost incr. 7
Selling price incr. 12
$20,000
$25,000
$30,000
$35,000
$20,000
$25,000
$30,000
$35,000
$40,000
CHAPTER 7 Cost-Volume-Profit Analysis
E 7-46 (Continued)
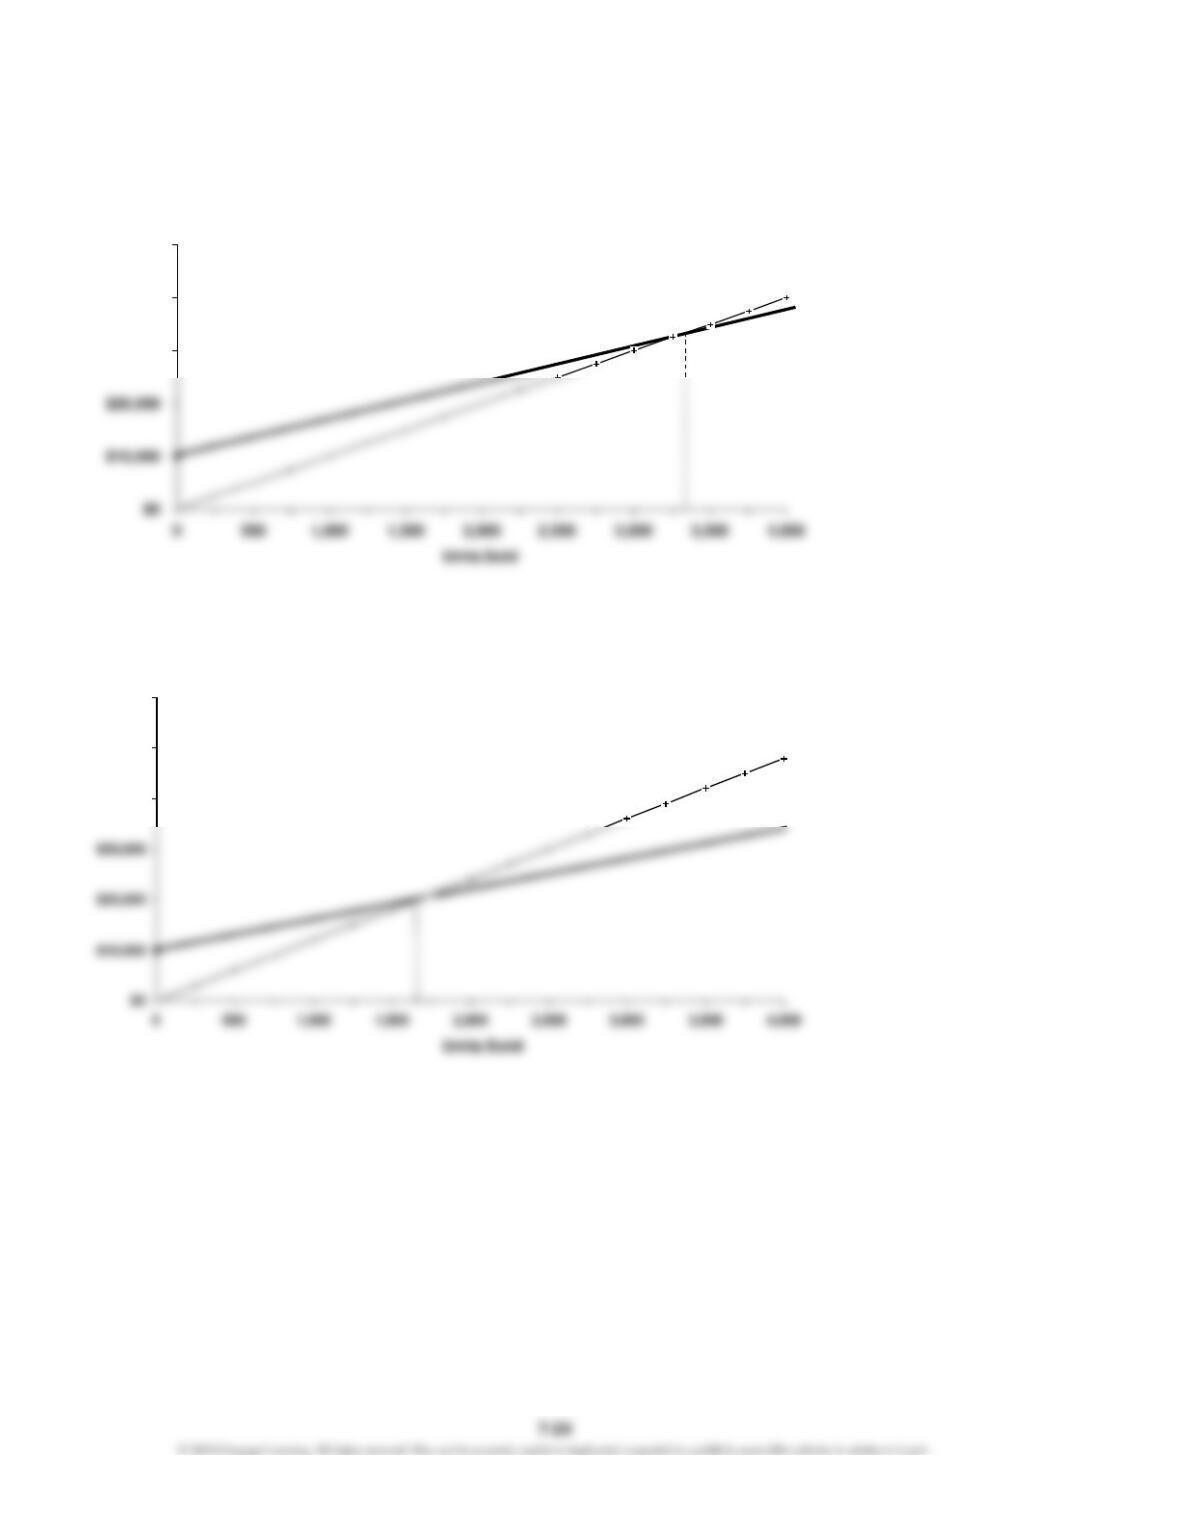
2. b. Unit variable cost increases to $7:
Break-Even Point = 3,333 units
2. c.
Unit selling price increases to $12:
Break-Even Point = 1,667 units
$40,000
$50,000
$60,000
$30,000
$40,000
$50,000
CHAPTER 7 Cost-Volume-Profit Analysis
E 7-46 (Concluded)
2. d. Both fixed cost and unit variable cost increase:
E 7-47
1. Unit Contribution Margin = $791,700/54,600 = $14.50 791,700 / 54,600 = 14.50
Break-Even Units = $801,850/$14.50 = 55,300 801,850 / 14.50 = 55,300
2. Operating Income = 10,000 × $14.50 = $145,000 10,000 × 14.50 = 145,000
CHAPTER 7 Cost-Volume-Profit Analysis
E 7-48
1. Break-Even Sales Dollars = $733,320/0.42* = $1,746,000 733,320 /0.42 = 1,746,000
*Contribution Margin Ratio = $756,000/$1,800,000 = 0.42, or 42% 756,000 /1,800,000 = 0.42
3. Degree of Operating Leverage =
=$756,000/$22,680 756,000 /22,680 = 33.33
=33.33*
E 7-49
1. Sales Total
Product Price –=CM ×
Mix
=CM 2 : 1
Vases $40 $10 2$20 40 – 30 = 10 × 2 = 20
Figurines 70 28 128 70 – 42 = 28 × 1 = 28
Total $48 48
Break-Even Packages = $30,000/$48 = 625 30,000 /48 = 625
2. The new sales mix is 3 vases to 2 figurines.
Sales Total
Product Price –=CM ×
Mix
=CM 3 : 2
Vases $40 $10 3$30 40 – 30 = 10 × 3 = 30
Figurines 70 28 256 70 – 42 = 28 × 2 = 56
Total $86 86
$30
42
Variable
Variable
42
Cost
Cost
$30
Operating Income
Contribution Margin
E 7-50
1. a. Variable Cost per Unit = $8,190,000/450,000 = $18.20 8,190,000 / 450,000 = 18.20
b. Contribution Margin per Unit = $3,510,000/450,000 = $7.80 3,510,000 / 450,000 = 7.80
2. Units for Target Income = ($2,254,200 + $296,400)/$7.80 = 327,000 units 2,254,200 + 296,400 / 7.80 = 327,000
3. Additional Operating Income = $50,000 × 0.30 = $15,000 50,000 × 0.30 = 15,000
4. Margin of Safety in Units = 450,000 – 289,000 = 161,000 units 450,000 – 289,000 = 161,000
Margin of Safety in Sales Dollars = $11,700,000 – $7,514,000 = $4,186,000 11,700,000 – 7,514,000 = 4,186,000
CHAPTER 7 Cost-Volume-Profit Analysis
P 7-51
=$380,400/($24 – $18) 380,400 /24 – 18
=$380,400/$6 380,400 / 6
=63,400 units 63,400
3. Contribution Margin Ratio = $6/$24 = 0.25 6 / 24 = 0.25
With additional sales of $160,000, the additional profit would be 0.25 × 160,000 = 40,000
0.25 × $160,000 = $40,000.
P 7-52
=$197,600/($13.50 – $9.85) 197,600 /13.50 – 9.85
=54,137* 54,137
2. Break-Even Units =($197,600 – $23,500)/($13.50 – $9.85) 197,600 – 23,500 /13.50 – 9.85
=47,699* 47,699
1.
PROBLEMS
=
Break-Even Units
1.
Fixed Cost
Price – Variable Cost per Unit
Fixed Cost
Unit Contribution Margin
=
Break-Even Units
CHAPTER 7 Cost-Volume-Profit Analysis
P 7-53
1. Unit Contribution Margin = $6,090,000/203,000 = $30 6,090,000 / 203,000 = 30 units 203,000
Break-Even Point in Units = $4,945,500/$30 = 164,850 4,945,500 / 30 = 164,850 Sales Price 70.00$
Contribution Margin Ratio = $30/$70 = 0.4286* 30 /70 = 0.4286
Break-Even Sales Revenue = $4,945,500/0.4286* = $11,538,731 4,945,500 / 0.4286 = 11,538,731
3. $1,500,000 × 0.4286 = $642,900 1,500,000 × 0.4286 = 642,900
4. Margin of Safety = $14,210,000 – $11,538,731 = $2,671,269 14,210,000 – 11,538,731 = 2,671,269 Revenue 14,210,000$
CHAPTER 7 Cost-Volume-Profit Analysis
P 7-54 Basic Aero
1. Sales mix: 5 : 2
Basic: $3,000,000/$30 = 100,000 units 3,000,000 /30 = 100,000
Aero: $2,400,000/$60 = 40,000 units 2,400,000 /60
=
40,000
Variable Sales Total
Product Price –Cost* = × Mix = CM
Basic sleds $30 $10 5$100 30 – 10 = 20 × 5 100
Aerosleds 60 25 270 60 – 25 = 35 × 2 70
Package $170 170
*Basic Sled Variable Cost: $1,000,000/100,000 = $10 *1,000,000 /100,000 = 10
2. New mix:
Variable Sales Total
Product Price –Cost* = × Mix = CM 5 : 3
Aerosleds 60 25 3105 60 – 25 = 35 × 3 105
Package $205 205
$20
35
Break-Even Packages = ($1,428,000 + $198,900)/$205 = 7,936* 1,428,000 + 198,900 /205 = 7,936
Break-Even Basic Sleds = 7,936 × 5 = 39,680 7,936 × 5 = 39,680
Break-Even Aerosleds = 7,936 × 3 = 23,808 7,936 × 3 = 23,808
* Rounded to the nearest whole package.
3.
Increase in contribution margin for aerosleds (12,000 × $35)……………………..….…………..….…………..….…………..….…………..….…………..….…………..….…………..….…..….…
12,000 × 35 = 420,000
Decrease in contribution margin for basic sleds (5,000 × $20)……………………..….…………..….…………..….…………..….…………..….…………..….…………..….…………..….…..…….
5,000 × 20 = (100,000)
Increase in total contribution margin……………………………………………………………………………………………………
Less: Additional fixed cost……………………………………………………………………………….………………………
$ 125,000
$ 320,000
$ 420,000
(100,000)
Contribution
Margin
$20
35
Margin
Contribution
CHAPTER 7 Cost-Volume-Profit Analysis
P 7-55
1. Break-Even Units = $58,140/($3.40 – $2.55) = 68,400 58,140 / 3.40 – 2.55 = 68,400
Margin of Safety in Units = 81,600 – 68,400 = 13,200 81,600 – 68,400 = 13,200
3. Units for Target Profit = ($58,140 + $25,500)/($3.40 – $2.55) 58,140 + 25,500 / 3.40 – 2.55
=
4. Operating Income = Sales – (Variable Cost Ratio × Sales) – Fixed Cost 208,080 / 277,440 = 0.75
0.10 Sales = Sales – (0.75 × Sales) – $58,140 0.10 = ? – 0.75 × ? – 58,140
0.10 Sales = 0.25 Sales – $58,140 0.10 = 0.25 – 58,140
$58,140 = (0.25 Sales – 0.10 Sales) 58,140 = 0.25 – 0.10 ?
$58,140 = 0.15 Sales 58,140 = 0.15
Sales = $387,600 ? = 387,600
P 7-56
1. Contribution Margin Ratio = $294,592/$460,300 = 0.64, or 64% 294,592 / 460,300 = 0.64
4. Additional variable expense: $460,300 × 0.04 = $18,412 460,300 × 4% = 18,412
New Contribution Margin = $294,592 – $18,412 = $276,180 294,592 – 18,412 = 276,180
New Contribution Margin Ratio = $276,180/$460,300 = 0.60 276,180 / 460,300 = 0.60
Break-Even Sales Revenue = $150,000/0.60 = $250,000 150,000 / 0.60 = 250,000
The effect is to increase the break-even sales revenue.
98,400
CHAPTER 7 Cost-Volume-Profit Analysis
P 7-56 (Concluded)
Operating leverage will decrease because the increase in variable cost
(the sales commission) causes a decrease in the contribution margin.
Elgart should pay the commission because profit would increase by
$29,588.
Floor lamps Desk lamps
2. Of total sales revenue, 60% is produced by floor lamps and 40% by desk lamps. 60 40
Floor lamps = (0.60 × $600,000)/$30 = 12,000 units 600,000 × 60% /30 = 12,000
Desk lamps = (0.40 × $600,000)/$20 = 12,000 units 600,000 × 40% /20 = 12,000
Thus, the sales mix is 1:1.
Variable Sales Total 400,000 20.00
Product Price –Cost = × Mix =CM 13.33
Floor lamps $30 $20.00 $10.00 1 $10.00 30 – 20.00 = 10.00 × 1 = 10.00
Desk lamps 20 13.33 6.67 1 6.67 20 – 13.33 = 6.67 × 1 = 6.67
Package $16.67 16.67
= $150,000/$16.67 150,000 / 16.67 = 9,000
= 9,000
Floor lamps: 1 × 9,000 = 9,000 1 × 9,000 = 9,000
Desk lamps: 1 × 9,000 = 9,000 1 × 9,000 = 9,000
Operating Leverage
=
Contribution Margin
Number of Packages
=
Contribution
Margin
Fixed Cost
*
*
CHAPTER 7 Cost-Volume-Profit Analysis
P 7-58
1.
CM
=
$3 =$3 12 – 9 = 3 8 – 5 = 3
CM ratio
=
0.25 = 0.375 3 / 12 = 0.25 3 / 8 = 0.375
3. Sales mix (from Requirement 2): 1 door handle to 2 trim kits 1 : 2
Sales Total
Product Price –= × Mix CM
Door handle $12 1 $3.00 12 – 9 = 3 × 1 = 3.00
Trim kit 8 2 6.00 8 – 5 = 3 × 2 = 6.00
Package $9.00 9.00
Break-Even Packages = $146,000/$9 = 16,222* 146,000 / 9 = 16,222
Door Handles = 1 × 16,222 = 16,222 1 × 16,222 = 16,222
Trim Kits = 2 × 16,222 = 32,444 2 × 16,222 = 32,444
*Rounded
P 7-59
1. Break-Even Units = $300,000/$14* = 21,429** 300,000 / 14 = 21,429
*$406,000/29,000 = $14 406,000 / 29,000 = 14
** Rounded
Contribution Margin Ratio
=
$406,000/$1,218,000 = 0.3333 406,000 / 1,218,000 = 0.3333
Break-Even in Sales Dollars
=
$300,000/0.3333 = 900,090 300,000 / 0 = $900,090
$9
5
$12 – $9
$3/$12
Contribution
Margin
$3
3
Trim Kits
$8 – $5
$3/$8
Variable
Cost
=
Door Handles
CHAPTER 7 Cost-Volume-Profit Analysis
P 7-59 (Concluded)
3.
Sales…………………………………………………………………………………..…………………..………….
$1,218,000 1,218,000
Variable cost (0.45 × $1,218,000)……………….…………..………………..…...………….…………..……………..…...………….…………..…………….…………..……….
548,100 0.45 × 1,218,000 = 548,100
Contribution margin………………………………..………………………………...………………………………..……………………
$ 669,900
Fixed cost…………………..…………………….…………………………………..………………………………………..
550,000 550,000 550,000 / 23.10 = 23,810
P 7-60
110,000
= $647,400/$830,000 = 0.78, or 78% 647,400 / 830,000 = 0.78
=($830,000 – $647,400)/$830,000 830,000 – 647,400 / 830,000 = 0.22
= 0.22, or 22%
3. Margin of Safety = Sales – Break-Even Sales
=$830,000 – $500,000 = $330,000 830,000 – 500,000 = 330,000
(Sales – Variable Costs)
Sales
Variable Costs
Sales
1.
=
=
Contribution Margin Ratio
Variable Cost Ratio
CHAPTER 7 Cost-Volume-Profit Analysis
P 7-61
1. Income = Revenue – Variable Cost – Fixed Cost
$0 =2,400P – ($42 × 2,400) – $67,200 0 = 2,400 – 42 × 2,400 – 67,200
$0 =2,400P – $100,800 – $67,200 0 = 2,400 – 100,800 – 67,200
$168,000 = 2,400P 168,000 = 2,400
P =$70 = 70
P 7-62
1. Contribution Margin per Unit = $5.60 – $4.20* 5.60 – 4.20 = 1.40
= $1.40
*Variable cost per unit: 0.70 + 0.35 + 1.85 + 0.34 + 0.76
$0.70 + $0.35 + $1.85 + $0.34 + $0.76 + $0.20 = $4.20 + 0.20 = 4.20
Contribution Margin Ratio = $1.40/$5.60 = 0.25 1.40 / 5.60 = 0.25
3.
Sales ($5.60 × 35,000)…….…………………………..……………………………………………………………………………..……………………………….………….
$196,000 5.60 × 35,000 = 196,000
Variable cost ($4.20 × 35,000)………………………………………..………………………………..……………………………………..…………………..
147,000 4.20 × 35,000 = 147,000
Contribution margin………………….……………………………….…………………………………………………………………………………
$ 49,000
Fixed cost…………………………………………………….………………………………..……………………….………………..
44,800 32,300 + 12,500 = 44,800
Operating income………………………………………….………………………………………………………..…………………
$ 4,200
4. Margin of Safety = $196,000 – $179,200 = $16,800 196,000 – 179,200 = 16,800
Yes, operating income will increase by $14,000 ($18,200 – $4,200).
CHAPTER 7 Cost-Volume-Profit Analysis
P 7-63
1. Duncan: $75,000/$25,000 = 3 75,000 / 25,000 = 3
Macduff:
$225,000/$25,000 = 9
225,000 / 25,000 = 9
2. 300,000 / 375,000 = 0.80
Contribution margin ratio = $75,000/$375,000 = 0.20 75,000 / 375,000 = 0.20
Break-even sales = $50,000/0.20 50,000 / 0.20
Break-even sales = $250,000 = 250,000
Macduff must sell more than Duncan to break even because it must cover
Macduff
$150,000 more in total fixed cost (it is more highly leveraged). 225,000 – 75,000 = 150,000
3. Duncan: 3 × 30% = 90% 3 × 30% = 90%
Macduff: 9 × 30% = 270% 9 × 30% = 270%
The percentage increase in profits for Macduff is much higher than Duncan’s
increase because Macduff has a higher degree of operating leverage (i.e., it
has a larger amount of fixed costs in proportion to variable cost as compared
to Duncan). Once fixed cost is covered, additional revenue must cover only
variable cost, and 60% of Macduff’s revenue above break-even is profit,
whereas only 20% of Duncan’s revenue above break-even is profit.
Duncan
Duncan
Macduff
Duncan
Macduff
Duncan
CHAPTER 7 Cost-Volume-Profit Analysis
P 7-64
1. Contribution margin ratios:
May of current year = $23,910/$43,560 = 0.5489, or 54.89% 23,910 / 43,560 = 0.5489 (all links)
May of prior year = $23,400/$41,700 = 0.5612, or 56.12% 23,400 / 41,700 = 0.5612
2. Fixed costs:
3. Margin of safety:
May of current year = $43,560 – $37,038 = $6,522 43,560 – 37,038 = 6,522 (all links)
May of prior year = $41,700 – $24,590 = $17,110 41,700 – 24,590 = 17,110
4. Clearly, the sharp rise in fixed costs from the prior year to the current year has Current Prior
had a strong impact on the break-even point and the margin of safety. Kicker 17,000 16,000 Purchase price paid
will need to ensure that tight cost control is exercised since the margin of 1,400 1,200 Additional labor & supplies
CHAPTER 7 Cost-Volume-Profit Analysis
Case 7-65
1. Let X be a package of 3 Grade I cabinets and 7 Grade II cabinets. 3 : 7
0.30X($3,400) + 0.70X($1,600) = 0.30 × 3,400 + 0.70 × 1,600 = 1,600,000
= 748* packages = 748
* Rounded to the nearest package.
Grade I: 0.3 × 748 = 224* cabinets 0.30 × 748 = 224
Grade II: 0.7 × 748 = 524* cabinets 0.70 × 748 = 524
2. Contribution Sales Total
Product Price –= Margin × Mix = CM
I $3,400 $714 3 $2,142 3,400 – 2,686 = 714 × 3 = 2,142
II 1,600 272 7 1,904 1,600 – 1,328 = 272 × 7 = 1,904
Package $4,046 4,046
3. Variable Contribution Sales Total 2,686 × 2,686 – 9% = 2,444
Product Price –Cost = Margin × Mix = CM 1,328 × 1,328 – 9% = 1,208
I $3,400 $2,444 $956 3 $2,868 3,400 – 2,444 = 956 × 3 = 2,868
II 1,600 1,208 392 7 2,744 1,600 – 1,208 = 392 × 7 = 2,744
Package $5,612 5,612
[($3,400 × 3) + ($1,600 × 7)] X = 3,400 × 3 + 1,600 × 7 = 21,400
$21,400X = 21,400 × ? = 1,000,000 1,600,000 – 600,000
CASES
$1,600,000 – $600,000
$1,600,000
Variable
Cost
$2,686
1,328
$1,600,000 – $600,000
*
*
*
*
CHAPTER 7 Cost-Volume-Profit Analysis
Case 7-65 (Continued)
If the new break-even point is interpreted as a revised break-even point for the
current year, then total fixed cost must be reduced by the contribution margin
already earned (through the first five months) to obtain the units that must be
sold for the last seven months. These units would then be added to those sold
during the first five months:
4. Variable Sales Total 27 + 28 = 55 196
Product Price –Cost = × Mix = CM
*Sorry, unable to replicate unit calculation from data in the Case.
I $3,400 $2,686 $714 1$714 3,400 – 2,686 = 714 × 1 = 714
II 1,600 1,328 272 1272 1,600 – 1,328 = 272 × 1 = 272
Package $986 5,000 986
New sales revenue: $1,000,000 × 1.30 = $1,300,000 1,000,000 × 130% = 1,300,000
= $1,300,000 5,000 × ? = 1,300,000
= 260 packages 1,300,000 / 5,000 = 260
Thus, 260 units of each cabinet will be sold during the rest of the year.
Effect on profits:
Change in contribution margin: 714 × 260 – 141 –
[$714 × (260 – 141)] – [$272 × (329 – 260)]…………………………………………………………………………………………..
$66,198 272 × 329 – 260 = 66,198
Increase in fixed costs:
$70,000 × (7/12)…………………………………………………………………………………….
40,833 70,000 × 7 / 12 = 40,833
Increase in operating income……………………………………………………………………………………………………….
$25,365
Contribution
Margin
$5,000X
X
*
CHAPTER 7 Cost-Volume-Profit Analysis
Case 7-66
1. Break-Even Point in Units =
First process: $100,000/($30 – $10) = 5,000 100,000 / 30 – 10 = 5,000
Second process: $200,000/($30 – $6) = 8,333 200,000 / 30 – 6 = 8,333
The manual process is more profitable if sales are less than 25,000 cases; the
automated process is more profitable at a level greater than 25,000 cases. It is
important for the manager to have a sales forecast to help in deciding which
process should be chosen.
3. The right to decide which process should be chosen belongs to the divisional
manager. Danna has an ethical obligation to report the correct information to her
superior. By altering the sales forecast, Danna unfairly and unethically influenced
the decision-making process. Managers certainly have a moral obligation to
assess the impact of their decisions on employees, and every effort should be
taken to be fair and honest with employees. Danna’s behavior, however, is not
justified by the fact that it helped a number of employees retain their employment.
First, Danna had no right to make that decision. Danna certainly has the right to
voice her concerns about the impact of automation on the employees’ well-being.
In doing so, perhaps the divisional manager would come to the same conclusion
even though the automated system appears to be more profitable. Second, the
choice to select the manual system may not be the best for the employees anyway.
The divisional manager may possess more information, making the selection of
the automated system the best alternative for all concerned, provided the sales
volume justifies its selection. For example, if the automated system is viable, the
divisional manager may have plans to retrain and relocate the displaced workers
in better jobs within the company. Third, her motivation for altering the forecast
seems more driven by her friendship with Jerry Johnson than any legitimate
concerns for the layoff of other employees. Danna should examine her reasoning
carefully to assess the real reasons for her behavior. Perhaps in so doing, the
conflict of interest that underlies her decision will become apparent.
Fixed Cost
Unit Contribution Margin
*