CHAPTER 7 Cost-Volume-Profit Analysis
E 7-43
1. Sales mix is 3:1 (three times as many DVDs are sold as equipment sets).
2.
V
ariable Sales Total
Product Price
–
Cost = CM × Mix = CM
DVDs $ 8 $ 4 $ 4 3 $12
Equipment sets 25 15 10 1 10
Total $22
E 7-44
1. Sales mix is 3:1:2 (three times as many DVDs will be sold as equipment sets,
and twice as many yoga mats will be sold as equipment sets).
2.
V
ariable Sales Total
Product Price
–
Cost = CM × Mix = CM
DVDs $ 8 $ 4 $ 4 3 $12
Equipment sets 25 15 10 1 10
Yoga mats 15 9 6 2 12
Total $34
3.
Sales……………………………………………………………………………
Total variable cost……………………………………………………………
Contribution margin……………………………………………………
…
Total fixed cost………………………………………………………………
…
Operating income…………………………………………………………
4. Margin of Safety = $355,500 – $264,638 = $90,862
Cherry Blossom Products Inc.
Income Statement
For the Coming Year
$ 39,100
113,900
$355,500
202,500
$153,000
CHAPTER 7 Cost-Volume-Profit Analysis
E 7-45
1. Sales mix is 4:10:1 (four times as many portable grills will be sold as smokers,
and 10 times as many stationary grills will be sold as smokers).
2.
V
ariable Sales Total
Product Price
–
Cost = CM × Mix = CM
Portable $ 90 $ 45 $ 45 4 $180
Stationary 200 130 70 10 700
Smoker 250 140 110 1 110
Total $990
3.
Sales…………………………………………………………………………
Total variable cost………………………………………………………
…
Contribution margin…………………………………………………
…
Total fixed cost……………………………………………………………
…
Operating income……………………………………………………
…
4. Margin of Safety = $13,050,000 – $5,611,653 = $7,438,347
Income Statement
For the Coming Year
Texas-Q Company
$ 2,821,500
$13,050,000
8,100,000
$ 4,950,000
2,128,500
CHAPTER 7 Cost-Volume-Profit Analysis
E 7-46
1.
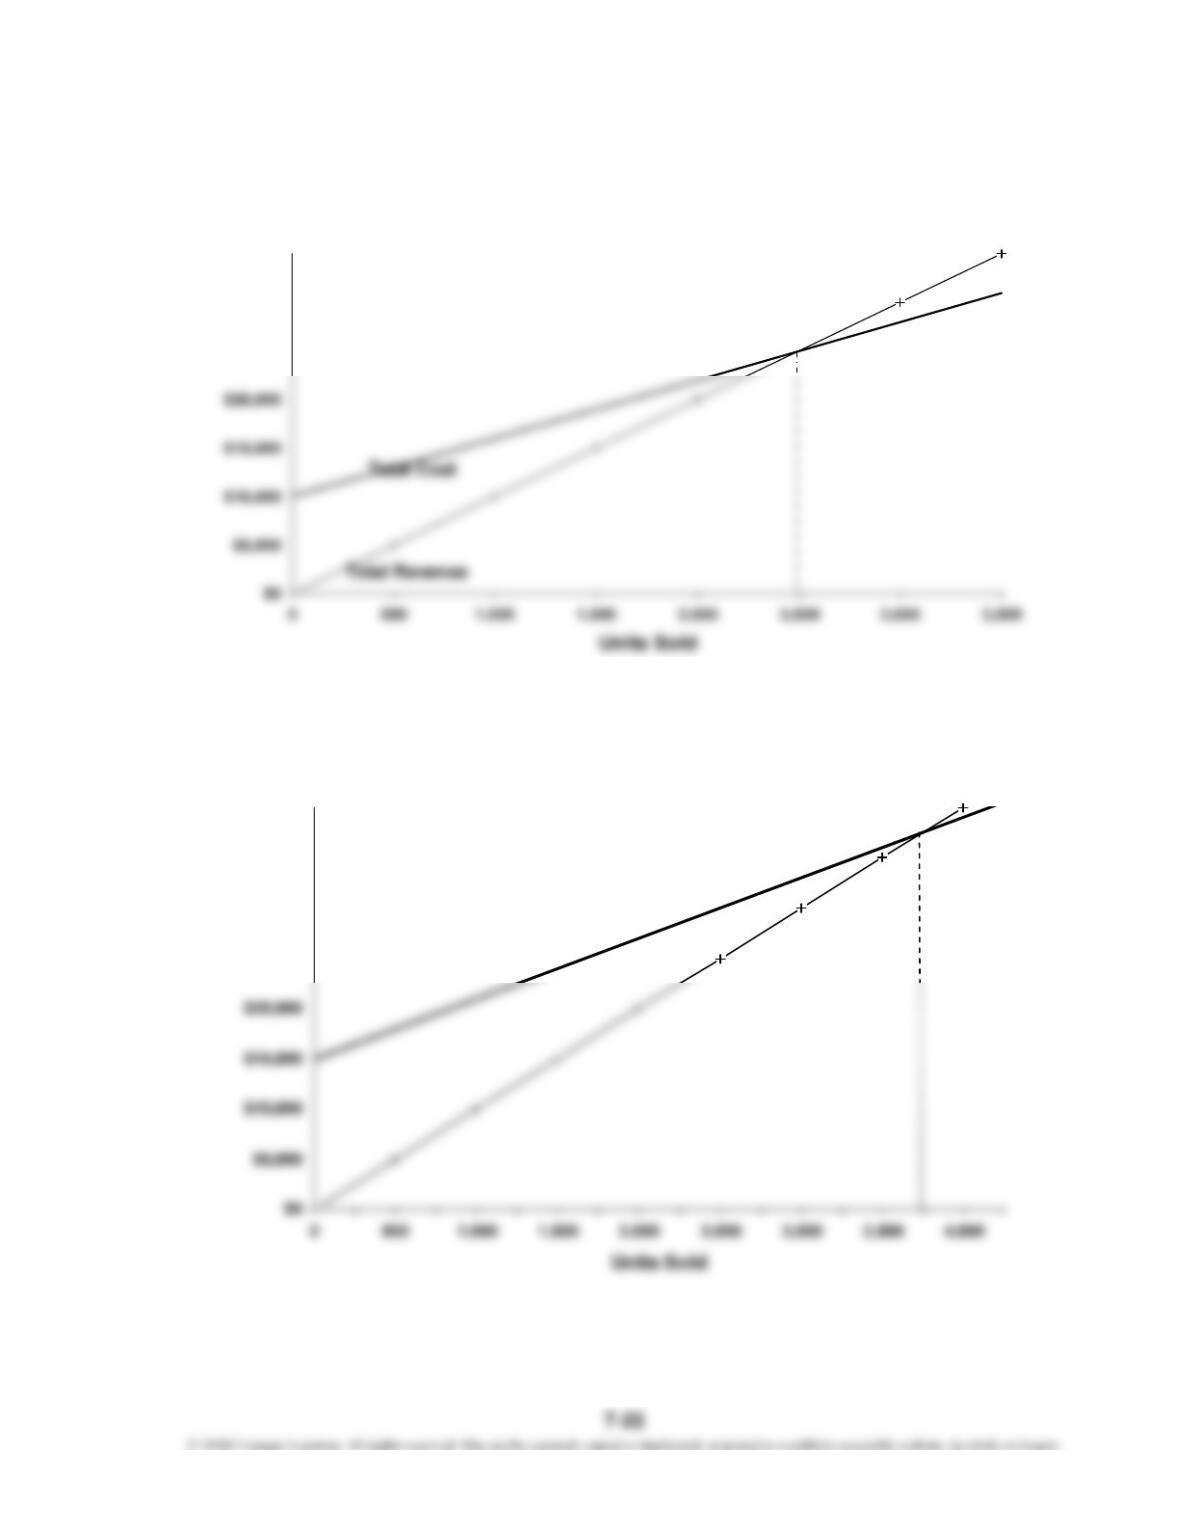
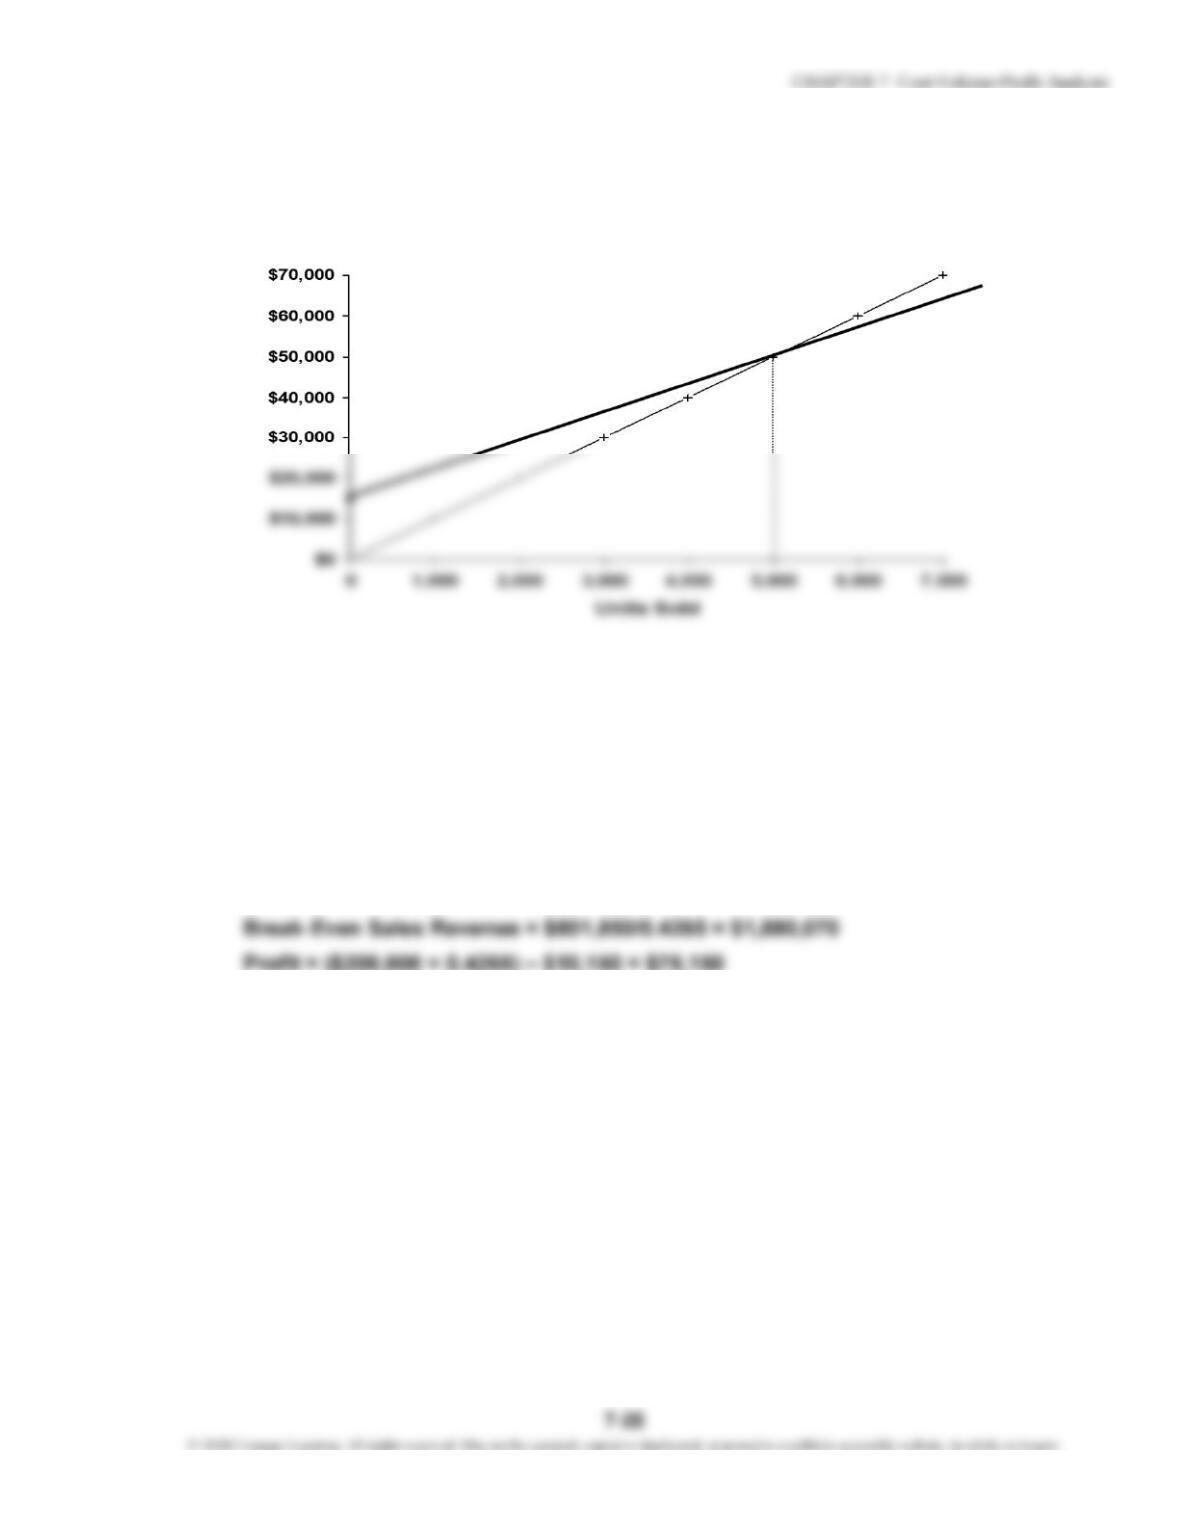
Break-Even Point = 2,500 units; the plus-marked line is total revenue, and the
heavy solid line is total cost.
2. a. Fixed cost increases by $5,000:
Break-Even Point = 3,750 units
$25,000
$30,000
$35,000
$25,000
$30,000
$35,000
$40,000
CHAPTER 7 Cost-Volume-Profit Analysis
E 7-46 (Continued)
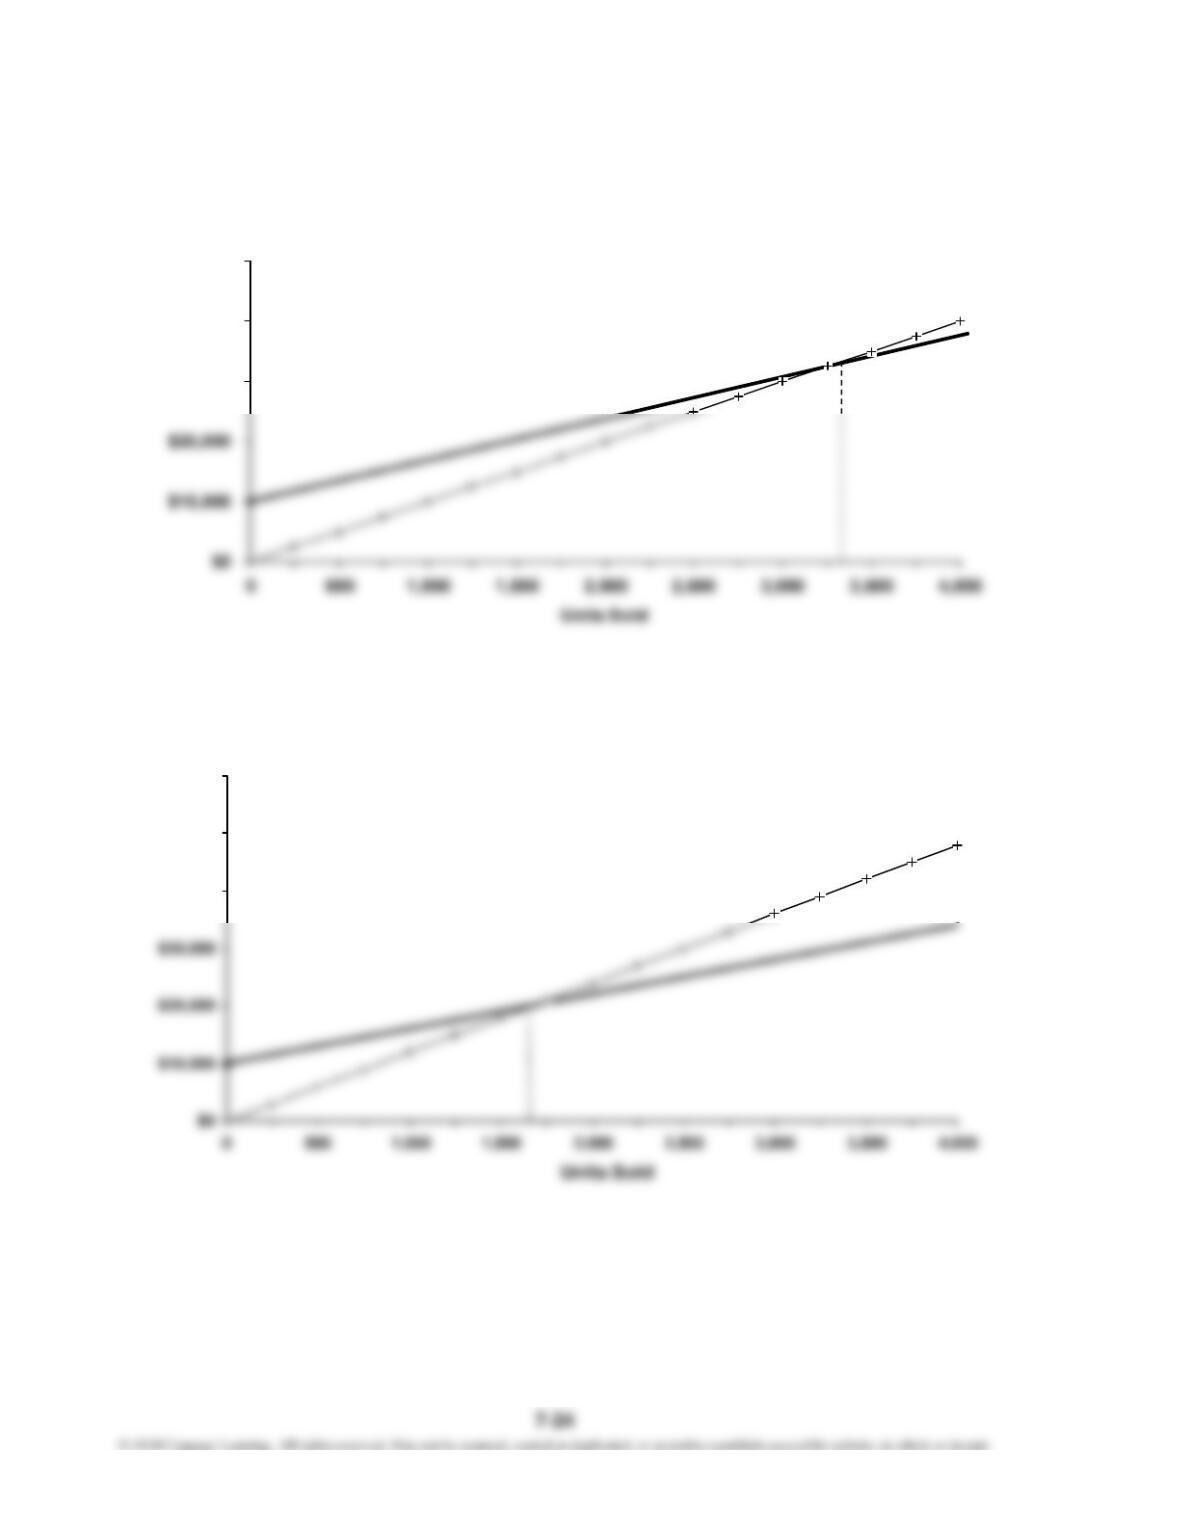
2. b. Unit variable cost increases to $7:
Break-Even Point = 3,333 units
2. c. Unit selling price increases to $12:
Break-Even Point = 1,667 units
$40,000
$50,000
$60,000
$30,000
$40,000
$50,000
E 7-46 (Concluded)
2. d. Both fixed cost and unit variable cost increase:
Break-Even Point = 5,000 units
E 7-47
1. Unit Contribution Margin = $791,700/54,600 = $14.50
Break-Even Units = $801,850/$14.50 = 55,300
2. Operating Income = 10,000 × $14.50 = $145,000
3. Contribution Margin Ratio = $14.50/$34.00 = 0.4265, or 42.65%
CHAPTER 7 Cost-Volume-Profit Analysis
E 7-48
1. Break-Even Sales Dollars = $733,320/0.42* = $1,746,000
*Contribution Margin Ratio = $756,000/$1,800,000 = 0.42, or 42%
3. Degree of Operating Leverage =
= $756,000/$22,680
= 33.33*
E 7-49
1. Sales Total
Product Price
–
= CM × Mix = CM
V
ases $40 $10 2 $20
Figurines 70 28 1 28
Total $48
Break-Even Packages = $30,000/$48 = 625
2. The new sales mix is 3 vases to 2 figurines.
Sales Total
Product Price
–
= CM × Mix = CM
V
ases $40 $10 3 $30
Figurines 70 28 2 56
Total $86
Break-Even Packages = $35,260/$86 = 410
Break-Even Vases = 3 × 410 = 1,230
Break-Even Figurines = 2 × 410 = 820
Operating Income
Contribution Margin
$30
42
Variable
Variable
42
Cost
Cost
$30
CHAPTER 7 Cost-Volume-Profit Analysis
E 7-50
1. a.
V
ariable Cost per Unit = $8,190,000/450,000 = $18.20
b. Contribution Margin per Unit = $3,510,000/450,000 = $7.80
c. Contribution Margin Ratio = $3,510,000/$11,700,000 = 0.30, or 30%
d. Break-Even Units = $2,254,200/$7.80 = 289,000 units
2. Units for Target Income = ($2,254,200 + $296,400)/$7.80 = 327,000 units
3. Additional Operating Income = $50,000 × 0.30 = $15,000
4. Margin of Safety in Units = 450,000 – 289,000 = 161,000 units
Margin of Safety in Sales Dollars = $11,700,000 – $7,514,000 = $4,186,000
CHAPTER 7 Cost-Volume-Profit Analysis
P 7-51
= $380,400/($24 – $18)
= $380,400/$6
= 63,400 units
3. Contribution Margin Ratio = $6/$24 = 0.25
With additional sales of $160,000, the additional profit would be
0.25 × $160,000 = $40,000.
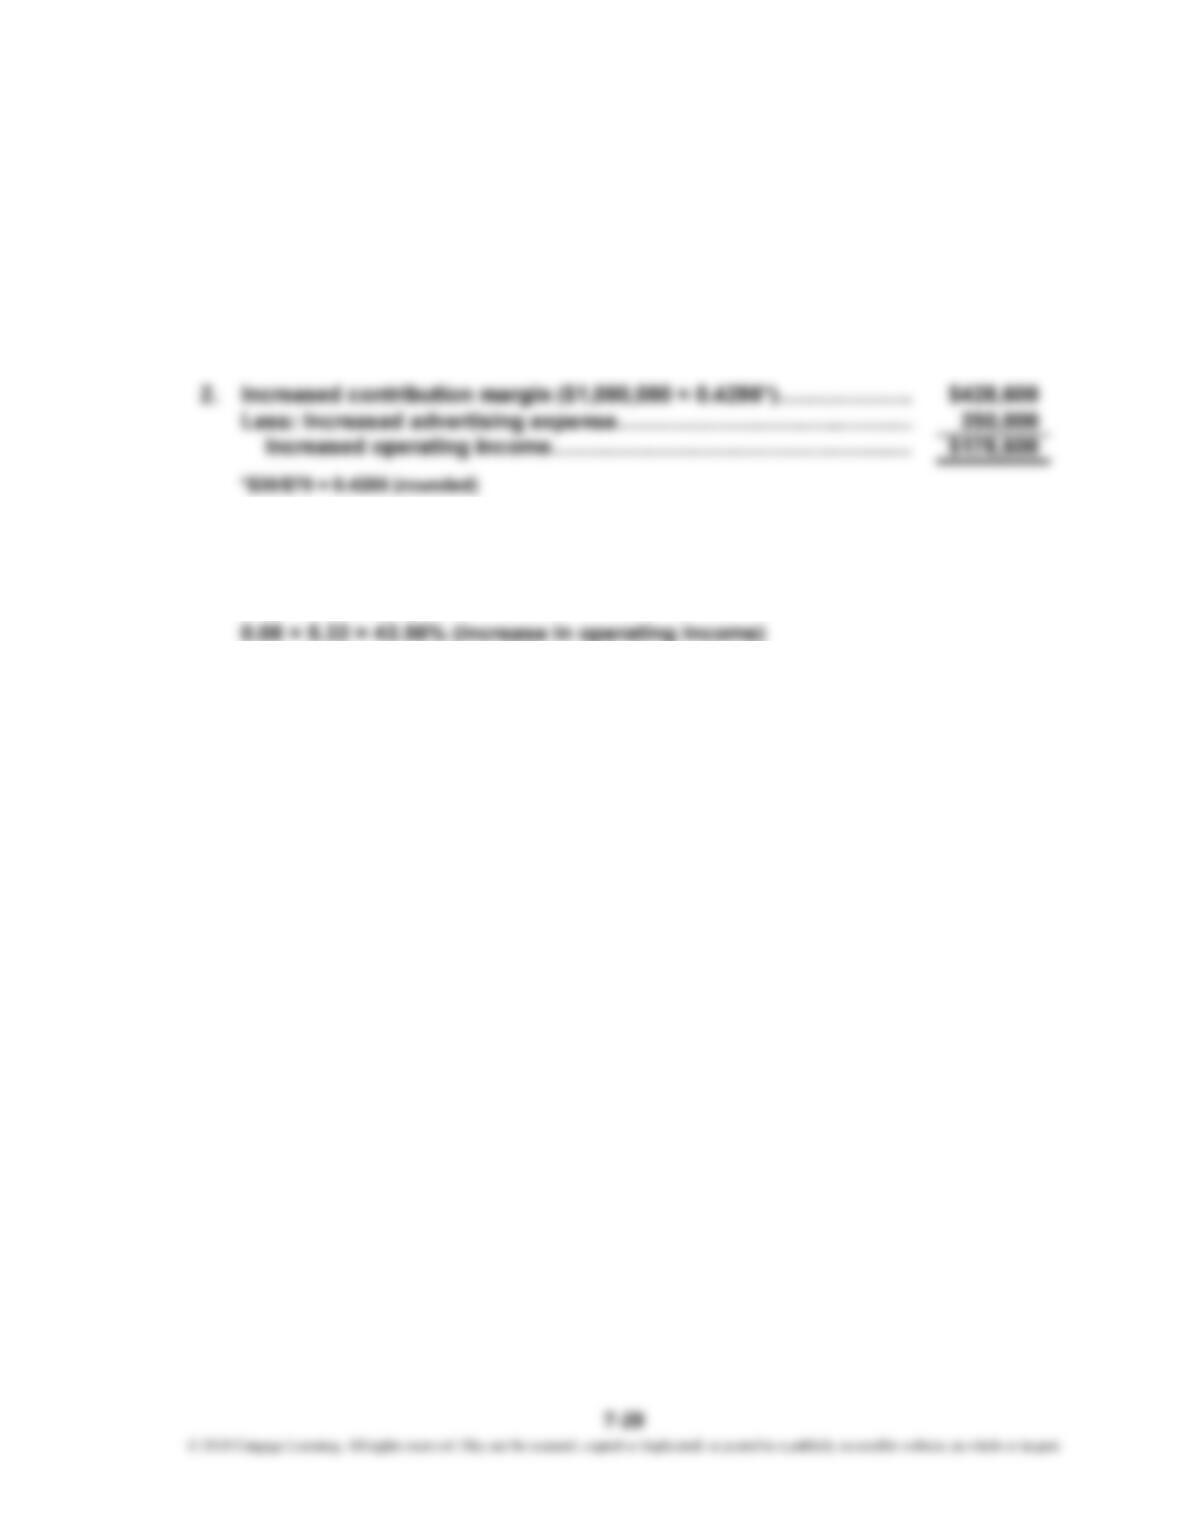
P 7-52
= $197,600/($13.50 – $9.85)
= 54,137*
2. Break-Even Units = ($197,600 – $23,500)/($13.50 – $9.85)
= 47,699*
1.
PROBLEMS
=Break-Even Units1.
Fixed Cost
Price – Variable Cost per Unit
Fixed Cost
Unit Contribution Margin
=Break-Even Units
CHAPTER 7 Cost-Volume-Profit Analysis
P 7-53
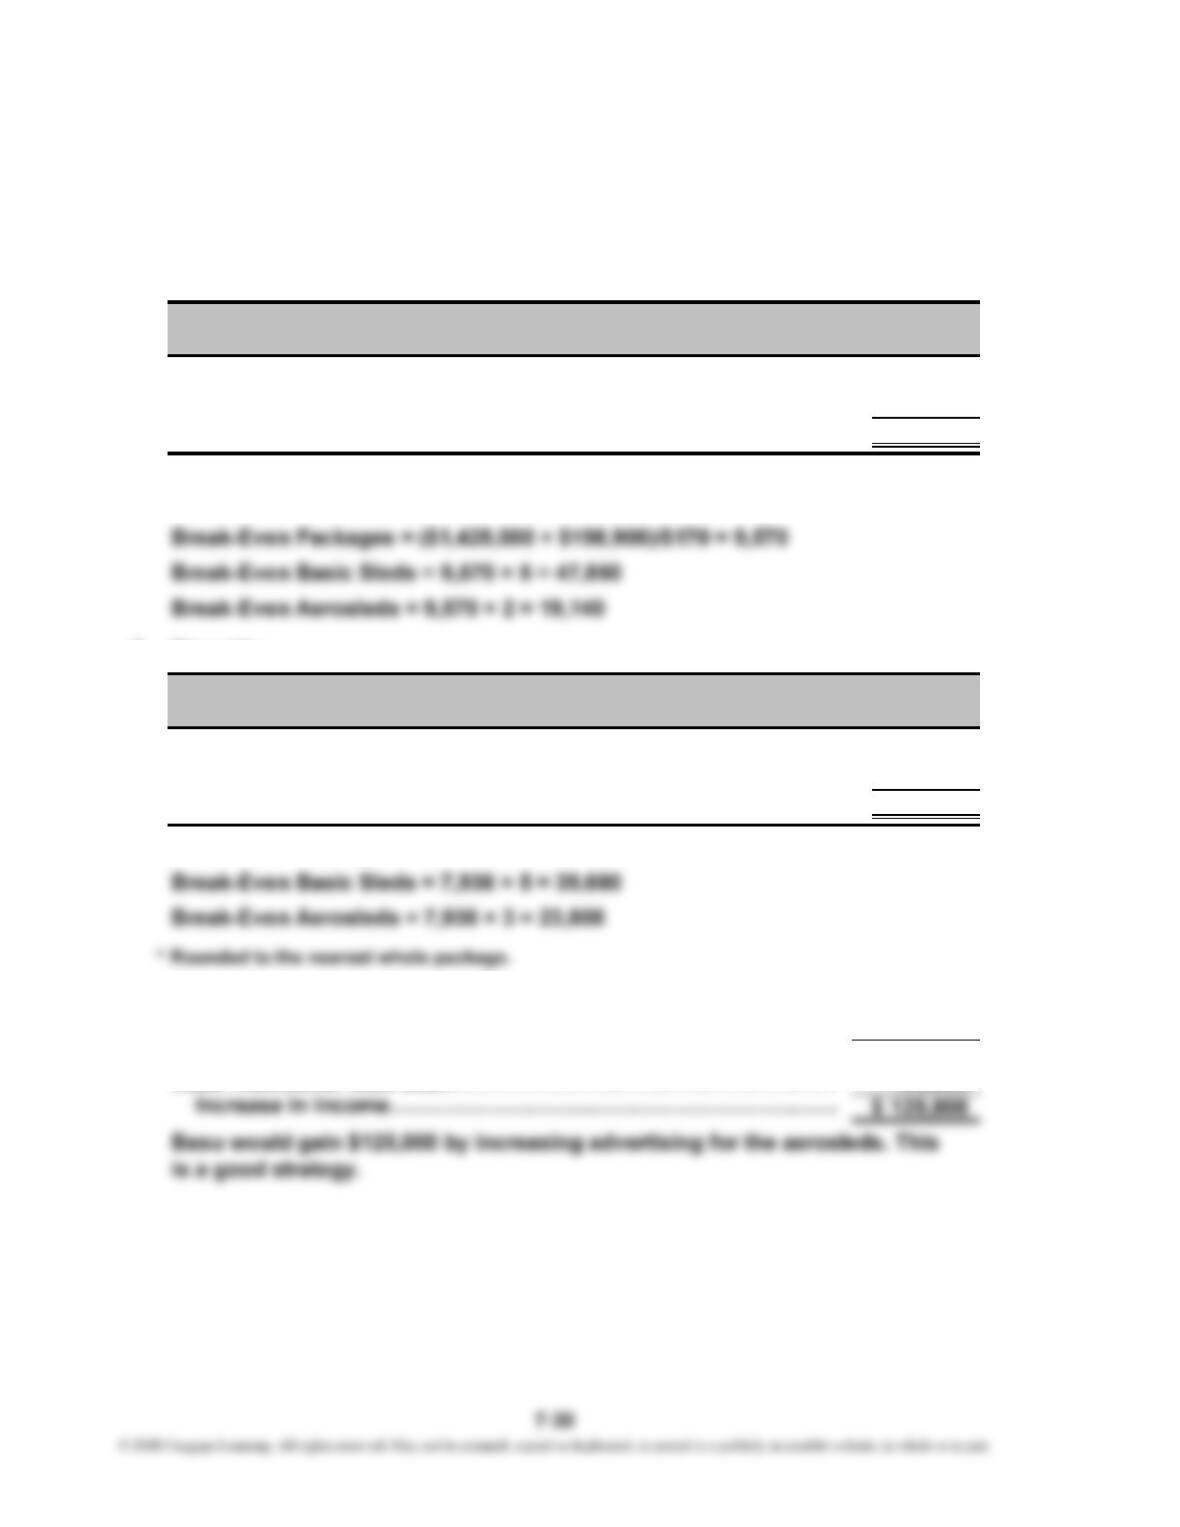
1. Unit Contribution Margin = $6,090,000/203,000 = $30
Break-Even Point in Units = $4,945,500/$30 = 164,850
Contribution Margin Ratio = $30/$70 = 0.4286*
Break-Even Sales Revenue = $4,945,500/0.4286* = $11,538,731
* Rounded
3. $1,500,000 × 0.4286 = $642,900
4. Margin of Safety = $14,210,000 – $11,538,731 = $2,671,269
5. Degree of Operating Leverage = $6,090,000/$1,144,500 = 5.32
CHAPTER 7 Cost-Volume-Profit Analysis
P 7-54
1. Sales mix:
Basic: $3,000,000/$30 = 100,000 units
Aero: $2,400,000/$60 = 40,000 units
V
ariable Sales Total
Product Price
–
Cost* = × Mix = CM
Basic sleds $30 $10 5 $100
Aerosleds 60 25 2 70
Package $170
*Basic Sled Variable Cost: $1,000,000/100,000 = $10
Aerosled Variable Cost: $1,000,000/40,000 = $25
2. New mix:
V
ariable Sales Total
Product Price
–
Cost* = × Mix = CM
Basic sleds $30 $10 5 $100
Aerosleds 60 25 3 105
Package $205
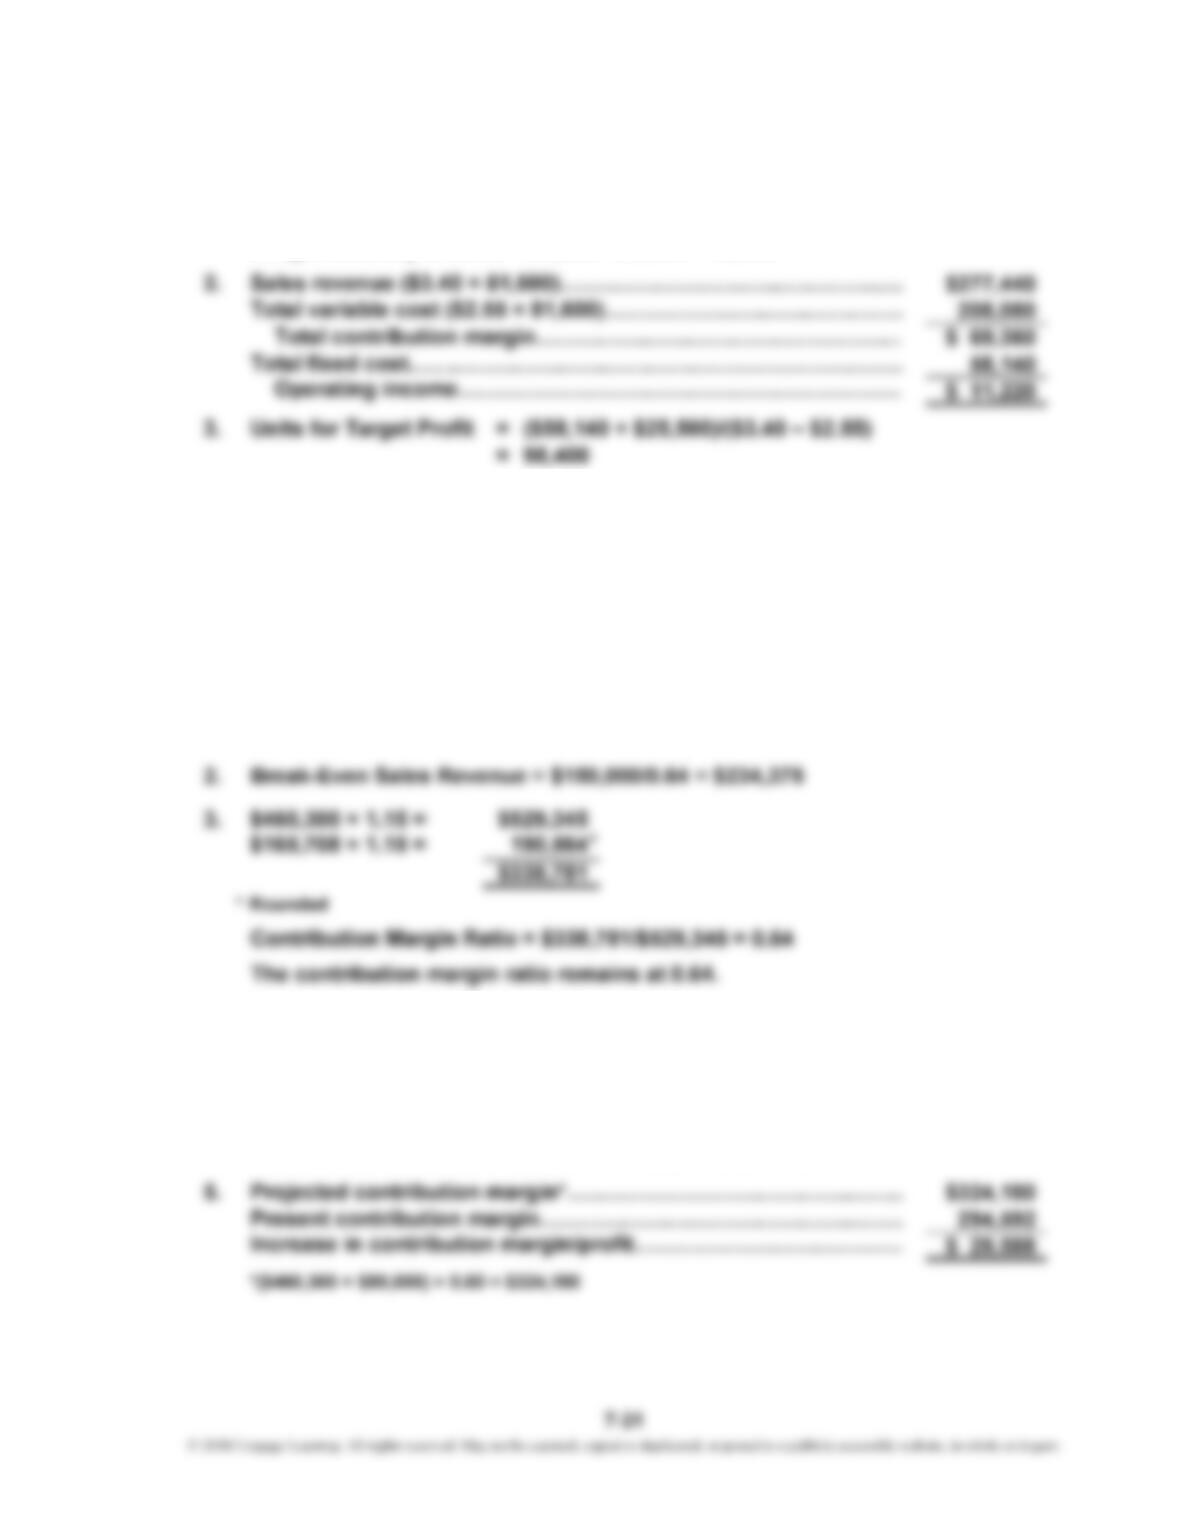
Break-Even Packages = ($1,428,000 + $198,900)/$205 = 7,936*
3. Increase in contribution margin for aerosleds (12,000 × $35)……
…
Decrease in contribution margin for basic sleds (5,000 × $20)……
Increase in total contribution margin………………………………
…
Contribution
Margin
$20
35
$20
35
Margin
Contribution
$ 420,000
(100,000)
$ 320,000
CHAPTER 7 Cost-Volume-Profit Analysis
P 7-55
1. Break-Even Units = $58,140/($3.40 – $2.55) = 68,400
Margin of Safety in Units = 81,600 – 68,400 = 13,200
4. Operating Income = Sales – (Variable Cost Ratio × Sales) – Fixed Cost
0.10 Sales = Sales – (0.75 × Sales) – $58,140
0.10 Sales = 0.25 Sales – $58,140
$58,140 = (0.25 Sales – 0.10 Sales)
$58,140 = 0.15 Sales
Sales = $387,600
P 7-56
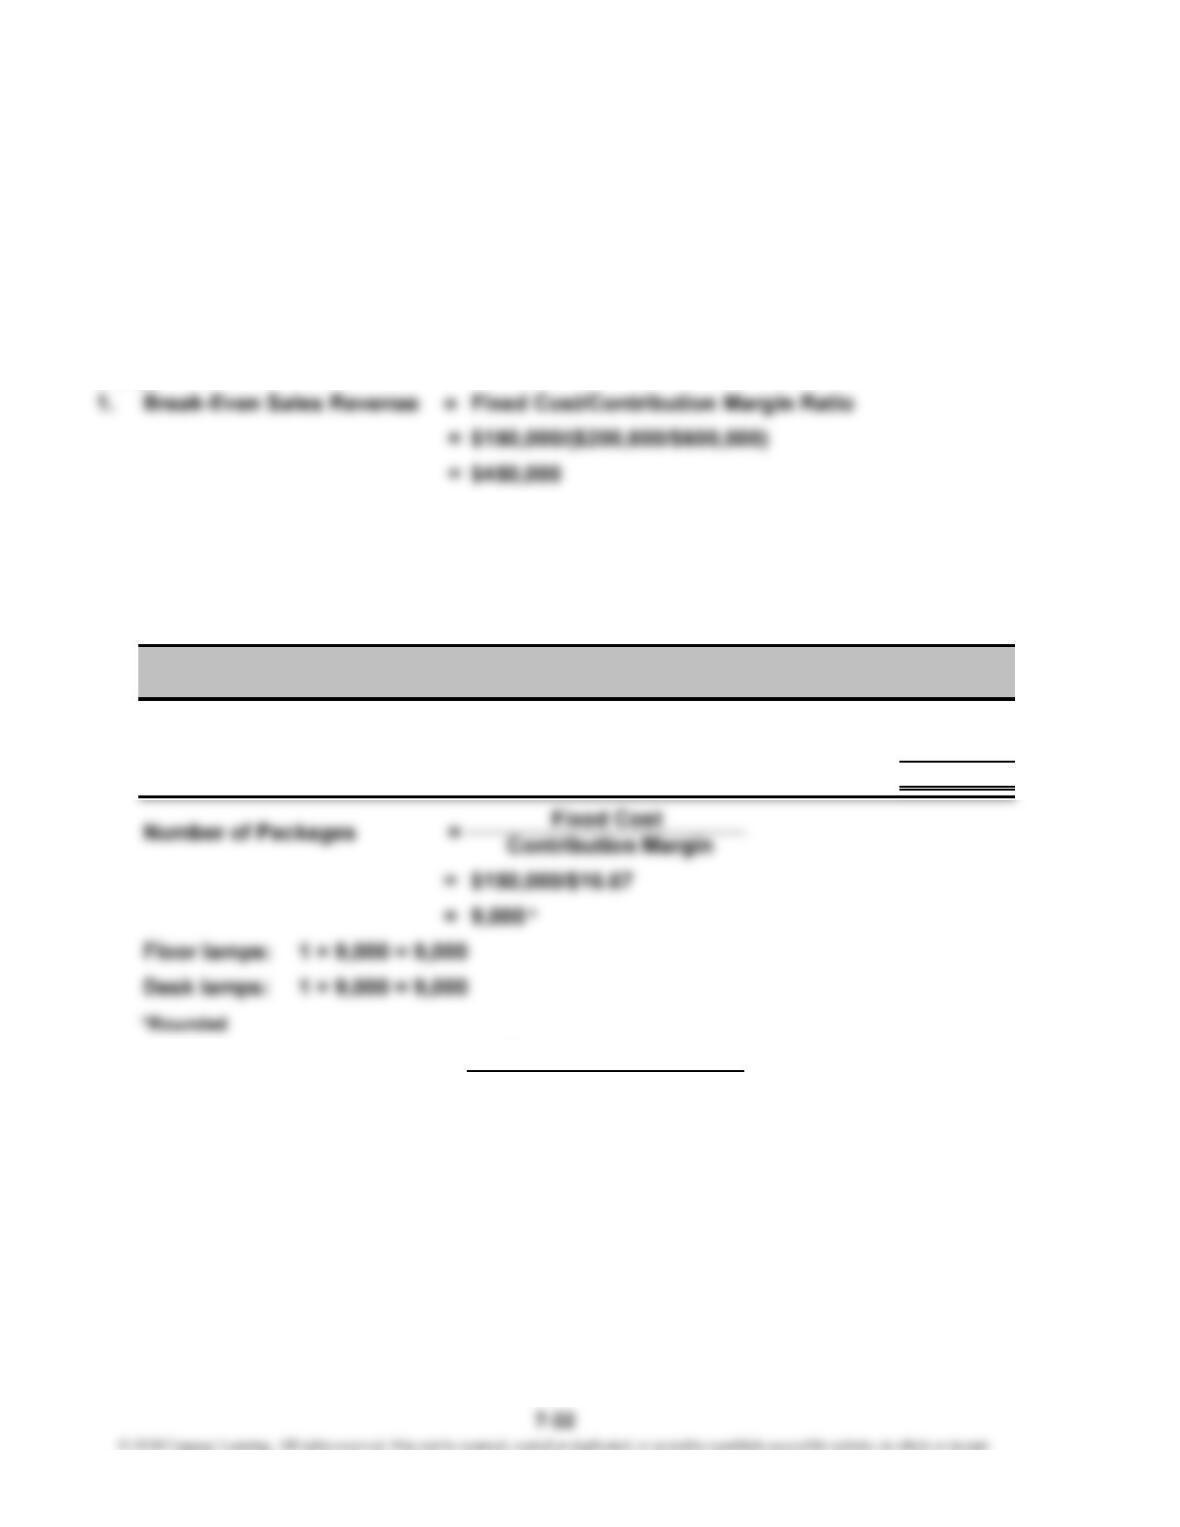
1. Contribution Margin Ratio = $294,592/$460,300 = 0.64, or 64%
4. Additional variable expense: $460,300 × 0.04 = $18,412
New Contribution Margin = $294,592 – $18,412 = $276,180
New Contribution Margin Ratio = $276,180/$460,300 = 0.60
Break-Even Sales Revenue = $150,000/0.60 = $250,000
The effect is to increase the break-even sales revenue.
CHAPTER 7 Cost-Volume-Profit Analysis
P 7-56 (Concluded)
Operating leverage will decrease because the increase in variable cost
(the sales commission) causes a decrease in the contribution margin.
Elgart should pay the commission because profit would increase by
$29,588.
P 7-57
2. Of total sales revenue, 60% is produced by floor lamps and 40% by desk lamps.
Floor lamps = (0.60 × $600,000)/$30 = 12,000 units
Desk lamps = (0.40 × $600,000)/$20 = 12,000 units
Thus, the sales mix is 1:1.
V
ariable Sales Total
Product Price
–
Cost = × Mix = CM
Floor lamps $30 $20.00 $10.00 1 $10.00
Desk lamps 20 13.33 6.67 1 6.67
Package $16.67
= $200,000/$50,000
=4.0
Percentage Increase in Profits = 4.0 × 40% = 160%
3.
Contribution Margin
Operating Leverage =
Operating Income
Contribution
Margin
*
CHAPTER 7 Cost-Volume-Profit Analysis
P 7-58
1.
CM = $3 = $3
CM ratio = 0.25 = 0.375
3. Sales mix (from Requirement 2): 1 door handle to 2 trim kits
Sales Total
Product Price
–
= × Mix CM
Door handle $12 1 $3.00
Trim kit 8 2 6.00
Package $9.00
4. Revenue (70,000 × $8)…………………….………………………………
…
V
ariable cost (70,000 × $5)…………………….…………………………
…
Contribution margin……………………………………………………
…
Fixed cost……………………………………………………………………
…
Operating income…………………………………………………………
Yes, operating income is $65,000 higher than when both door handles and
trim kits are sold.
P 7-59
1. Break-Even Units = $300,000/$14* = 21,429**
*$406,000/29,000 = $14
** Rounded
Trim Kits
$8 – $5
$3/$8
V
ariabl
e
Cost =
Door Handles
$9
5
$12 – $9
$3/$12
$ 99,000
Contribution
Margin
$560,000
$3
3
$210,000
111,000
350,000
CHAPTER 7 Cost-Volume-Profit Analysis
P 7-59 (Concluded)
3. Sales………………………………………………………………………
…
$1,218,000
V
ariable cost (0.45 × $1,218,000)……………….…………..………… 548,100
Contribution margin………………………………..……………… $ 669,900
P 7-60
= $647,400/$830,000 = 0.78, or 78%
= ($830,000 – $647,400)/$830,000
= 0.22, or 22%
3. Margin of Safety = Sales – Break-Even Sales
= $830,000 – $500,000 = $330,000
(Sales – Variable Costs)
Sales
Variable Costs
Sales
1. =
=Contribution Margin Ratio
Variable Cost Ratio
CHAPTER 7 Cost-Volume-Profit Analysis
P 7-61
1. Income = Revenue – Variable Cost – Fixed Cost
$0 = 2,400P – ($42 × 2,400) – $67,200
$0 = 2,400P – $100,800 – $67,200
$168,000 = 2,400P
P = $70
2. $314,400/($6.50 – Unit Variable Cost) = 131,000
P 7-62
1. Contribution Margin per Unit = $5.60 – $4.20*
= $1.40
*Variable cost per unit:
$0.70 + $0.35 + $1.85 + $0.34 + $0.76 + $0.20 = $4.20
Contribution Margin Ratio = $1.40/$5.60 = 0.25
3. Sales ($5.60 × 35,000)…….…………………………..…………………
…
$196,000
V
ariable cost ($4.20 × 35,000)………………………………………..…
…
147,000
Contribution margin………………….……………………………….
…
$ 49,000
Fixed cost…………………………………………………….……………
…
44,800
Operating income………………………………………….…………
…
$ 4,200
4. Margin of Safety = $196,000 – $179,200 = $16,800
CHAPTER 7 Cost-Volume-Profit Analysis
P 7-63
1. Duncan: $75,000/$25,000 = 3
Macduff: $225,000/$25,000 = 9
2.
Contribution margin ratio = $75,000/$375,000 = 0.20
Break-even sales = $50,000/0.20
Break-even sales = $250,000
3. Duncan: 3 × 30% = 90%
Macduff: 9 × 30% = 270%
The percentage increase in profits for Macduff is much higher than Duncan’s
increase because Macduff has a higher degree of operating leverage (i.e., it
has a larger amount of fixed costs in proportion to variable cost as compared
Duncan
Macduff
CHAPTER 7 Cost-Volume-Profit Analysis
2. Fixed costs:
May of current yea
r
= $680 + $4,300 + $5,600 + $9,750 = $20,330
May of prior yea
r
= $500 + $4,300 + $5,000 + $4,000 = $13,800
Break-even point in sales dollars:
May of current yea
r
= $20,330/0.5489 = $37,038
May of prior yea
r
= $13,800/0.5612 = $24,590
r
r
4. Clearly, the sharp rise in fixed costs from the prior year to the current year ha
s
had a strong impact on the break-even point and the margin of safety. Kicker
will need to ensure that tight cost control is exercised since the margin of
safety is much slimmer. Still, the decision to go with the OEM investment
program could pay large dividends in the future. Note that the margin of
safety and break-even point give the company important information on the
potential risk of the venture but do not tell it the upside potential.
r
r
CHAPTER 7 Cost-Volume-Profit Analysis
Case 7-65
1. Let X be a package of 3 Grade I cabinets and 7 Grade II cabinets.
0.30X($3,400) + 0.70X($1,600) =
= 748* packages
2. Contribution Sales Total
Product Price
–
= Margin × Mix = CM
I $3,400 $714 3 $2,142
II 1,600 272 7 1,904
Package $4,046
Direct fixed cost—I
Direct fixed cost—II
Common fixed cost
Total fixed cost
3.
V
ariable Contribution Sales Total
Product Price
–
Cost = Margin × Mix = CM
I $3,400 $2,444 $956 3 $2,868
II 1,600 1,208 392 7 2,744
Package $5,612
[($3,400 × 3) + ($1,600 × 7)] X =
$21,400X =
X = 47* packages remaining
Grade I: 3 × 47 = 141
Grade II: 7 × 47 = 329
*
CASES
$1,600,000 – $600,000
$1,600,000
Variable
Cost
35,000
$225,000
$2,686
1,328
$ 95,000
$1,600,000 – $600,000
95,000
*
*
*
*
CHAPTER 7 Cost-Volume-Profit Analysis
Case 7-65 (Continued)
If the new break-even point is interpreted as a revised break-even point for the
current year, then total fixed cost must be reduced by the contribution margin
already earned (through the first five months) to obtain the units that must be
sold for the last seven months. These units would then be added to those sold
during the first five months:
Contribution Margin Earned = $600,000 – (83* × $2,686) – (195* × $1,328)
= $118,102
4.
V
ariable Sales Total
Product Price
–
Cost = × Mix = CM
I $3,400 $2,686 $714 1 $714
II 1,600 1,328 272 1 272
Package $986
New sales revenue: $1,000,000 × 1.30 = $1,300,000
= $1,300,000
= 260 packages
Thus, 260 units of each cabinet will be sold during the rest of the year.
Effect on profits:
The break-even point (for the current year and the remaining 7 months,
respectively) is computed as follows:
X = Fixed Cost/(Price – Variable Cost)
= $295,000/$986
= 299* packages (or 299 of each cabinet)
X = ($295,000 – $118,102)/$986
= $176,898/$986
= 179* packages (179 of each)
Contribution
Margin
$5,000X
X
CHAPTER 7 Cost-Volume-Profit Analysis
Case 7-66
1. Break-Even Point in Units =
First process: $100,000/($30 – $10) = 5,000
Second process: $200,000/($30 – $6) = 8,333
*Rounded
3. The right to decide which process should be chosen belongs to the divisional
manager. Danna has an ethical obligation to report the correct information to he
r
superior. By altering the sales forecast, Danna unfairly and unethically influenced
the decision-making process. Managers certainly have a moral obligation to
voice her concerns about the impact of automation on the employees’ well-being.
In doing so, perhaps the divisional manager would come to the same conclusion
even though the automated system appears to be more profitable. Second, the
choice to select the manual system may not be the best for the employees anyway.
The divisional manager may possess more information, making the selection of
the automated system the best alternative for all concerned, provided the sales
volume justifies its selection. For example, if the automated system is viable, the
divisional manager may have plans to retrain and relocate the displaced workers
Fixed Cost
Unit Contribution Margin
*