CHAPTER 21 (FIN MAN); CHAPTER 7 (MAN) Variable Costing for Management Analysis
Prob. 21–3B (FIN MAN); Prob. 7–3B (MAN) (Concluded)
b.
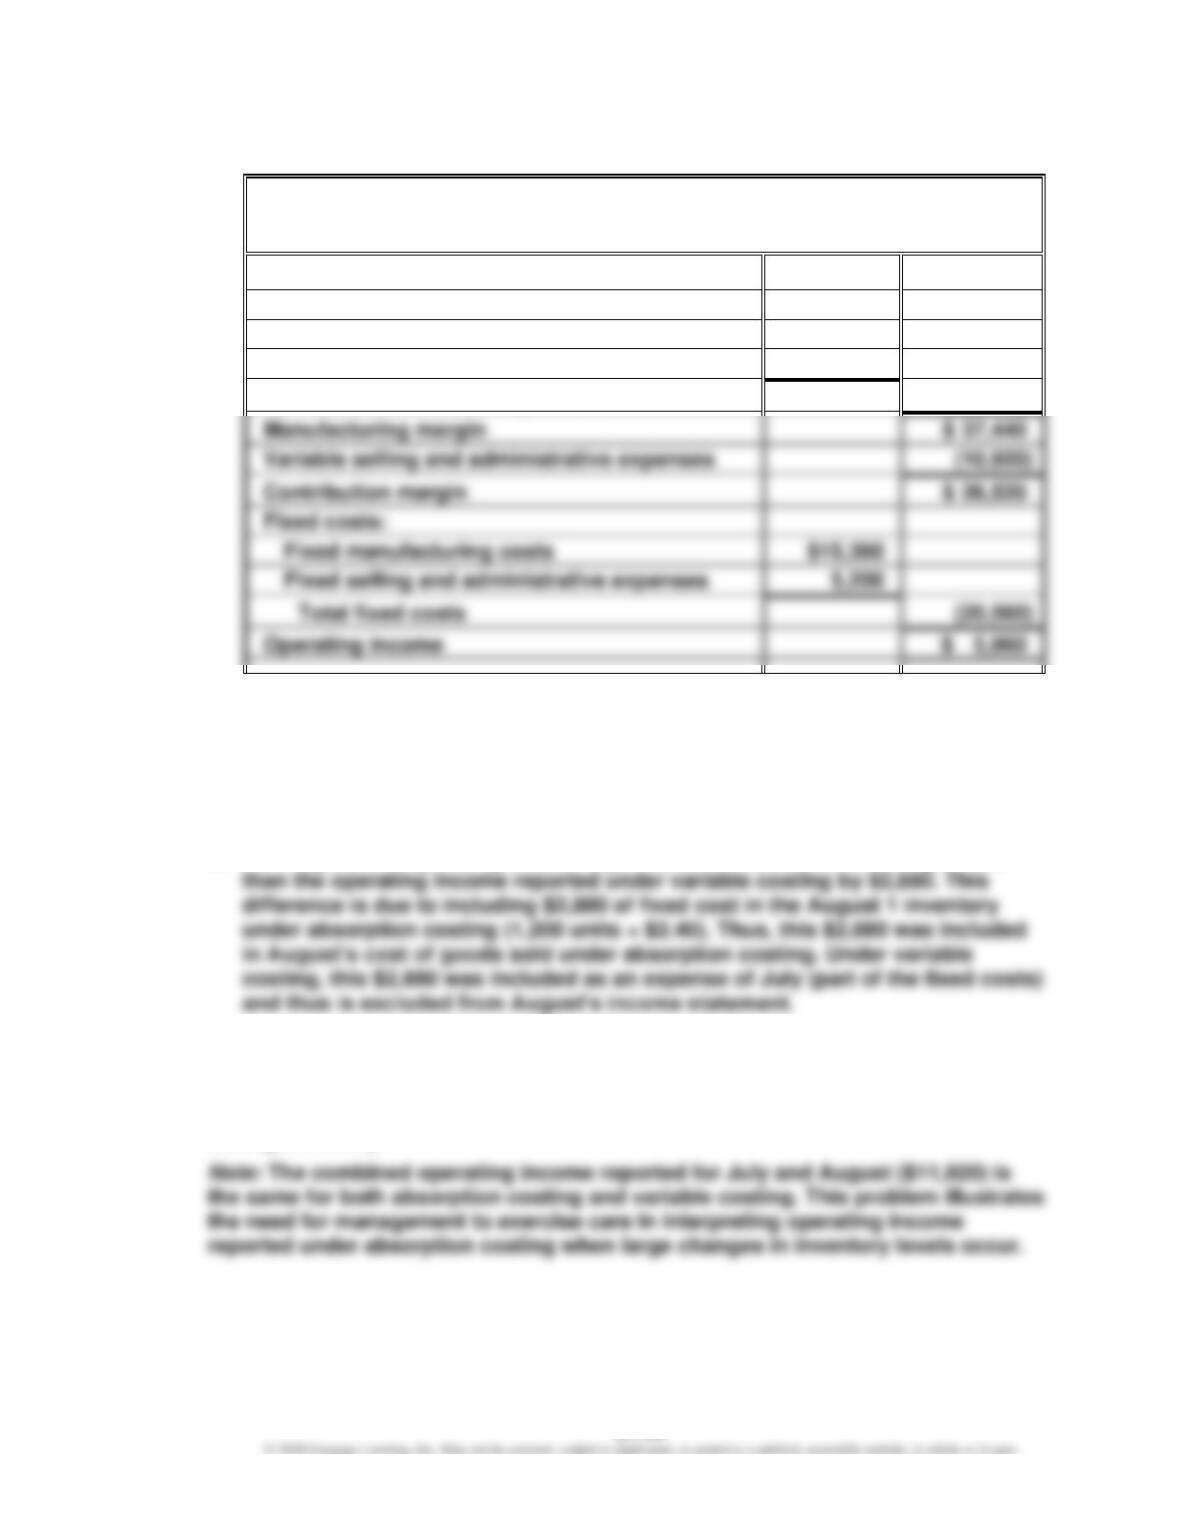
Head Gear Inc.
Variable Costing Income Statement
For the Month Ended August 31
Sales
$104,000
Variable cost of goods sold:
Inventory, August 1 (1,200 units × $12.80)
$15,360
Variable cost of goods manufactured
51,200
Total variable cost of goods sold
(66,560)
Manufacturing margin
Variable selling and administrative expenses
(10,920)
Contribution margin
Fixed manufacturing costs
Fixed selling and administrative expenses
Total fixed costs
(20,560)
3. a. For July, the operating income reported under absorption costing exceeds
the operating income reported under variable costing by $2,880. This
difference is due to including $2,880 of fixed cost in inventory under
absorption costing [1,200 units × $2.40 ($15,360 ÷ 6,400)]. The $2,880 was
thus deferred to August under absorption costing, while it was included as an
expense of July (part of fixed costs) under variable costing.
b. For August, the operating income reported under absorption costing is less
4. Head Gear Inc. was equally profitable in July and in August under the variable
costing concept. Sales and the variable cost per unit were the same for both July
and August. The difference in income reported under the absorption costing
concept is due to allocating $2,880 of fixed manufacturing cost to the July 31
ending inventory.
CHAPTER 21 (FIN MAN); CHAPTER 7 (MAN) Variable Costing for Management Analysis
Prob. 21–4B (FIN MAN); Prob. 7–4B (MAN)
1.
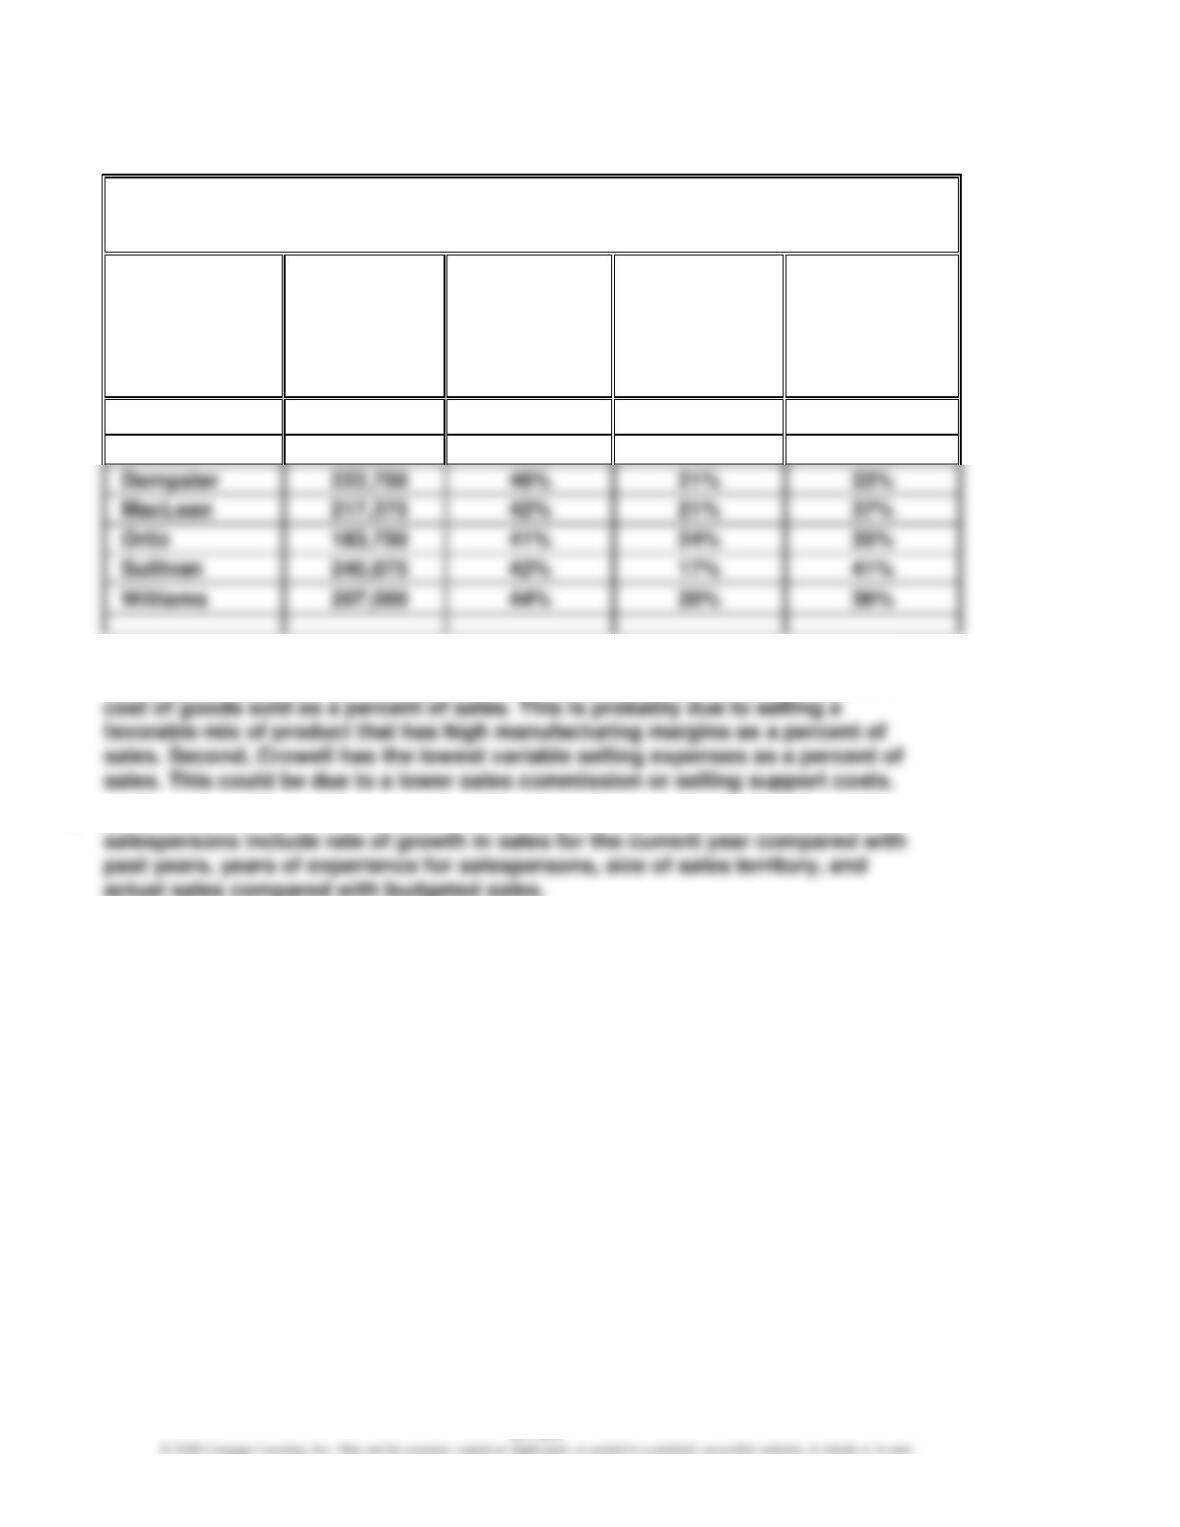
Pachec Inc.
Salespersons’ Analysis
For the Year Ended June 30
Variable
Variable Cost
Selling
of Goods Sold
Expenses
Contribution
Contribution
as a Percent
as a Percent
Margin
Salesperson
Margin
of Sales
of Sales
Ratio
Asarenka
$157,500
45%
19%
36%
Crowell
250,800
40%
16%
44%
Dempster
222,750
46%
21%
33%
2. Crowell has the highest contribution margin and contribution margin ratio for
the year. This is because of two factors. First, Crowell had the smallest variable
3. Other factors that should be considered in evaluating the performance of
CHAPTER 21 (FIN MAN); CHAPTER 7 (MAN) Variable Costing for Management Analysis
Prob. 21–5B (FIN MAN); Prob. 7–5B (MAN)
1.
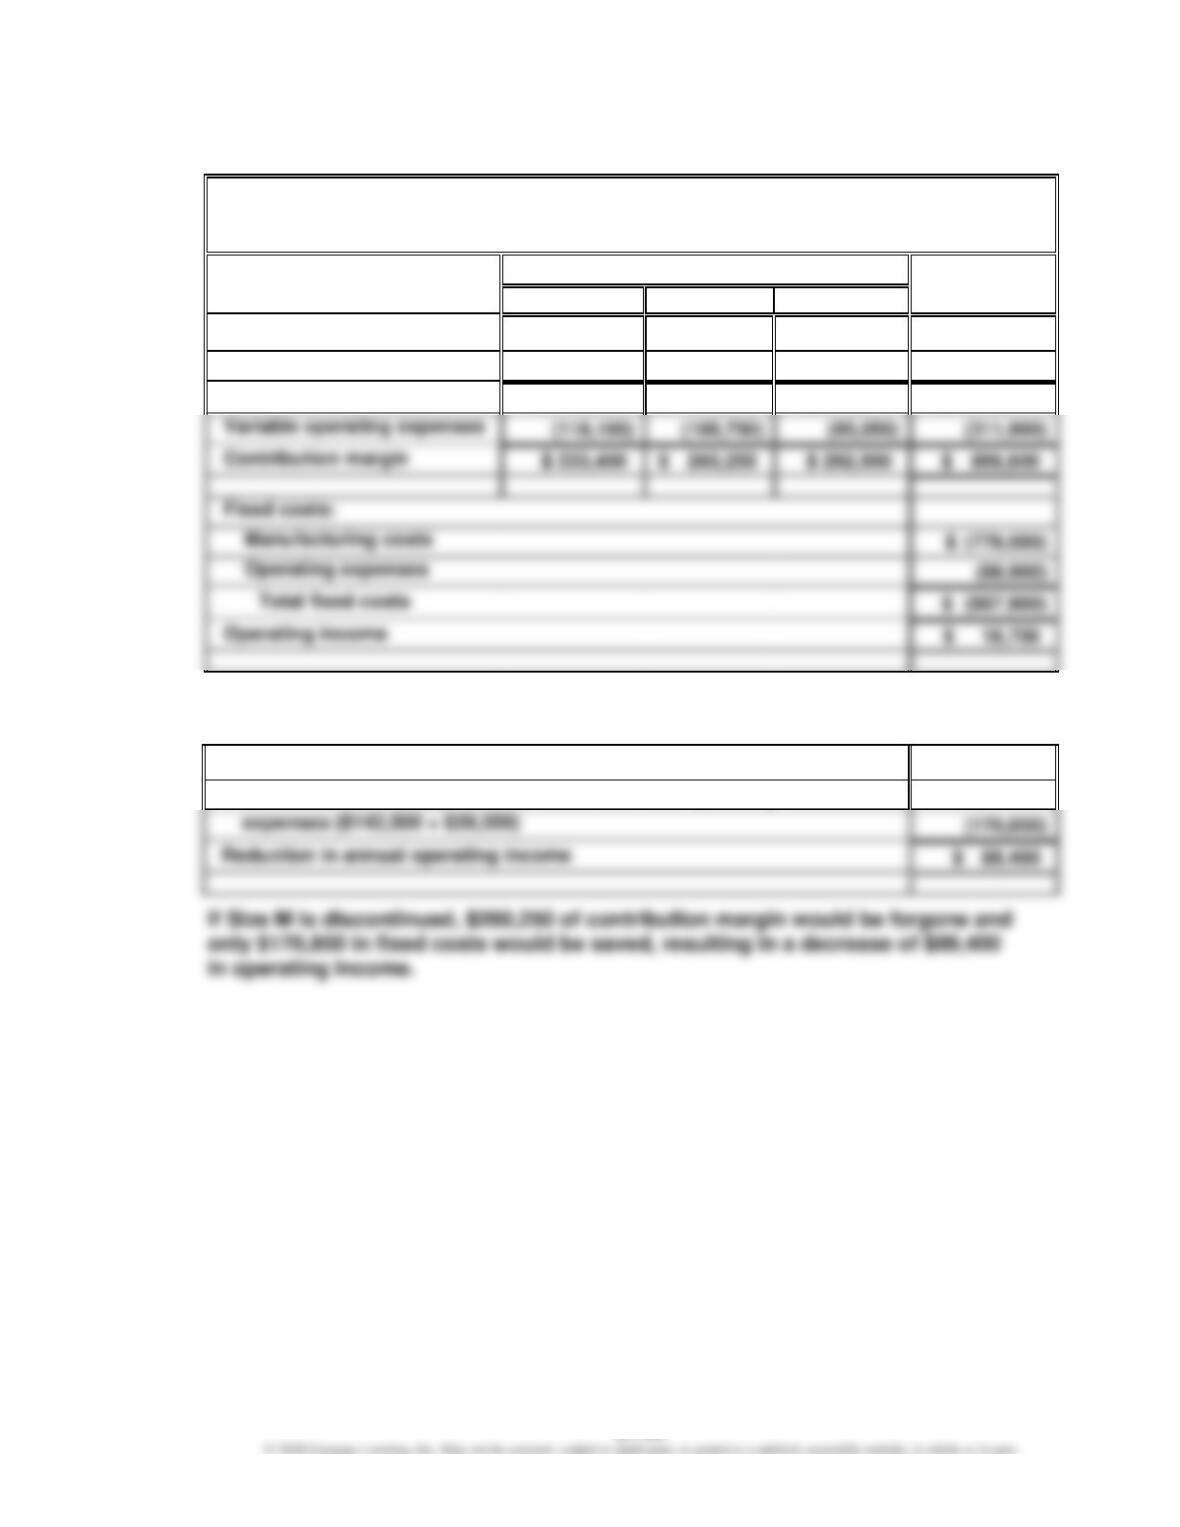
Kimbrell, Inc.
Variable Costing Income Statement
For the Year Ended December 31, 20Y8
Size
Total
S
M
L
Sales
$ 990,000
$1,087,500
$ 945,000
$ 3,022,500
Variable cost of goods sold
(538,500)
(718,500)
(567,000)
(1,824,000)
Manufacturing margin
$ 451,500
$ 369,000
$ 378,000
$ 1,198,500
Variable operating expenses
Fixed costs:
2. Annual operating income would be reduced below its present level by
$89,400 if Size M were to be discontinued (Proposal 2), as indicated below.
Contribution margin for Size M
$ 260,250
Less reduction in fixed production costs and fixed operating
CHAPTER 21 (FIN MAN); CHAPTER 7 (MAN) Variable Costing for Management Analysis
Prob. 21–5B (FIN MAN); Prob. 7–5B (MAN) (Concluded)
3.
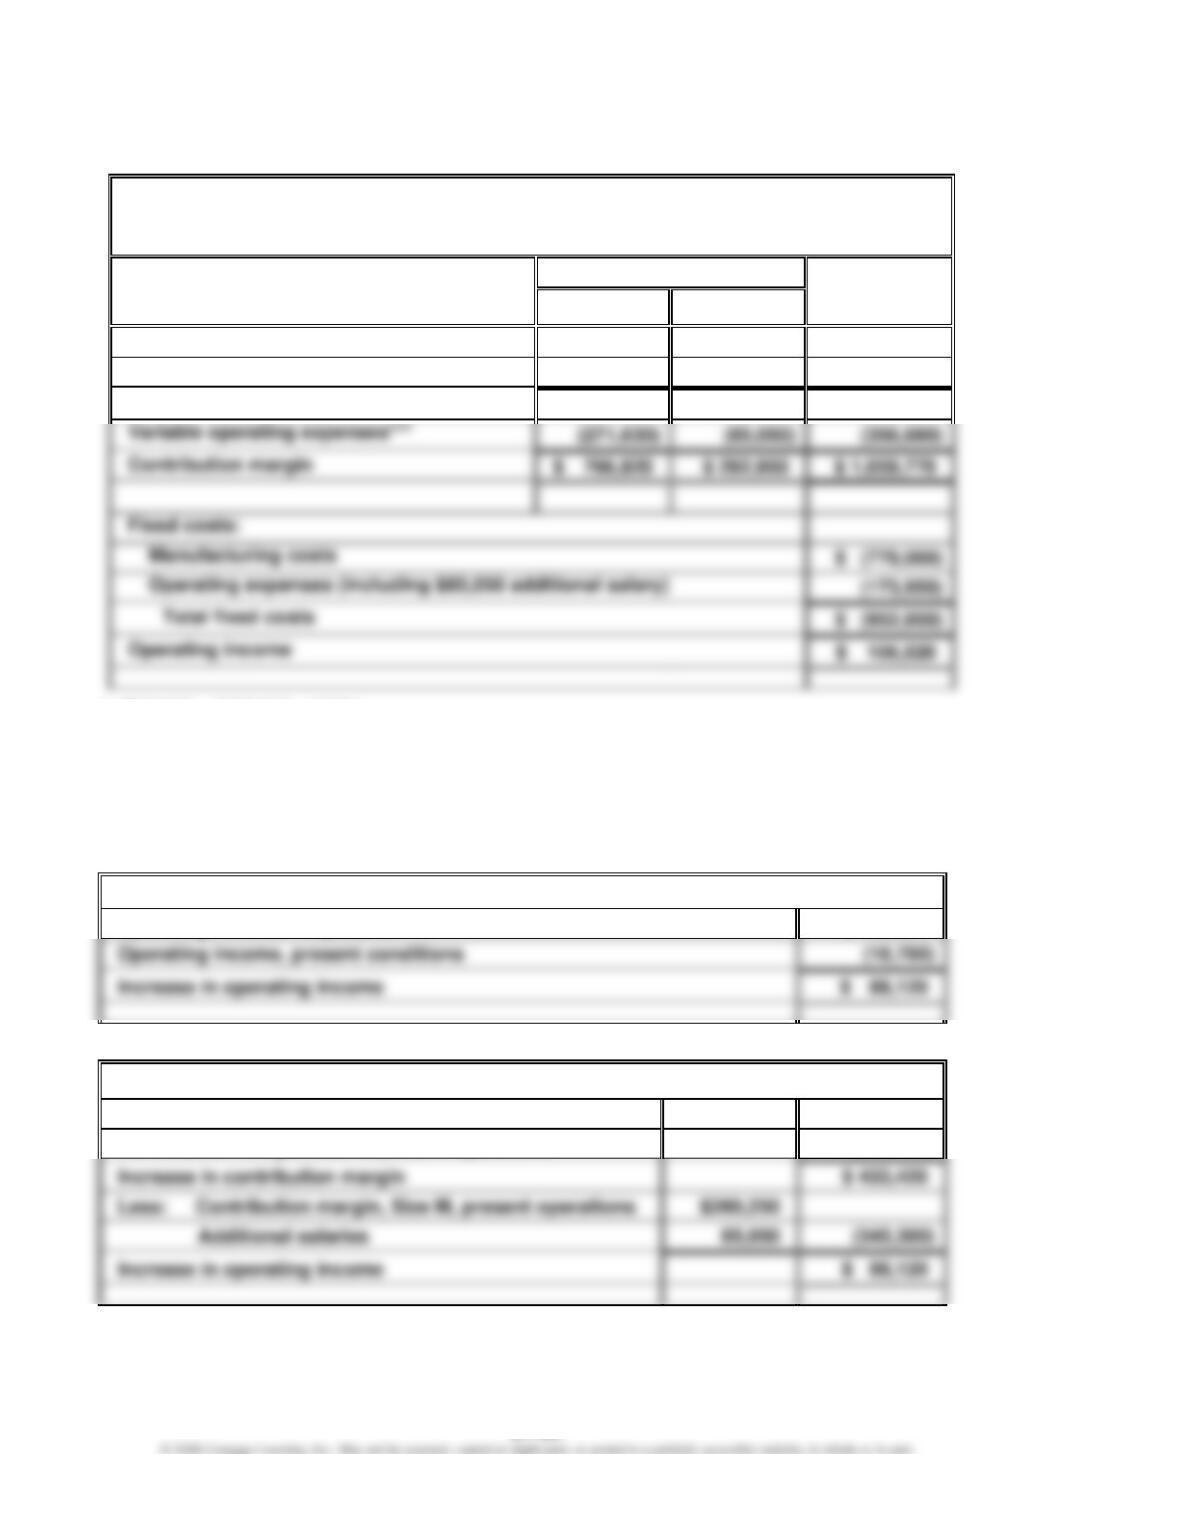
Kimbrell Inc.
Variable Costing Income Statement
For the Year Ended December 31, 20Y8
Size
Total
S
L
Sales*
$ 2,277,000
$ 945,000
$ 3,222,000
Variable cost of goods sold**
(1,238,550)
(567,000)
(1,805,550)
Manufacturing margin
$ 1,038,450
$ 378,000
$ 1,416,450
(173,950)
*
**
***
$990,000 + ($990,000 × 130%)
$538,500 + ($538,500 × 130%)
$118,100 + ($118,100 × 130%)
4. $88,120. A comparison of the amount of operating income under present conditions,
as indicated in (1), and under Proposal 3, as indicated in (3), suggests an increase
of $88,120 if Proposal 3 is accepted, as illustrated below.
Operating income, Proposal 3
$ 106,820
Alternatively, the $88,120 increase can be determined as follows:
Contribution margin, Size S, Proposal 3
$ 766,820
Contribution margin, Size S, present operations
(333,400)
Less: Contribution margin, Size M, present operations
CHAPTER 21 (FIN MAN); CHAPTER 7 (MAN) Variable Costing for Management Analysis
MAKE A DECISION
MAD 21–1 (FIN MAN); MAD 7–1 (MAN)
a.
Revenues
as a Percent of
Segment
Revenue
Total Revenues
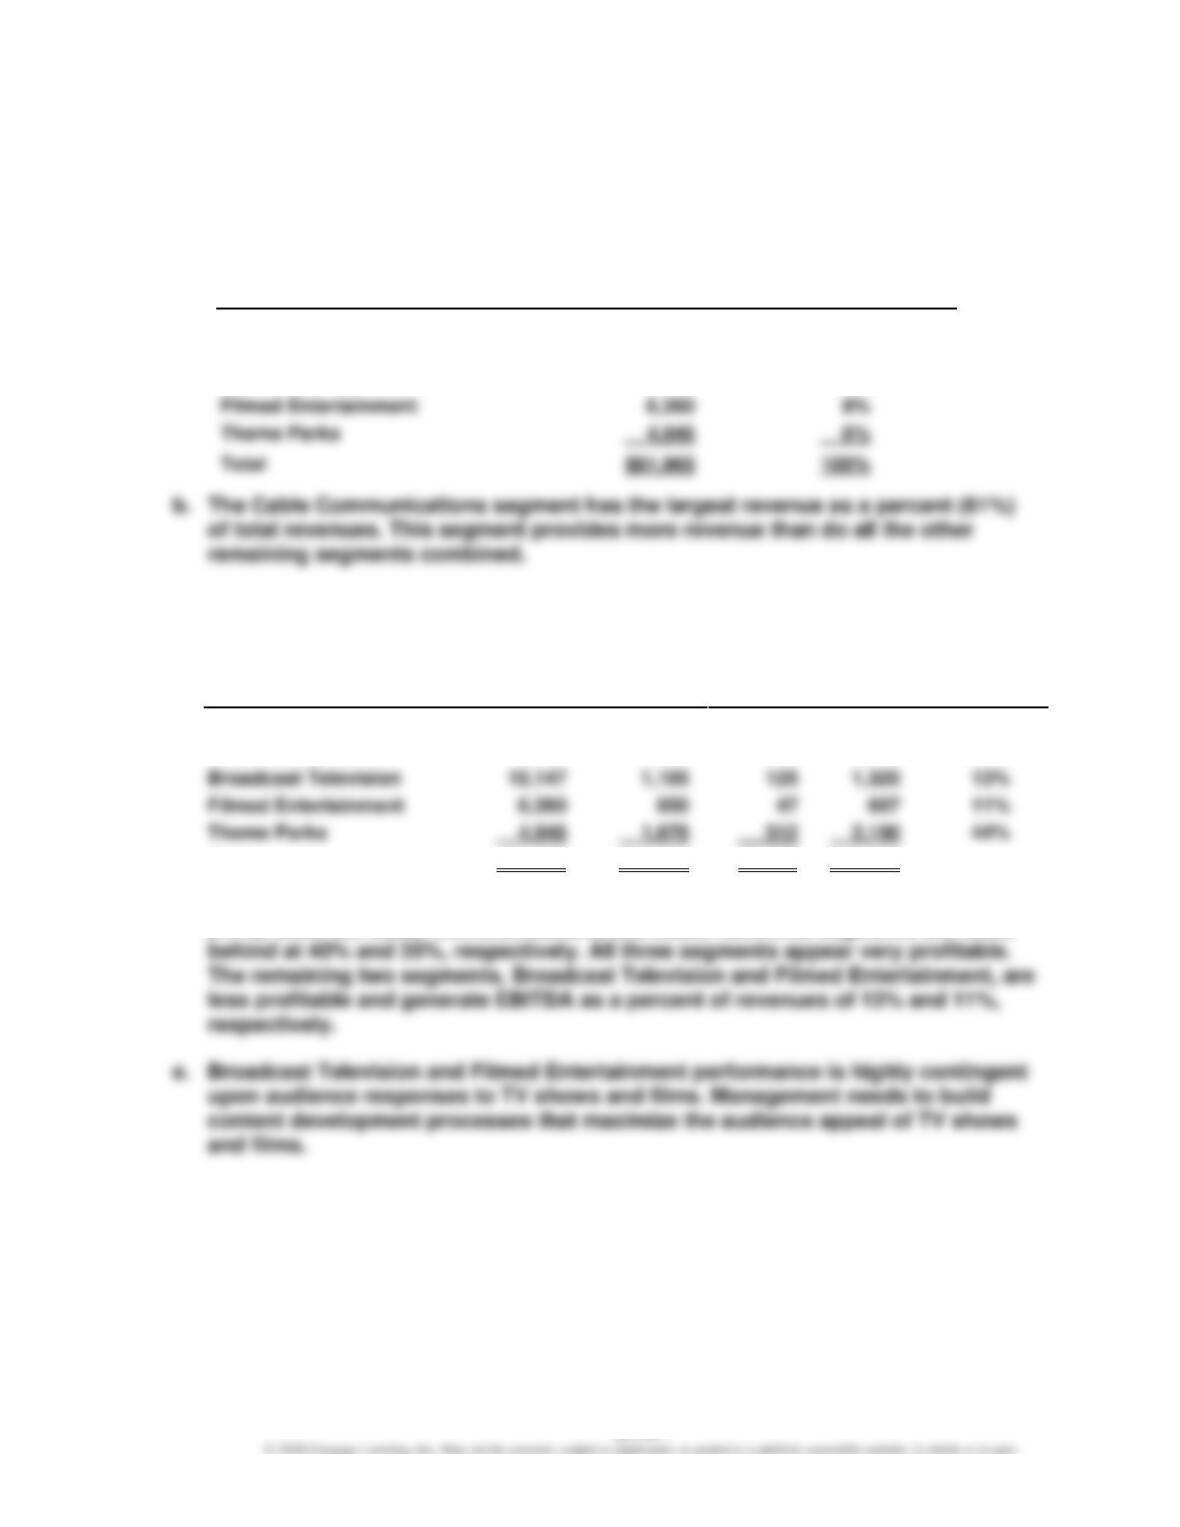
Cable Communications
$50,048
61%
Cable Networks
10,464
13%
Broadcast Television
10,147
12%
Theme Parks
c. 1. and 2.
(2) EBITDA
Operating
Depr. and
(1)
as a Percent
Segment
Revenue
Income
Amort.
EBITDA
of Revenue
Cable Communications
$50,048
$12,439
$7,670
$20,109
40%
Cable Networks
10,464
2,964
745
3,709
35%
Filmed Entertainment
11%
Theme Parks
Total
$81,965
$18,926
$9,099
$28,025
d. The Theme Parks segment provides the greatest EBITDA as a percent of revenue
CHAPTER 21 (FIN MAN); CHAPTER 7 (MAN) Variable Costing for Management Analysis
MAD 21–2 (FIN MAN); MAD 7–2 (MAN)
a.
Percent
Segment
Revenue
of Total
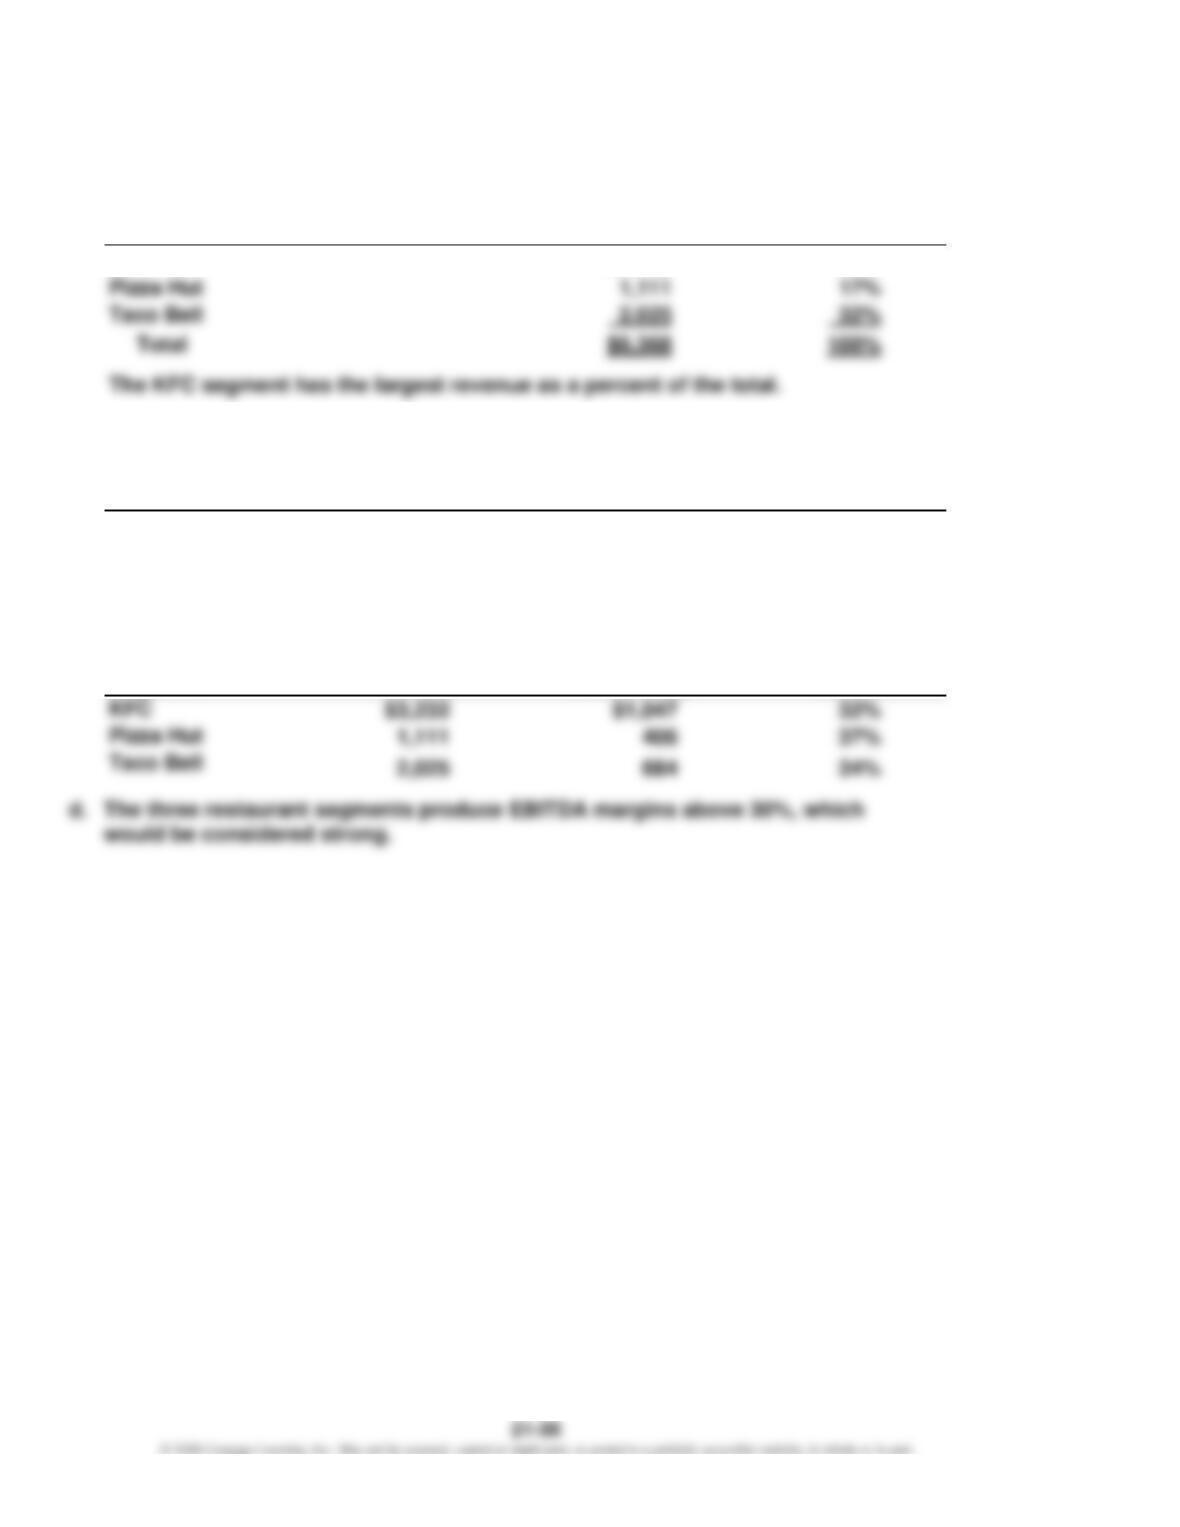
KFC
$3,232
51%
b.
Depreciation
EBITDA (Operating
Operating
and Amortization
Income Plus Depr.
Segment
Income
Expense
and Amort.)
KFC
$874
$173
$1,047
Pizza Hut
370
36
406
Taco Bell
593
91
684
c.
EBITDA (Operating
EBITDA as a
Income Plus Depr.
Percent of
Segment
Sales
and Amort.)
Sales
CHAPTER 21 (FIN MAN); CHAPTER 7 (MAN) Variable Costing for Management Analysis
MAD 21–3 (FIN MAN); MAD 7–3 (MAN)
a.
Year 3
Year 1
Segment
Year 3
Percent
Year 1
Percent
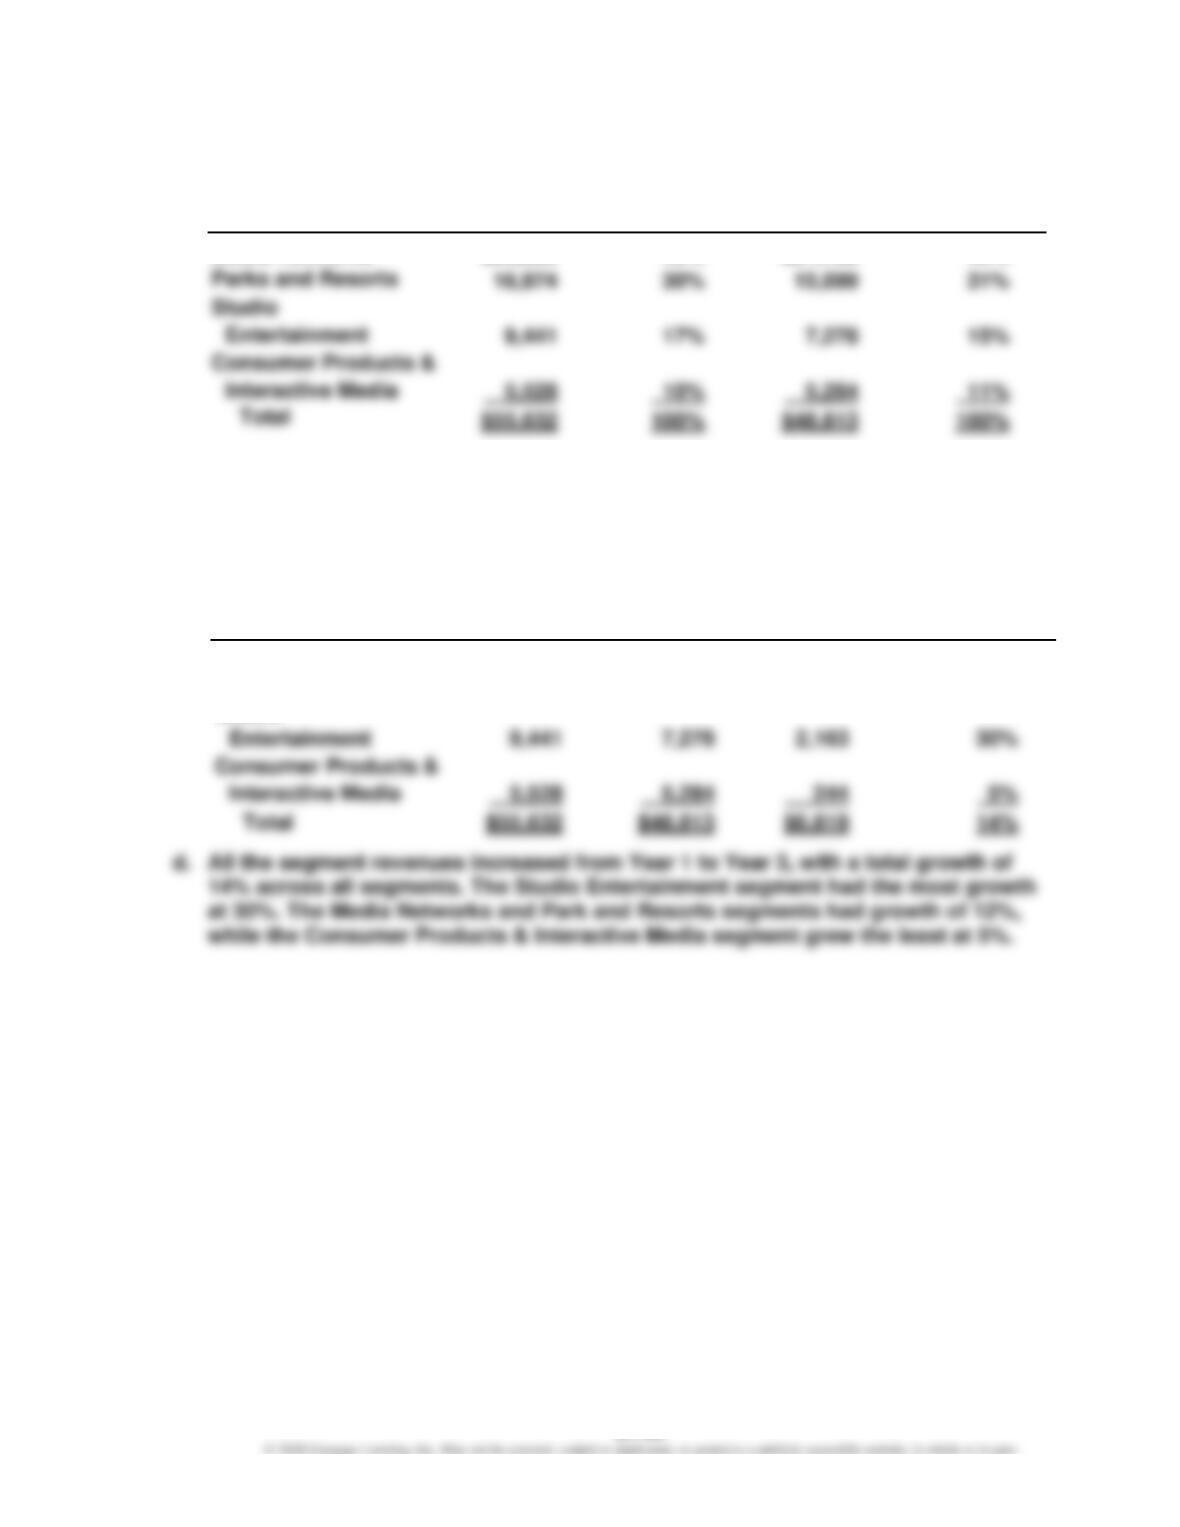
b. The Parks and Resorts and Consumer Products & Interactive Media segments
have declined 1% of total revenues from Year 1 to Year 3. The offsetting gain was
from a two-percentage point increase in Studio Entertainment from Year 1 to Year
3. Thus, there was slight adjustment in the relative segment sales between Year 1
and Year 3.
c.
Amount
Segment
Year 3
Year 1
Change
% Change
Media Networks
$23,689
$21,152
$2,537
12%
Parks and Resorts
16,974
15,099
1,875
12%
Studio
CHAPTER 21 (FIN MAN); CHAPTER 7 (MAN) Variable Costing for Management Analysis
MAD 21–3 (FIN MAN); MAD 7–3 (MAN)
The analysis requires both a vertical analysis of Year 3 sales and a horizontal analysis of
the change in sales from Year 1 to Year 3.
a.
Percent of
Segment
Year 3 Sales
Total Sales
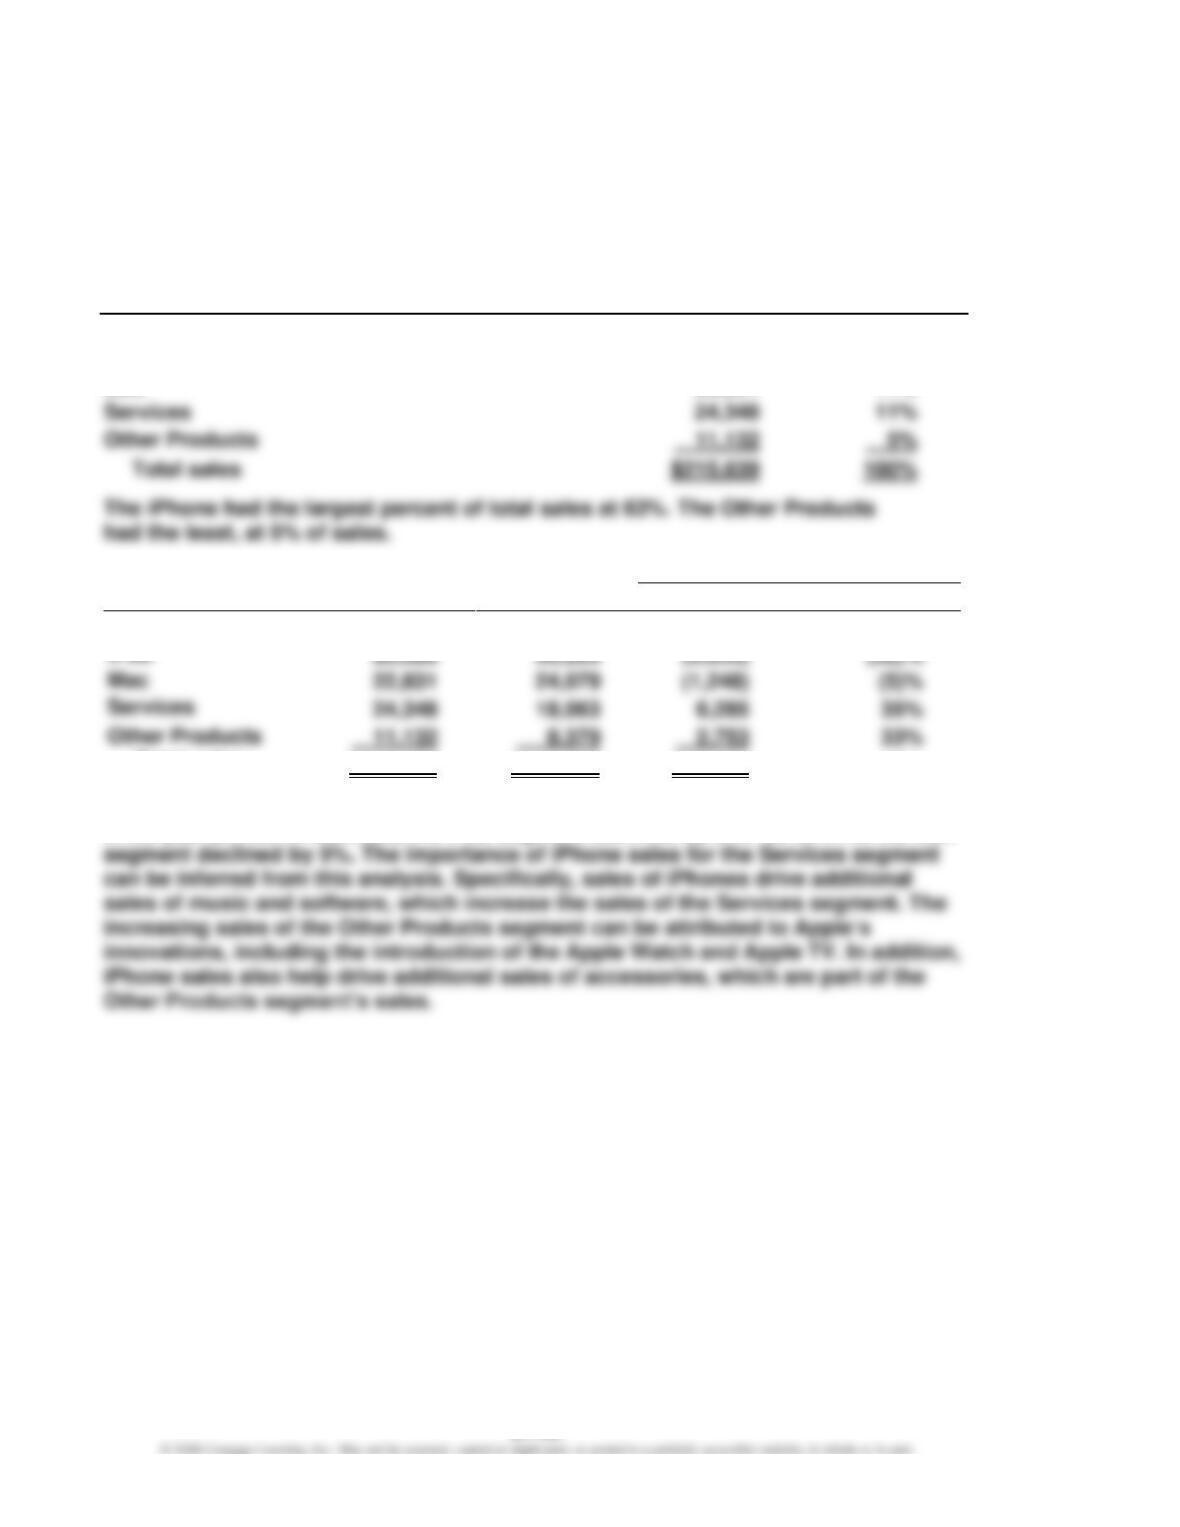
iPhone
$136,700
63%
iPad
20,628
10%
Mac
11%
Services
b.
Increase (Decrease)
Segment
Year 3
Year 1
Amount
Percent
iPhone
$136,700
$101,991
$34,709
34%
Total sales
$215,639
$182,795
$32,844
18%
The iPhone, Services, and Other Products segments grew by over 30% over the
three-year period. In contrast, the iPad segment declined by over 30%, while the Mac
CHAPTER 21 (FIN MAN); CHAPTER 7 (MAN) Variable Costing for Management Analysis
TAKE IT FURTHER
TIF 21–1 (FIN MAN); TIF 7–1 (MAN)
Aston Melon has performed the task requested by the division manager. However,
Aston has not exercised good judgment, to the point of bordering on unethical
behavior. Aston should question the wisdom of manipulating the amount of inventory
TIF 21–2 (FIN MAN); TIF 7–2 (MAN)
a. Absorption costing is required under generally accepted accounting principles.
b. Gordon is incorrect in implying that nothing can be done because of generally
accepted accounting principles (GAAP). GAAP is required for external financial
reporting. However, the income reports used to guide management may be
CHAPTER 21 (FIN MAN); CHAPTER 7 (MAN) Variable Costing for Management Analysis
TIF 21–3 (FIN MAN); TIF 7–3 (MAN)
Memo
To:
Anna Berenson, Vice President of Marketing
From:
Ima Student
Re:
Sales Team: Performance Analysis
The sales portfolios of the two salespeople have the same contribution margin ratio, with
Martin generating a higher total contribution margin. This is not surprising, given that
Martin’s total sales are higher than Dean’s. However, the manufacturing margin ratio
differs significantly between the two salespeople. Dean is selling products with a much
CHAPTER 21 (FIN MAN); CHAPTER 7 (MAN) Variable Costing for Management Analysis
CERTIFIED MANAGEMENT ACCOUNTANT (CMA®)
EXAMINATION QUESTIONS (ADAPTED)
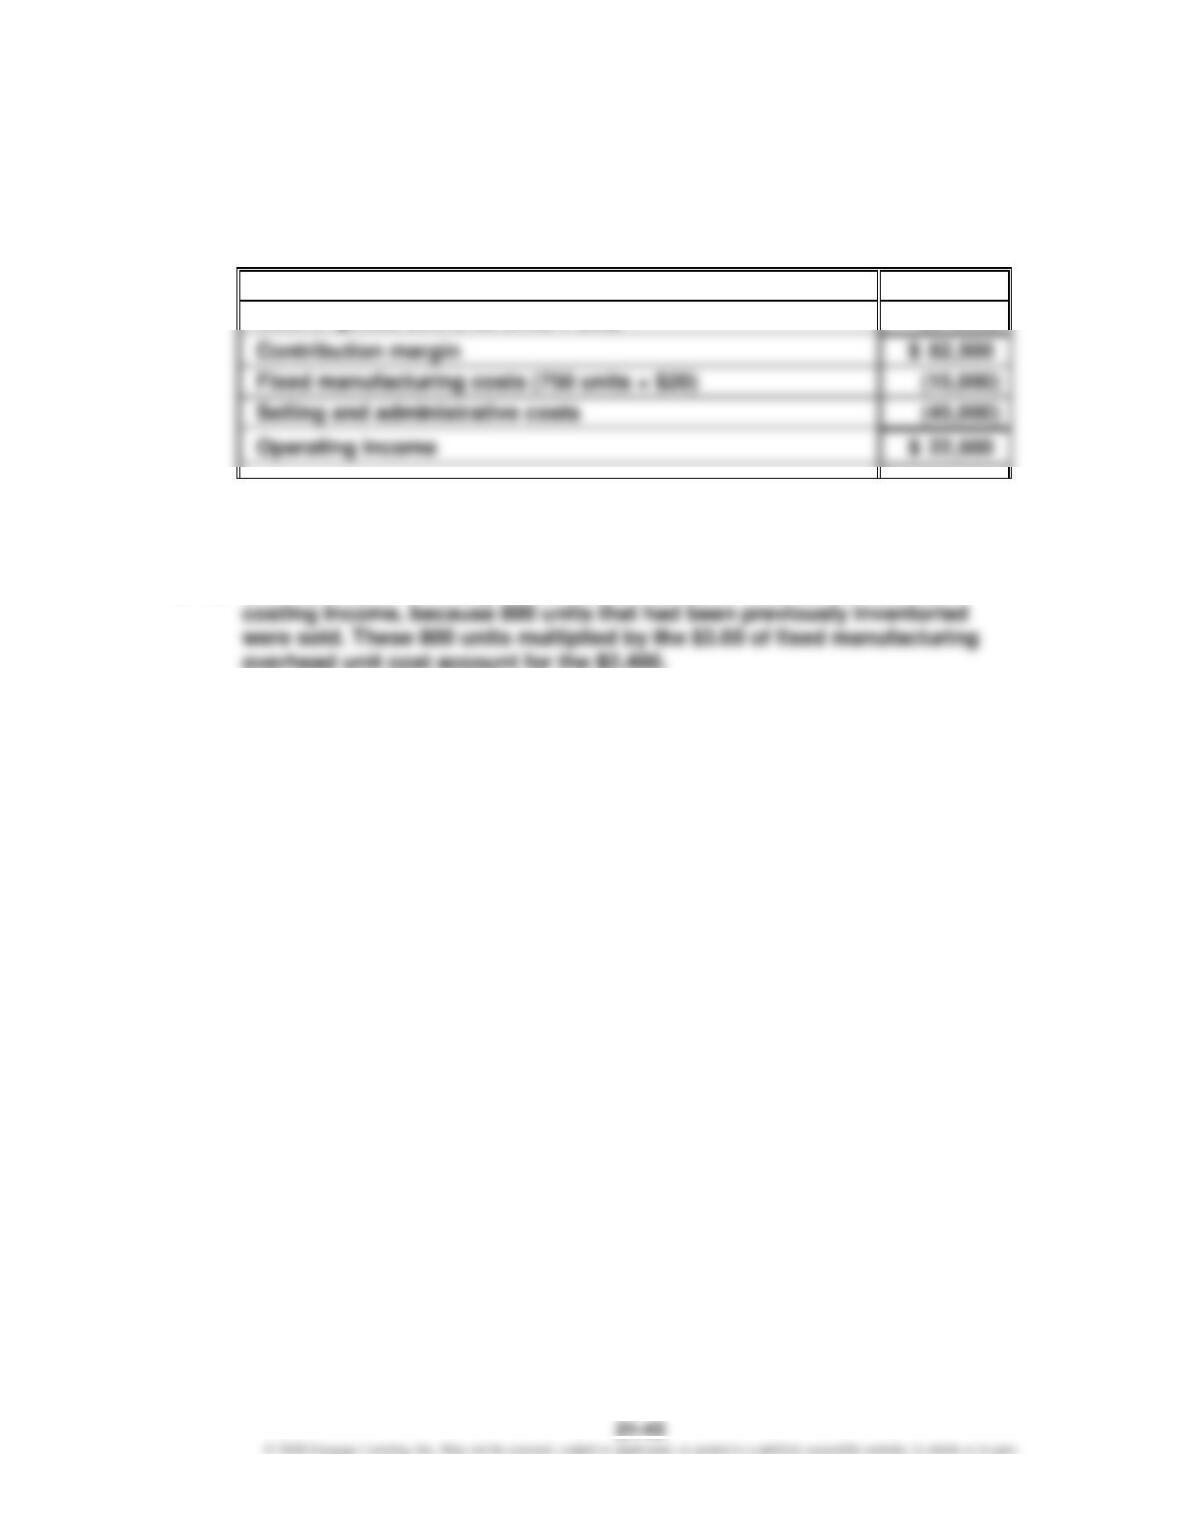
1. b. Merlene’s operating income under variable costing is $22,500, computed
as follows:
Sales (750 units × $200)
$150,000
Cost of goods sold (750 units × $90)
(67,500)
Fixed manufacturing costs (750 units × $20)
(15,000)
2. b. Chassen’s finished goods inventory would total $70,000 as absorption
costing includes both variable ($5.00) and fixed ($2.00) manufacturing costs.
($7.00 × 10,000 units = $70,000).
3. a. Mill’s absorption costing income would be $2,400 lower than variable
4. a. The value of Bethany’s inventory is $5,000,000, which is equal to the
variable manufacturing costs.