CHAPTER 7 Inventories
Prob. 7–2B (Concluded)
$525,250
*
CHAPTER 7 Inventories
Prob. 7–3B
1.
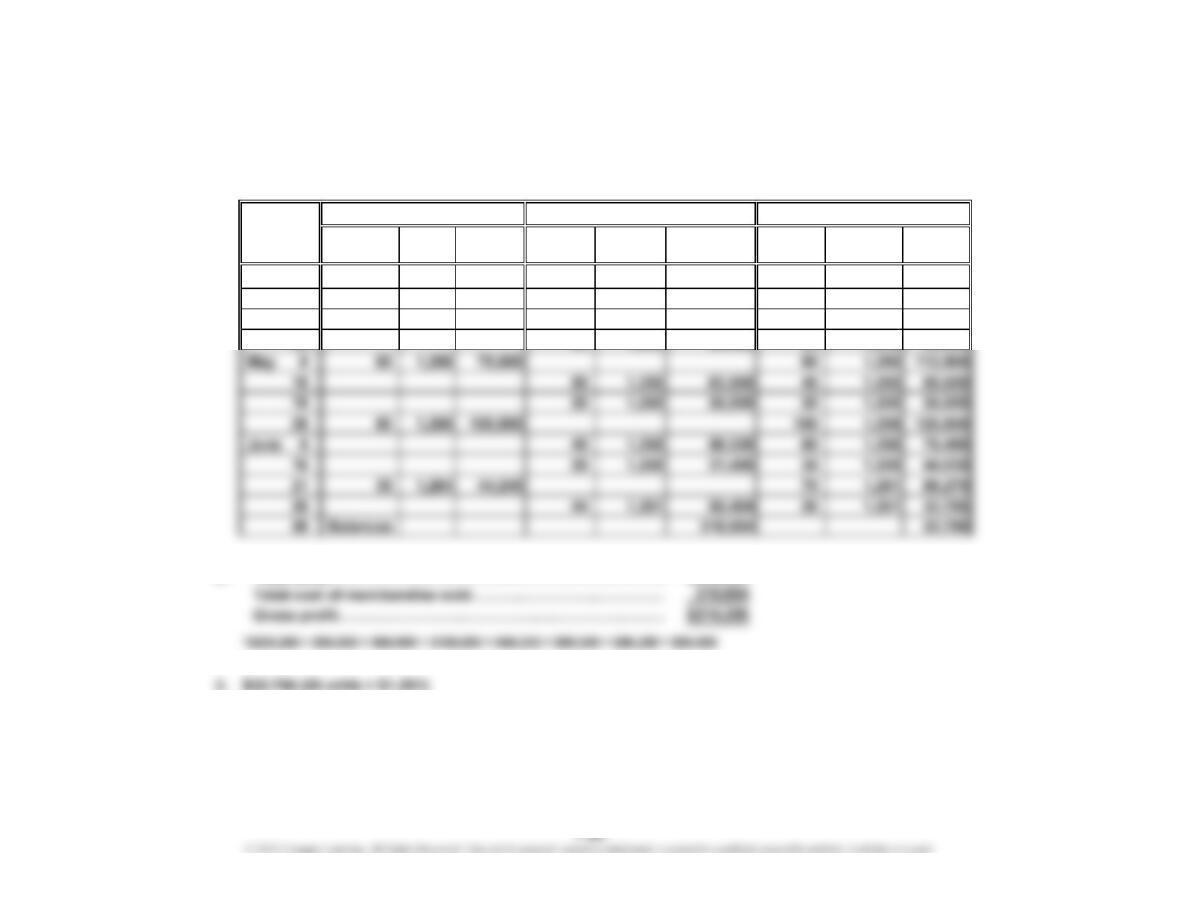
Unit Total Total Total
Quantity Cost Cost Quantity Unit Cost Cost Quantity Unit Cost Cost
Apr. 3 25 1,200 30,000
8 75 1,240 93,000 100 1,230 123,000
11 40 1,230 49,200 60 1,230 73,800
30 30 1,230 36,900 30 1,230 36,900
2. Total sales…………………………………………………………
…
$525,250
Cost of Merchandise Sold Inventory
Date
2016
Purchases
*
CHAPTER 7 Inventories
Prob. 7–4B
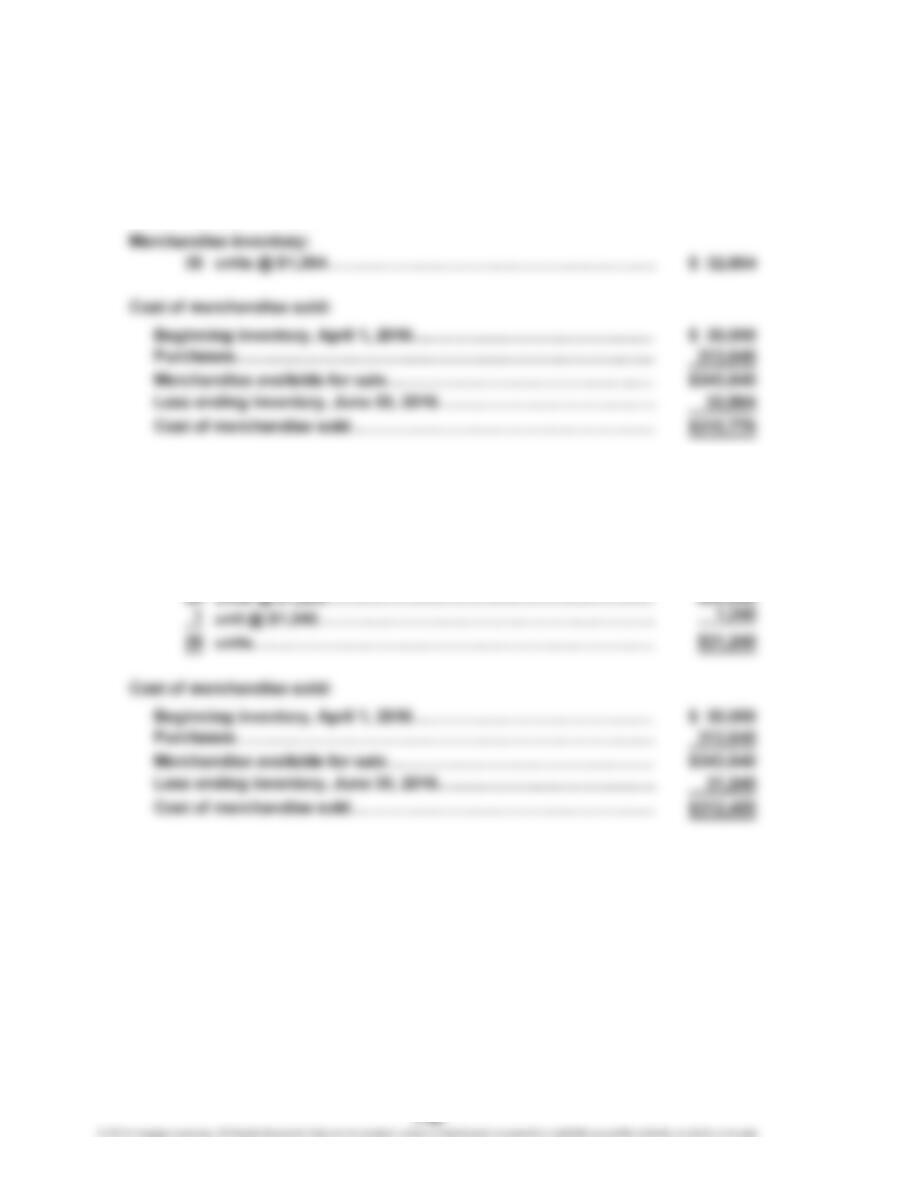
1. First-In, First-Out Method
Merchandise inventory, June 30, 2016……………………………………
$32,864
Cost of merchandise sold………………………………………..…………
310,776
Supporting computations
units @ $1,264………………………………………………………
2. Last-In, First-Out Method
Merchandise inventory, June 30, 2016……………………………………
$31,240
Cost of merchandise sold…………………………………….……………
312,400
Supporting computations
Merchandise inventory:
units @ $1,200………………………………………………………
CHAPTER 7 Inventories
Prob. 7–4B (Continued)
3.
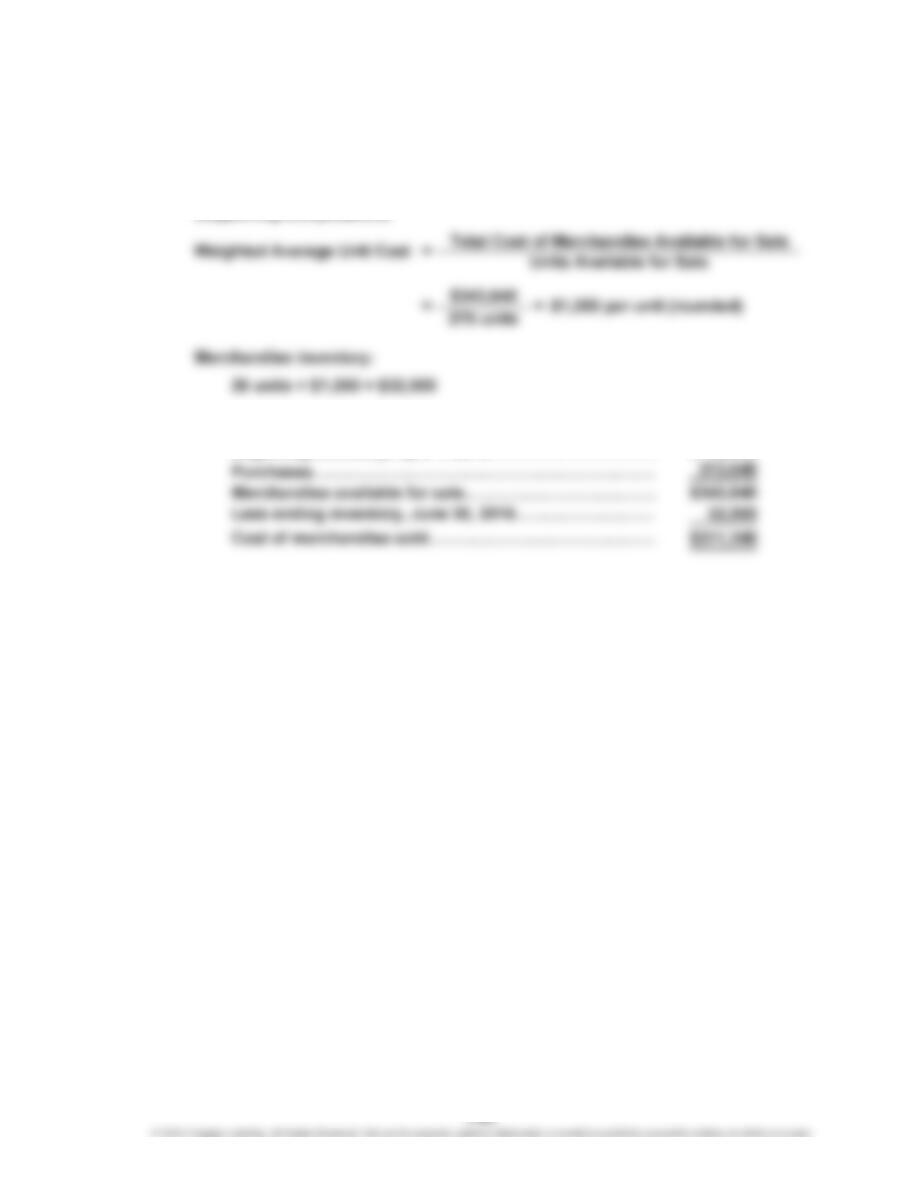
Weighted Average Cost Method
Merchandise inventory, June 30, 2016………………………
$32,500
Cost of merchandise sold………………………………………
311,140
Supporting computations
Cost of merchandise sold:
Beginning inventory, April 1, 2016…………………………. $ 30,000
Merchandise available for sale………………………………
CHAPTER 7 Inventories
Prob. 7–4B (Concluded)
4. Weighted
FIFO LIFO Average
Sales $525,250 $525,250 $525,250
CHAPTER 7 Inventories
Prob. 7–5B
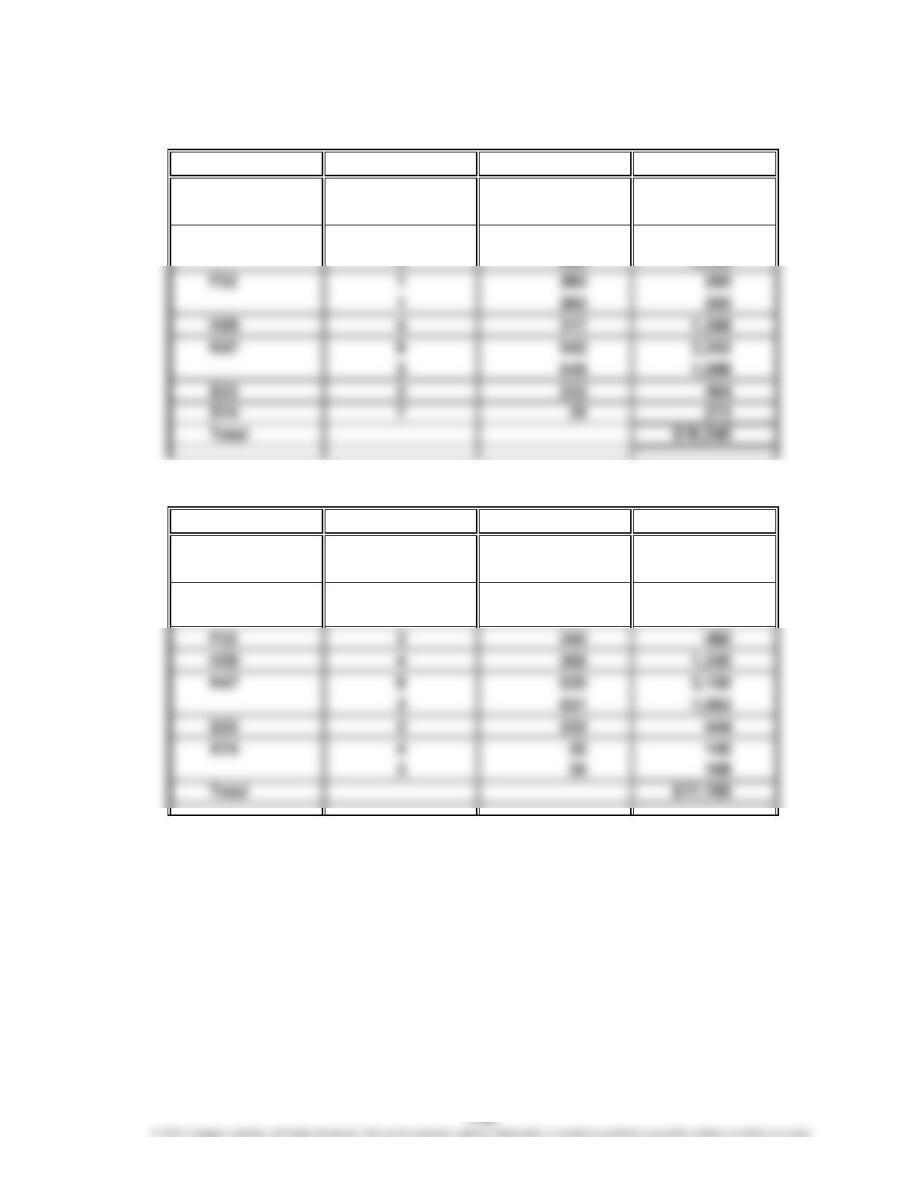
1. First-In, First-Out Method
Model Quantity Unit Cost Total Cost
C55 3$1,070 $3,210
11,060 1,060
D11 6675 4,050
5666 3,330
2. Last-In, First-Out Method
Model Quantity Unit Cost Total Cost
C55 3$1,040 $3,120
11,054 1,054
D11 9639 5,751
2645 1,290
CHAPTER 7 Inventories
Prob. 7–5B (Concluded)
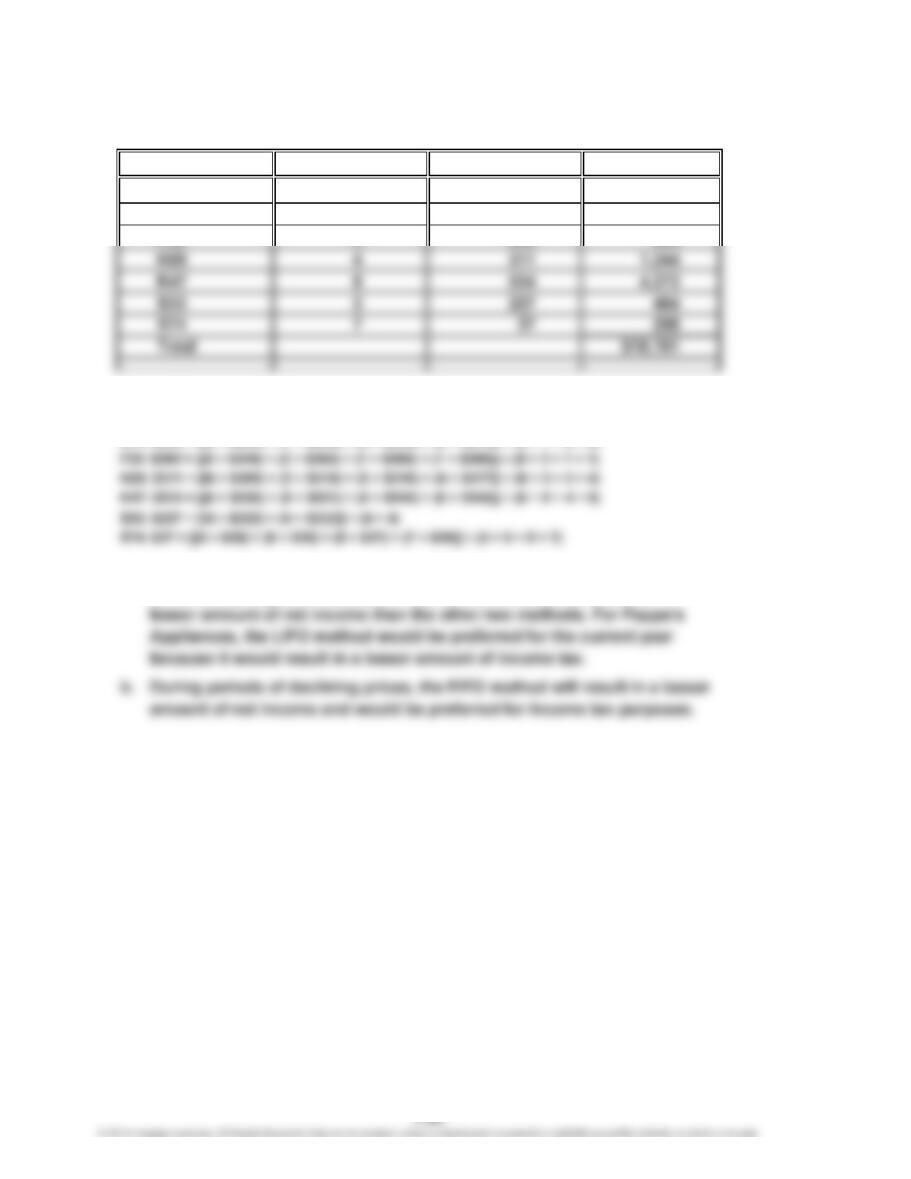
3. Weighted Average Cost Method
Quantity Unit Cost*Total Cost
4$1,056 $4,224
11 654 7,194
2252 504
H29
K47
S33
*Computations of unit costs:
C55: $1,056 = [(3 × $1,040) + (3 × $1,054) + (3 × $1,060) + (3 × $1,070)] ÷ (3 + 3 + 3 + 3)
D11: $654 = [(9 × $639) + (7 × $645) + (6 × $666) + (6 × $675)] ÷ (9 + 7 + 6 + 6)
4. a. During periods of rising prices, the LIFO method will result in a lower cost
of inventory, a greater amount of cost of merchandise sold, and a
Model
C55
D11
F32
CHAPTER 7 Inventories
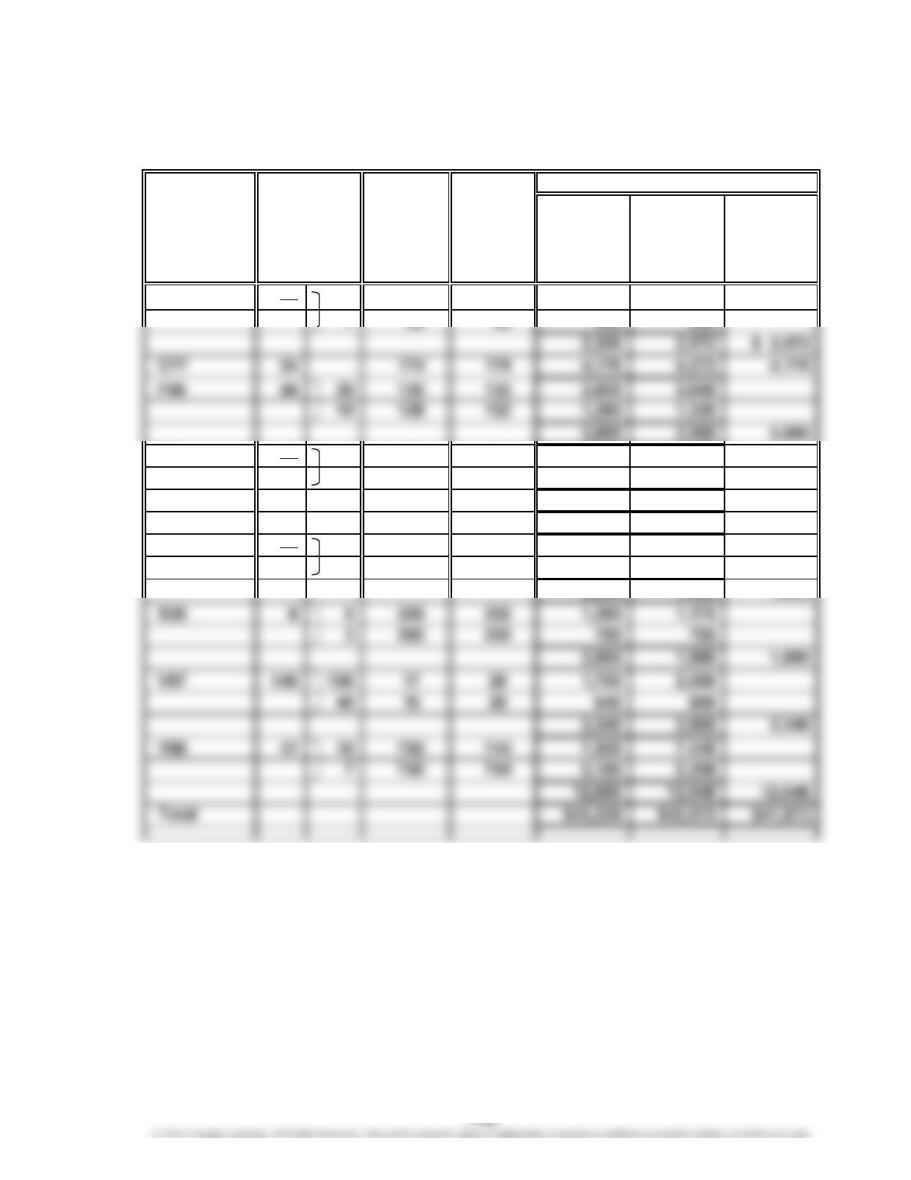
Prob. 7–6B
Market
Value per
Cost Unit (Net
per Realizable
Commodity Unit Value) Cost Market LCM
A54 37 30 $ 60 $ 56 $ 1,800 $ 1,680
H83 21 6 547 545 3,282 3,270
15 540 545 8,100 8,175
11,382 11,445 11,382
K12 375 6 5 2,250 1,875 1,875
Q58 90 75 25 18 1,875 1,350
15 26 18 390 270
2,265 1,620 1,620
Quantity
Inventory Sheet
December 31, 2016
Inventory
Total
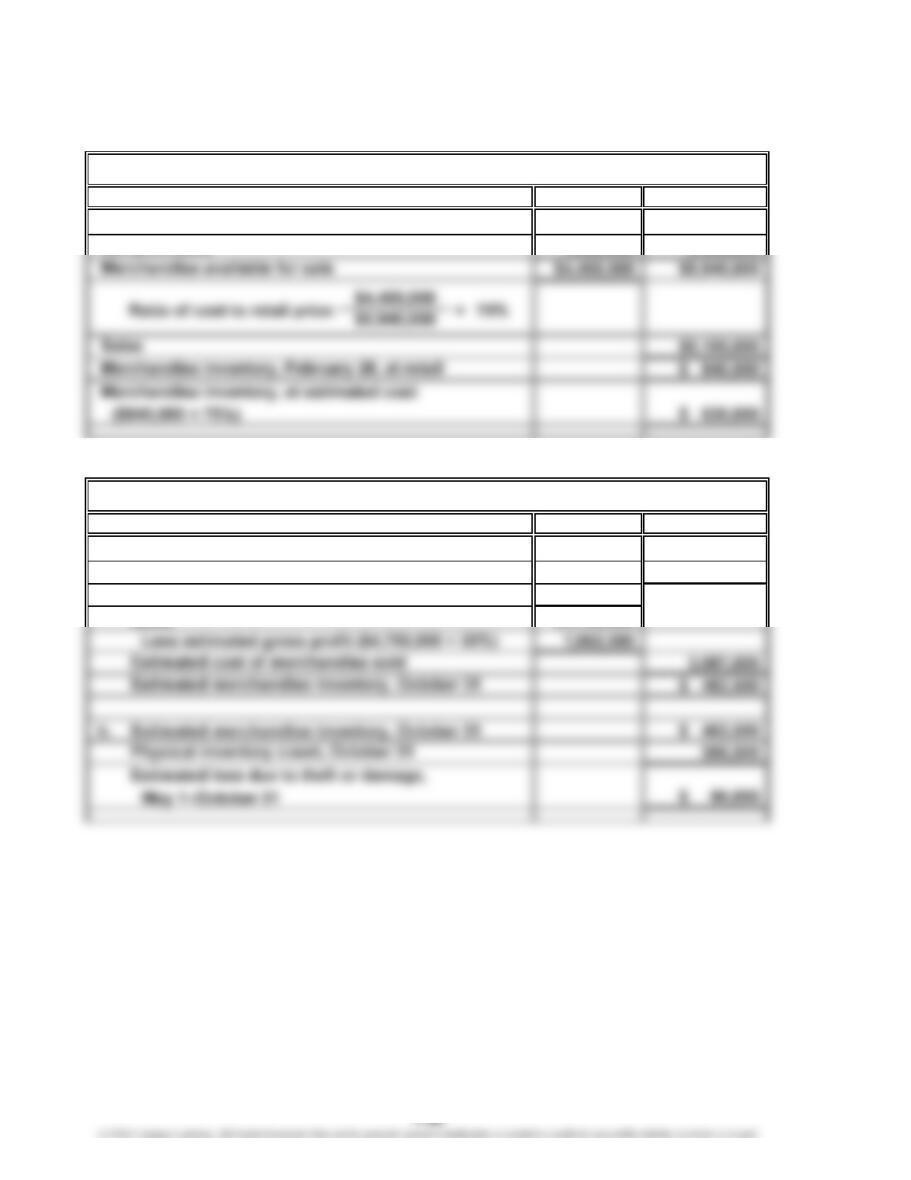
CHAPTER 7 Inventories
Prob. 7–7B
1.
Cost Retail
Merchandise inventory, February 1 $ 400,000 $ 615,000
Net purchases 4,055,000 5,325,000
2.
Cost
a. Merchandise inventory, May 1 $ 400,000
Net purchases 3,150,000
Merchandise available for sale $3,550,000
Sales $4,750,000
JAFFE CO.
CORONADO CO.
CHAPTER 7 Inventories
CP 7–1
Because the title to merchandise shipped FOB shipping point passes to the buyer whe
n
the merchandise is shipped, the shipments made before midnight, October 31, 2016,
CP 7–2
In developing a response to Paula’s concerns, you should probably first emphasize
the practical need for an assumption concerning the flow of cost of goods purchased
and sold. That is, when identical goods are frequently purchased, it may not be
practical to specifically identify each item of inventory. If all the identical goods were
purchased at the same price, it wouldn’t make any difference for financial reporting
purposes which goods we assumed were sold first, second, etc. However, in most
CASES & PROJECTS
CHAPTER 7 Inventories
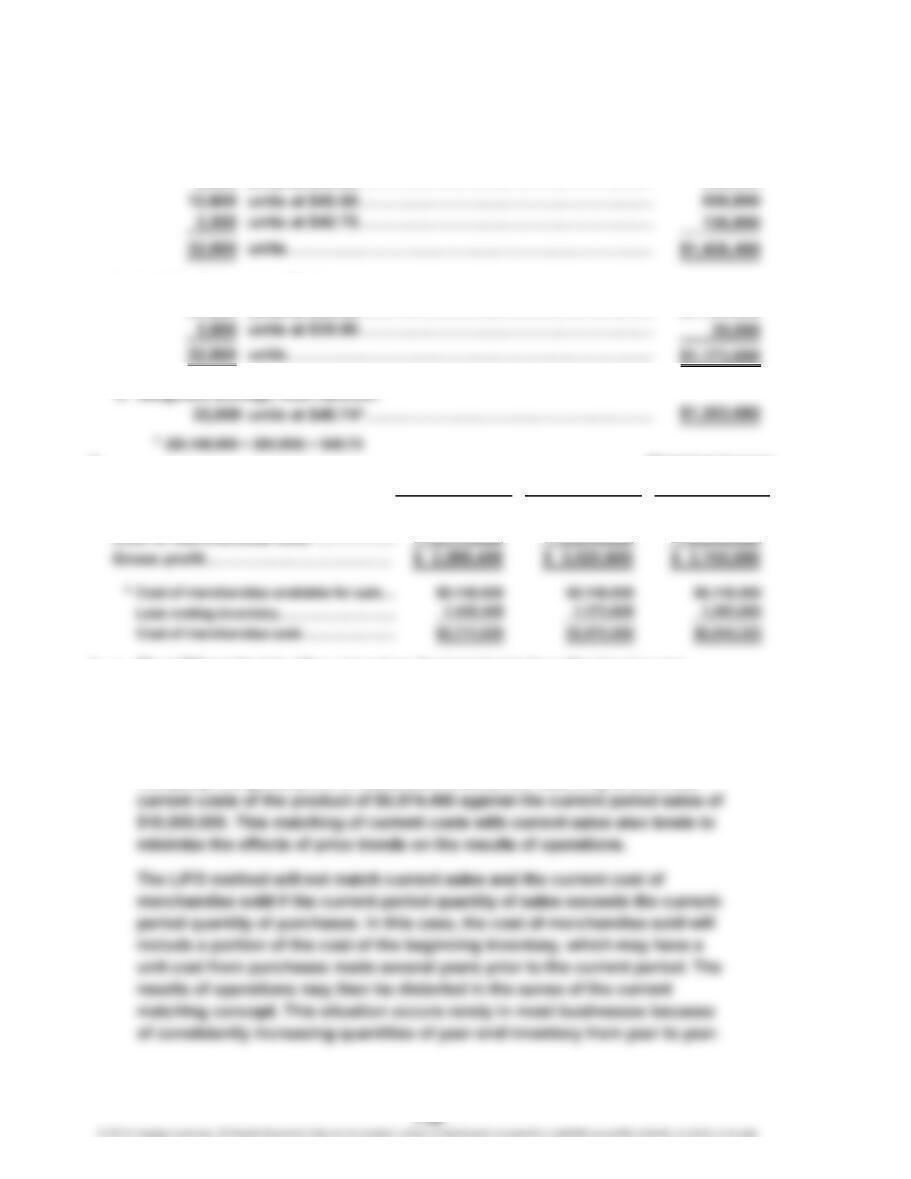
CP 7–3
1. a. First-in, first-out method:
8,000
units at $48.00…………………………………………………
$384,000
8,000
units at $44.85…………………………………………………
358,800
units at $43.50…………………………………………………
b. Last-in, first-out method:
31,000
units at $36.60…………………………………………………
$1,134,600
c. Weighted average cost method:
units at $40.74*………………………………………………
2.
Weighted Average
FIFO LIFO Cost
Sales………………………………………
$10,000,000 $10,000,000 $10,000,000
Cost of merchandise sold*……………
6,711,600 6,974,400 6,844,320
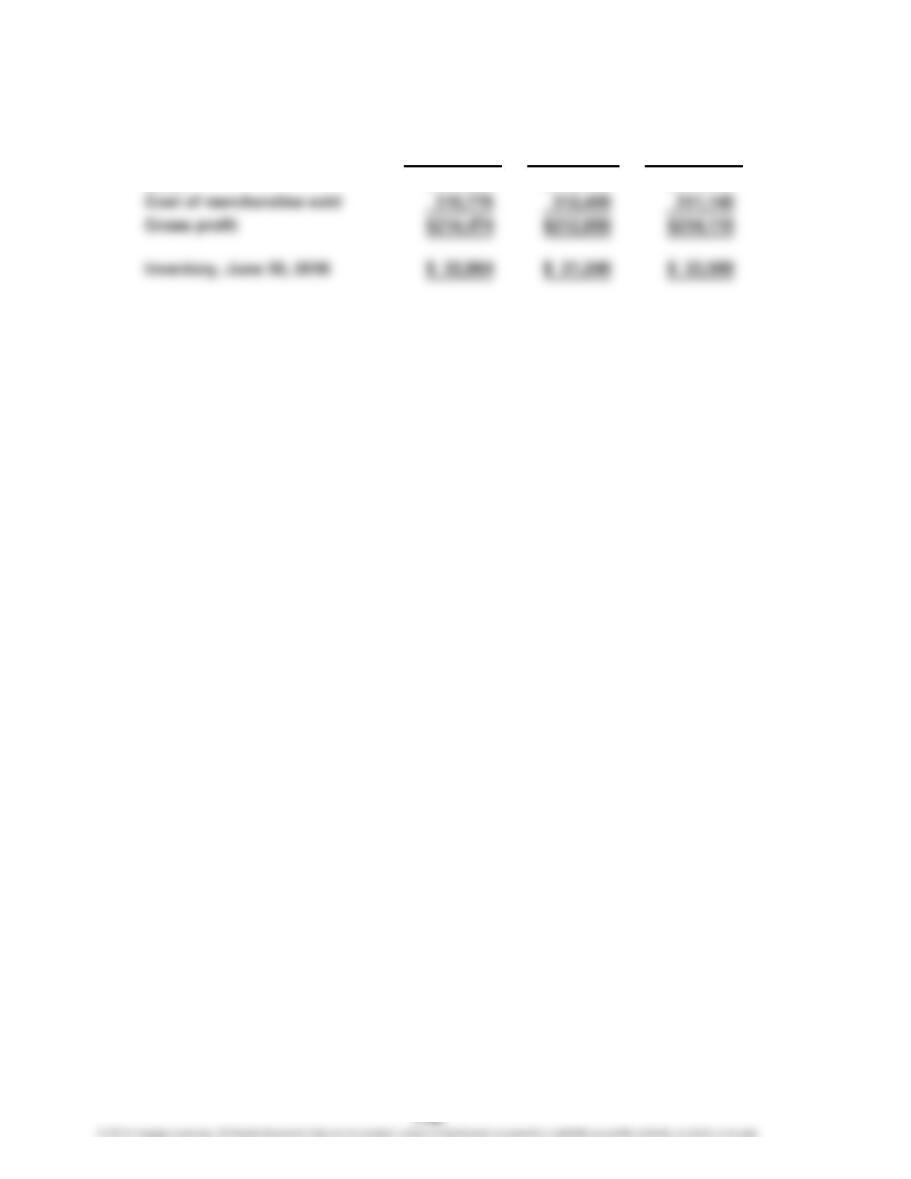
Gross profit………………………………
3. a. The LIFO method is often viewed as the best basis for reflecting income
from operations. This is because the LIFO method matches the most current
cost of merchandise purchases against current sales. The matching of
current costs with current sales results in a gross profit amount that many
consider to best reflect the results of current operations. For Golden Eagle
Company, the gross profit of $3,025,600 reflects the matching of the most
CHAPTER 7 Inventories
CP 7–3 (Continued)
While the LIFO method is often viewed as the best method for matching
revenues and expenses, the FIFO method is often consistent with the
physical movement of merchandise in a business because most businesses
tend to dispose of commodities in the order of their acquisition. To the extent
that this is the case, the FIFO method approximates the results that will be
b. The FIFO method provides the best reflection of the replacement cost of the
ending inventory for the balance sheet. This is because the amount reported
on the balance sheet for merchandise inventory will be assigned costs from
the most recent purchases. For most businesses, these costs will reflect
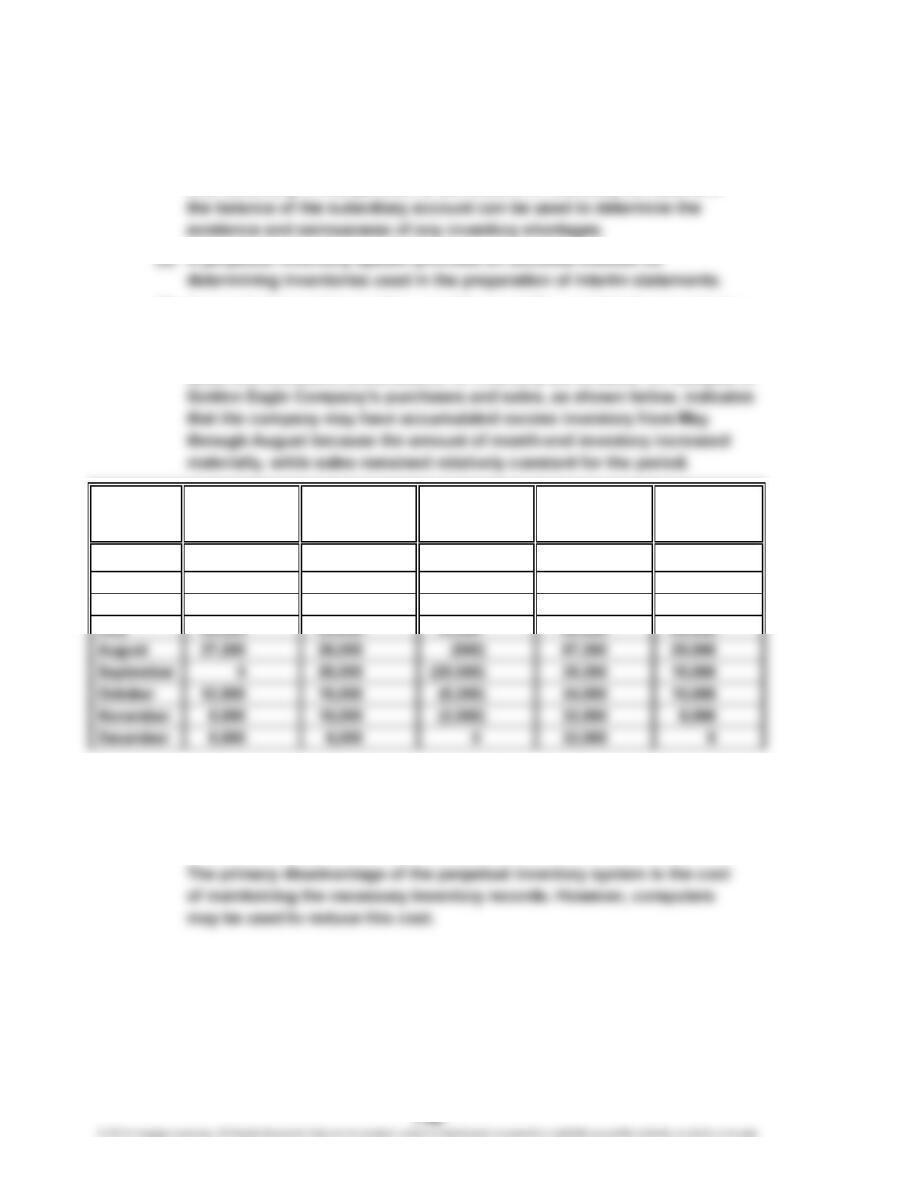
c. During periods of rising prices, such as shown for Golden Eagle Company, the
LIFO method will result in a lesser amount of net income than the other two
CHAPTER 7 Inventories
CP 7–3 (Concluded)
d. The advantages of the perpetual inventory system include the following:
(1) A perpetual inventory system provides an effective means of control
over inventory. A comparison of the amount of inventory on hand with
(2) A perpetual inventory system provides an accurate method for
(3) A perpetual inventory system provides an aid for maintaining inventories
at optimum levels. Frequent review of the perpetual inventory records
helps management in the timely reordering of merchandise so that loss of
sales and excessive accumulation of inventory are avoided. An analysis of
April 31,000 units 16,000 units 15,000 units 15,000 units 16,000 units
May 33,000 16,000 17,000 32,000 20,000
June 40,000 20,000 20,000 52,000 24,000
July 40,000 24,000 16,000 68,000 28,000
It appears that during April through July, the company ordered inventory
without regard to the accumulation of excess inventory. A perpetual
inventory system might have prevented this excess accumulation from
occurring.
Sales
Inventory
End of Month
Sales
Inventory at
Next Month’s
Increase
Month
Purchases
(Decrease) in
CHAPTER 7 Inventories
CP 7–4
Cost of Goods Sold
Average Inventory
Dell
$48,260 $48,260
($1,301 + $1,404) ÷ 2 $1,352.5
Hewlett-Packard
$92,385 $92,385
($7,490 + $6,317) ÷ 2 $6,903.5
Inventory Turnover = = =
Inventory Turnover
13.4
a.
35.7Inventory Turnover = = =
=
CP 7–5
Inventory
Turnover
0.81
8.34
Computations:
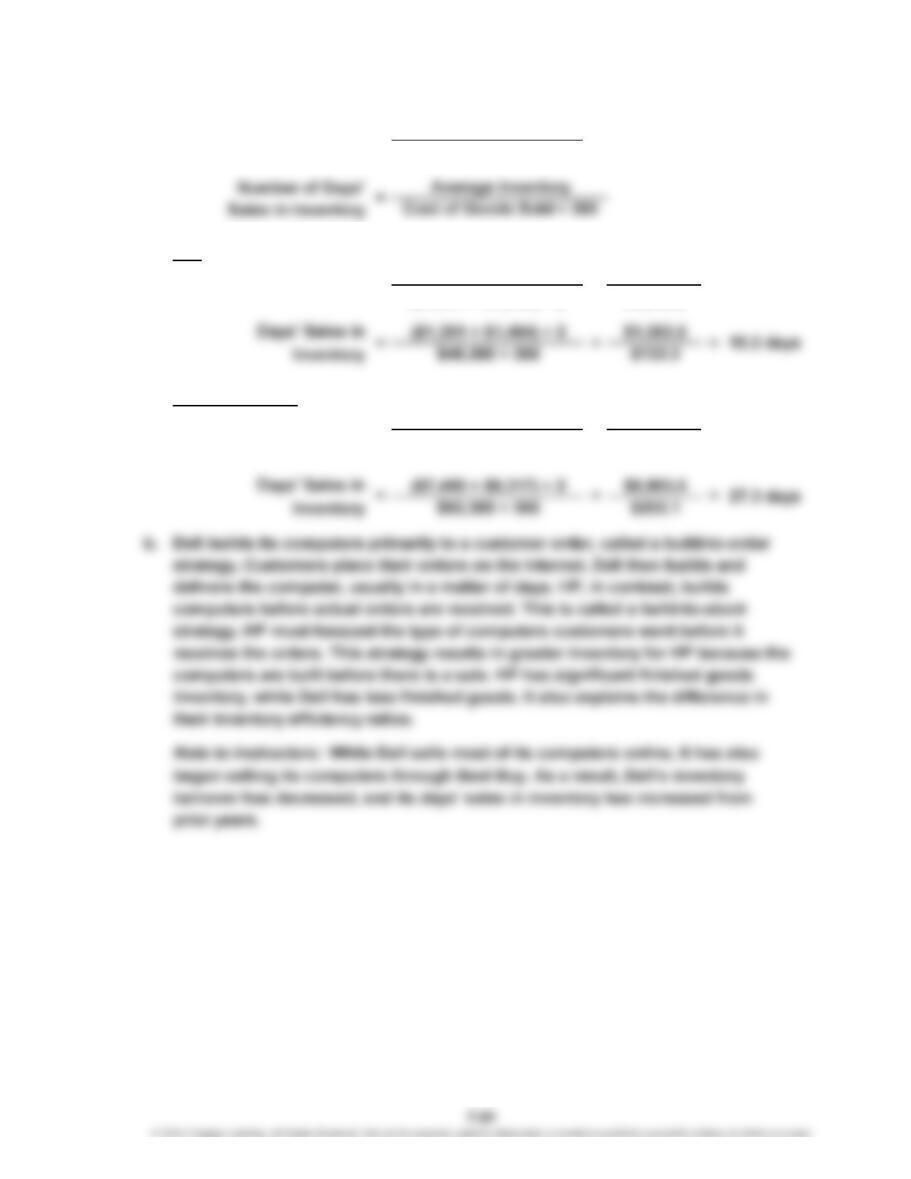
Tiffany Co.
Cost of Goods Sold
Average Inventory
$1,492
($1,625 + $2,073) ÷ 2
Amazon.com
Cost of Goods Sold
Average Inventory
$45,971
($4,992 + $6,031) ÷ 2
Inventory Turnover
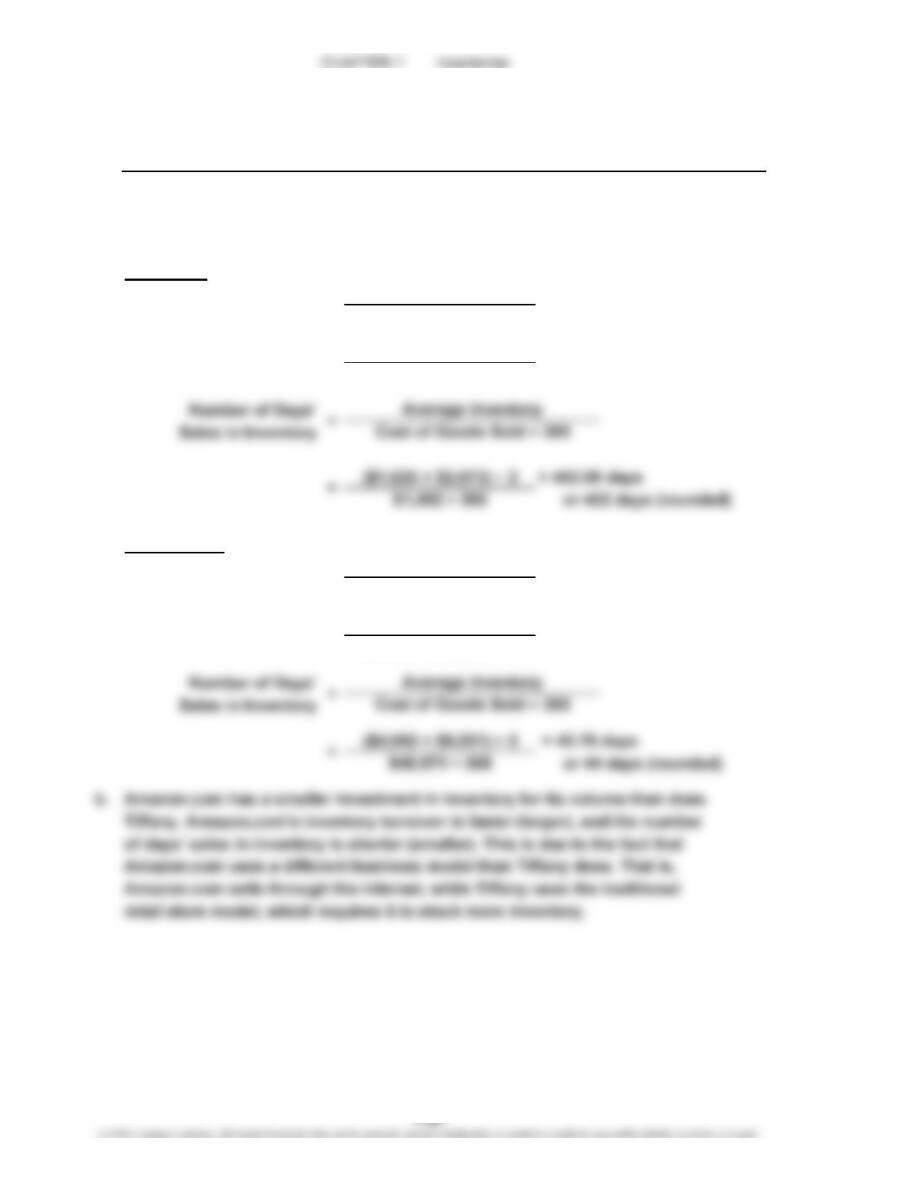
a. Number of Days’
Sales in Inventory
=Inventory Turnover
Tiffany Co. 452.34
43.76
Amazon.com
= 0.81
=
=
= = 8.34
CHAPTER 7 Inventories
CP 7–6
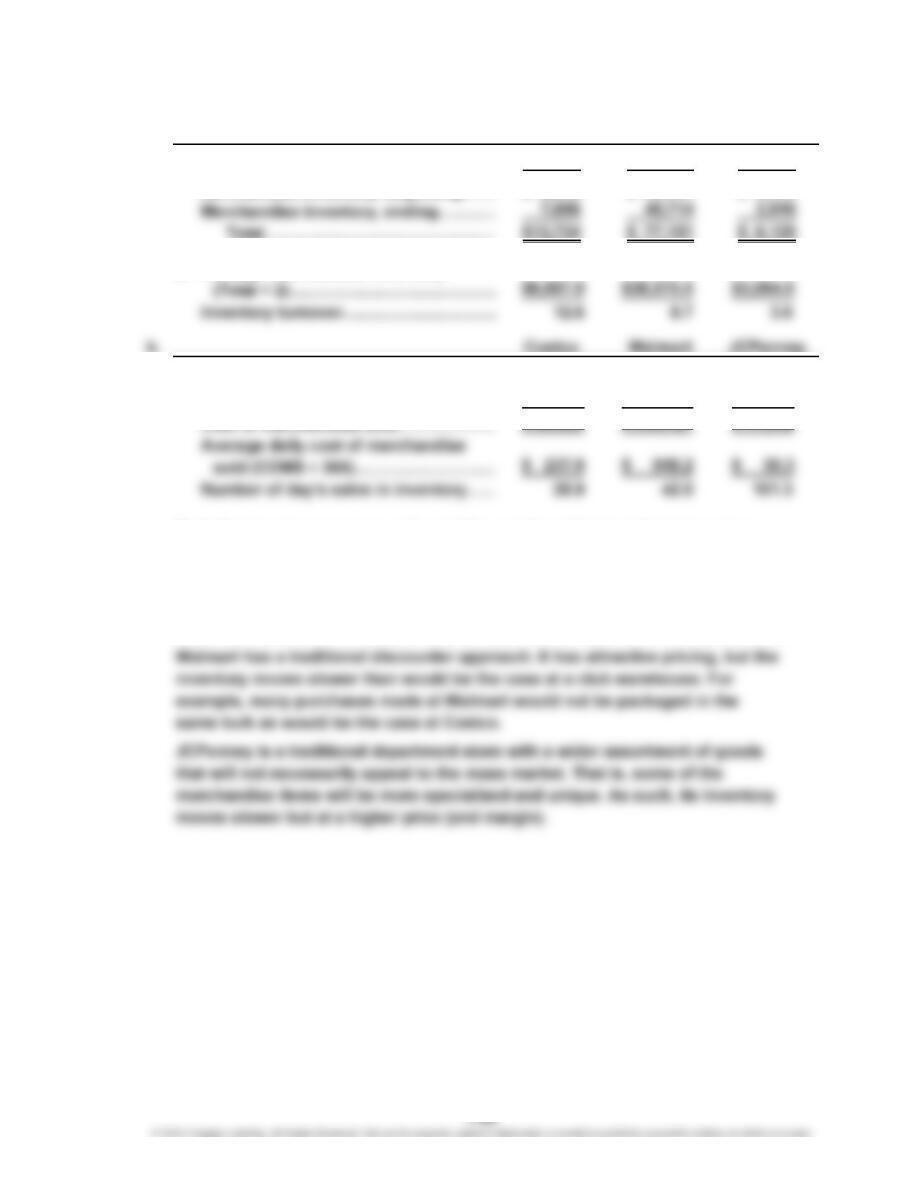
a. Costco Walmart JCPenney
1.
Cost of merchandise sold………………
$86,823 $335,127 $11,042
Merchandise inventory, beginning………
$6,638 $36,437 $3,213
Merchandise inventory, ending…………
2. Average merchandise inventory
(Total ÷ 2)…………………………………
Inventory turnover…………………………
1. Average merchandise inventory
[from part (a)]……………………………
$6,867.0 $38,575.5 $3,064.5
Cost of merchandise sold………………
$86,823 $335,127 $11,042
sold (COMS ÷ 365)………………………
Number of day’s sales in inventory……
c. Both the inventory turnover ratio and the number of day’s sales in inventory
reflect the merchandising approaches of the three companies.
Costco is a club warehouse. Its approach is to hold only mass appeal items that
are sold quickly off the shelf. Most items are sold in bulk quantities at very
attractive prices. Costco couples thin margins with very fast inventory turnover.