7-21
PROBLEM 7-36 (30 MINUTES)
1.
Break-even point in units, using the equation approach:
$24X – ($15 + $3)X – $1,800,000
=
0
300,000 units
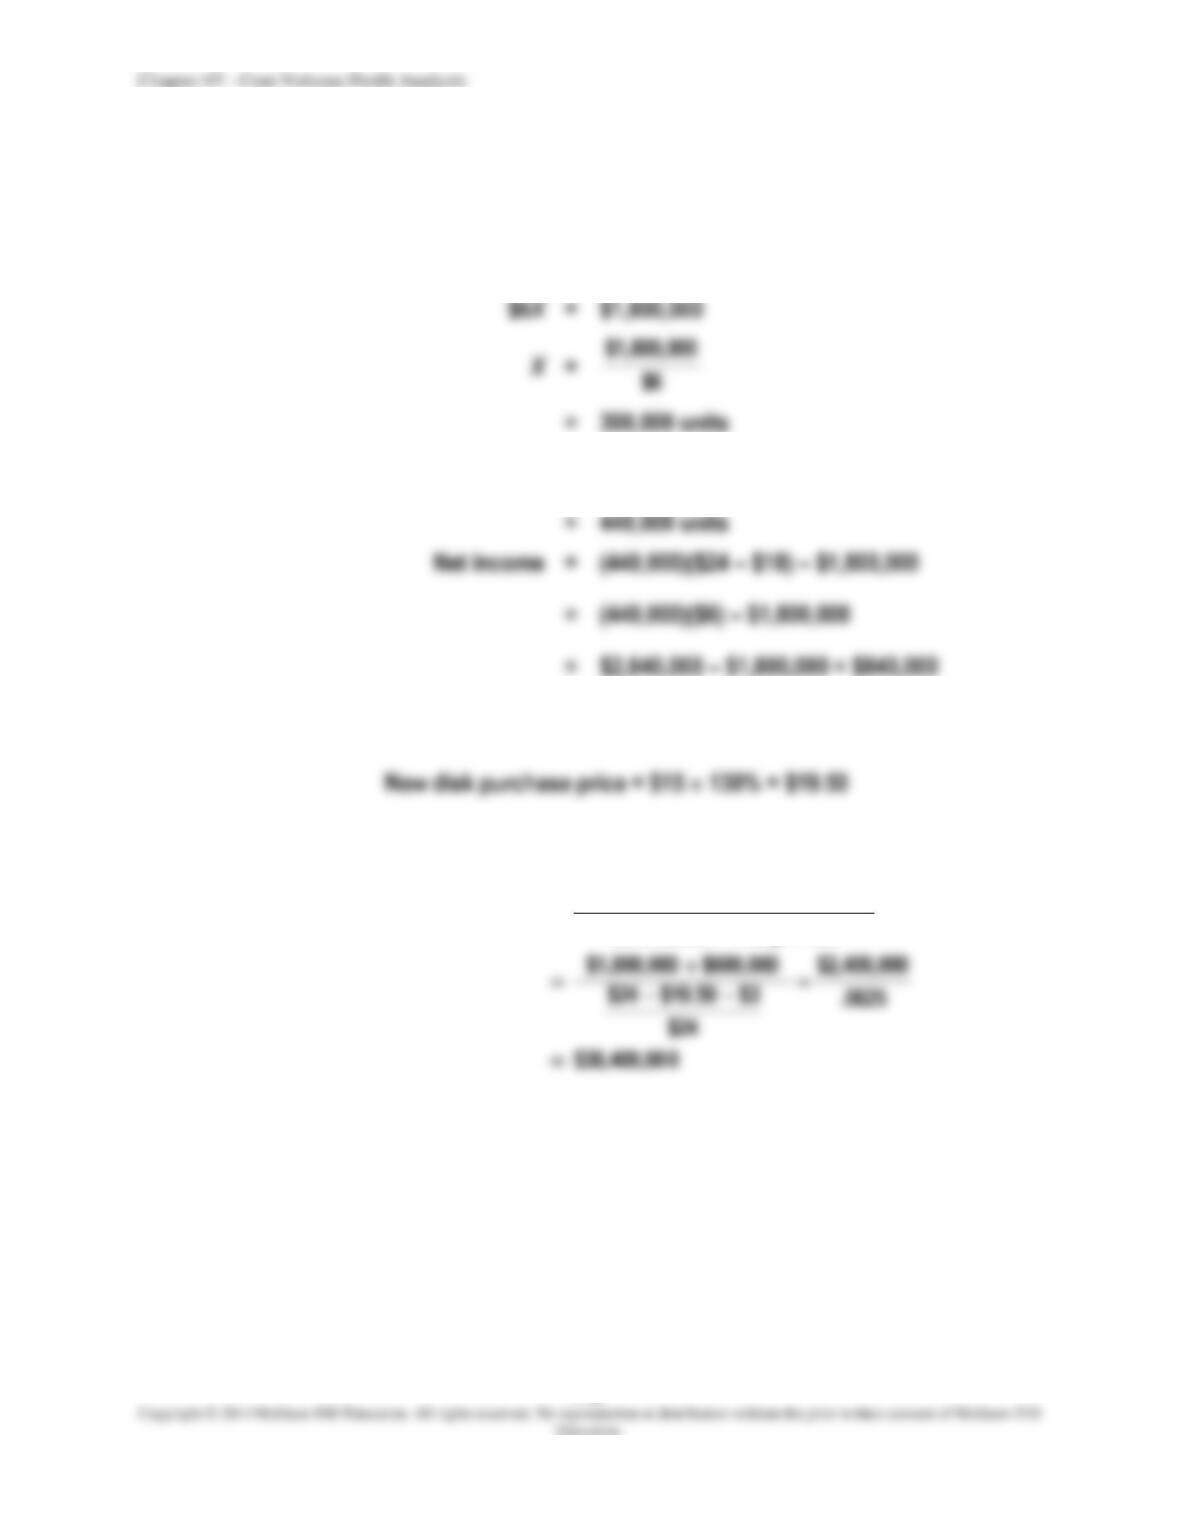
2.
New projected sales volume
=
400,000 110%
=
$2,640,000 – $1,800,000 = $840,000
3.
Target net income = $600,000 (from original problem data)
Volume of sales dollars required:
Volume of sales dollars required
ratio margin–oncontributi
profitnet target expenses fixed
+
=
7-22
PROBLEM 7-36 (CONTINUED)
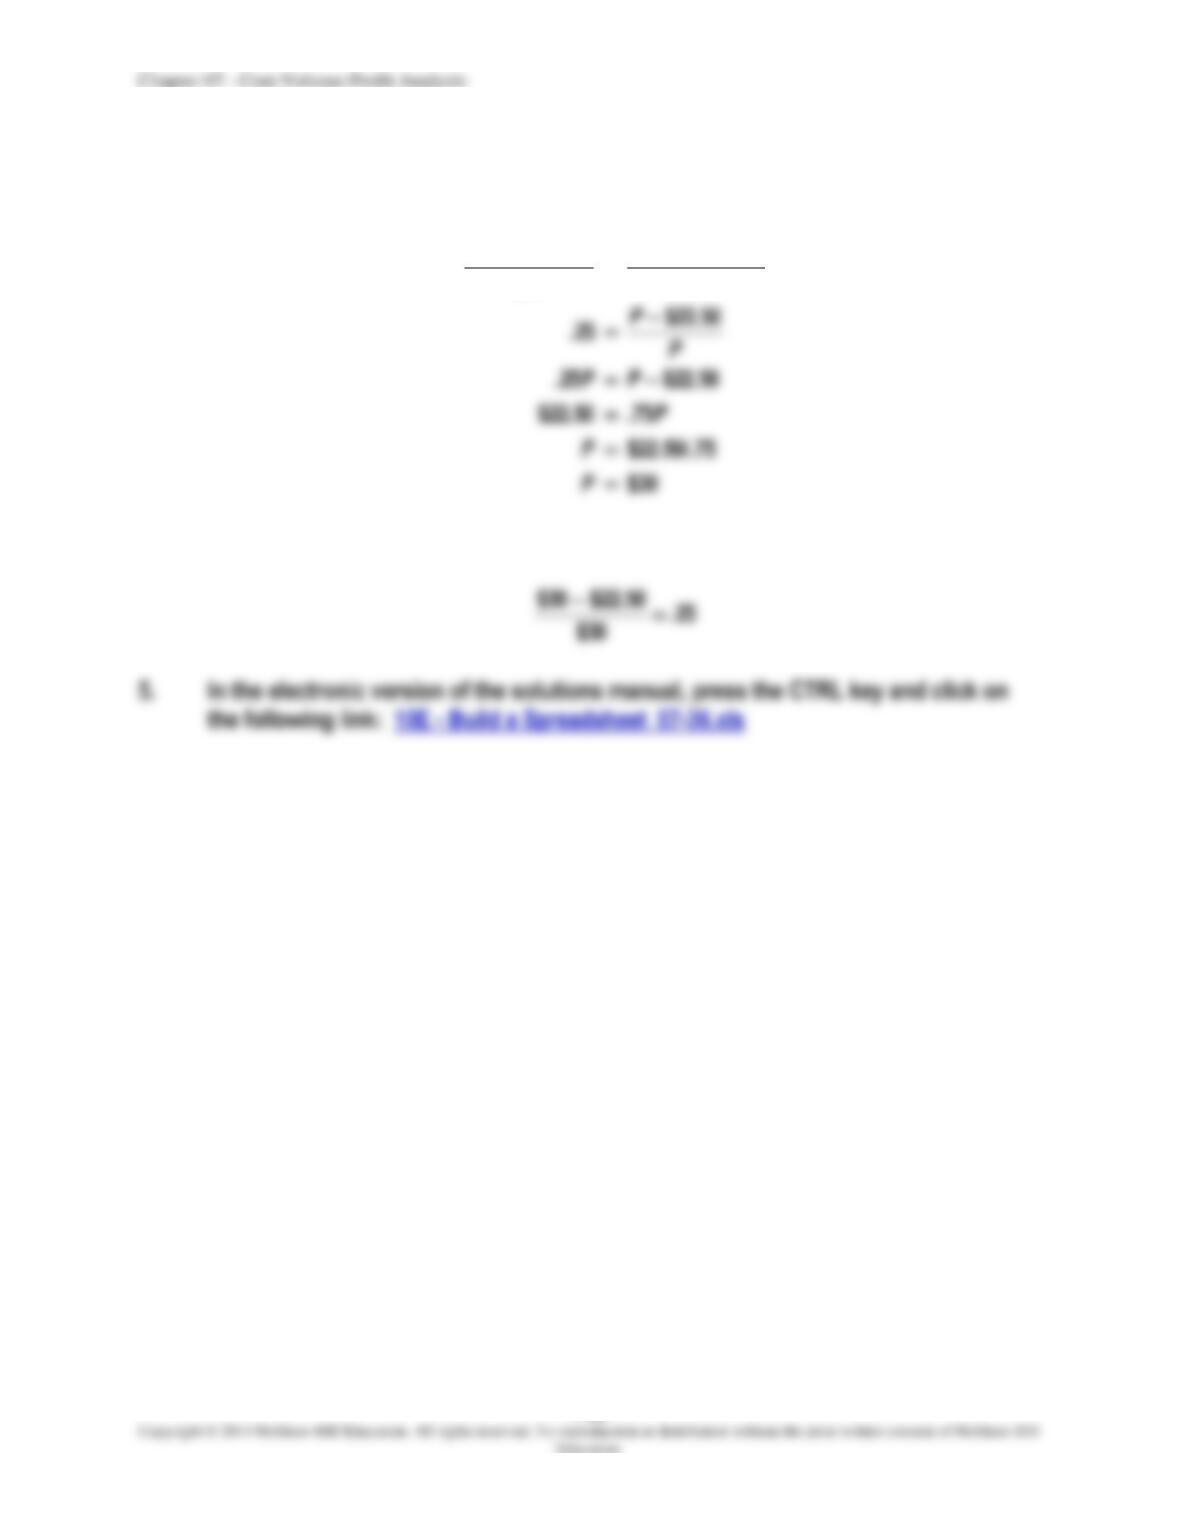
4.
Let P denote the selling price that will yield the same contribution-margin ratio:
$3 $19.50
$24
$3 $15 $24
−−
=
−−
P
P
Check: New contribution-margin ratio is:
Chapter 07 – Cost-Volume-Profit Analysis
7-23
PROBLEM 7-37 (30 MINUTES)
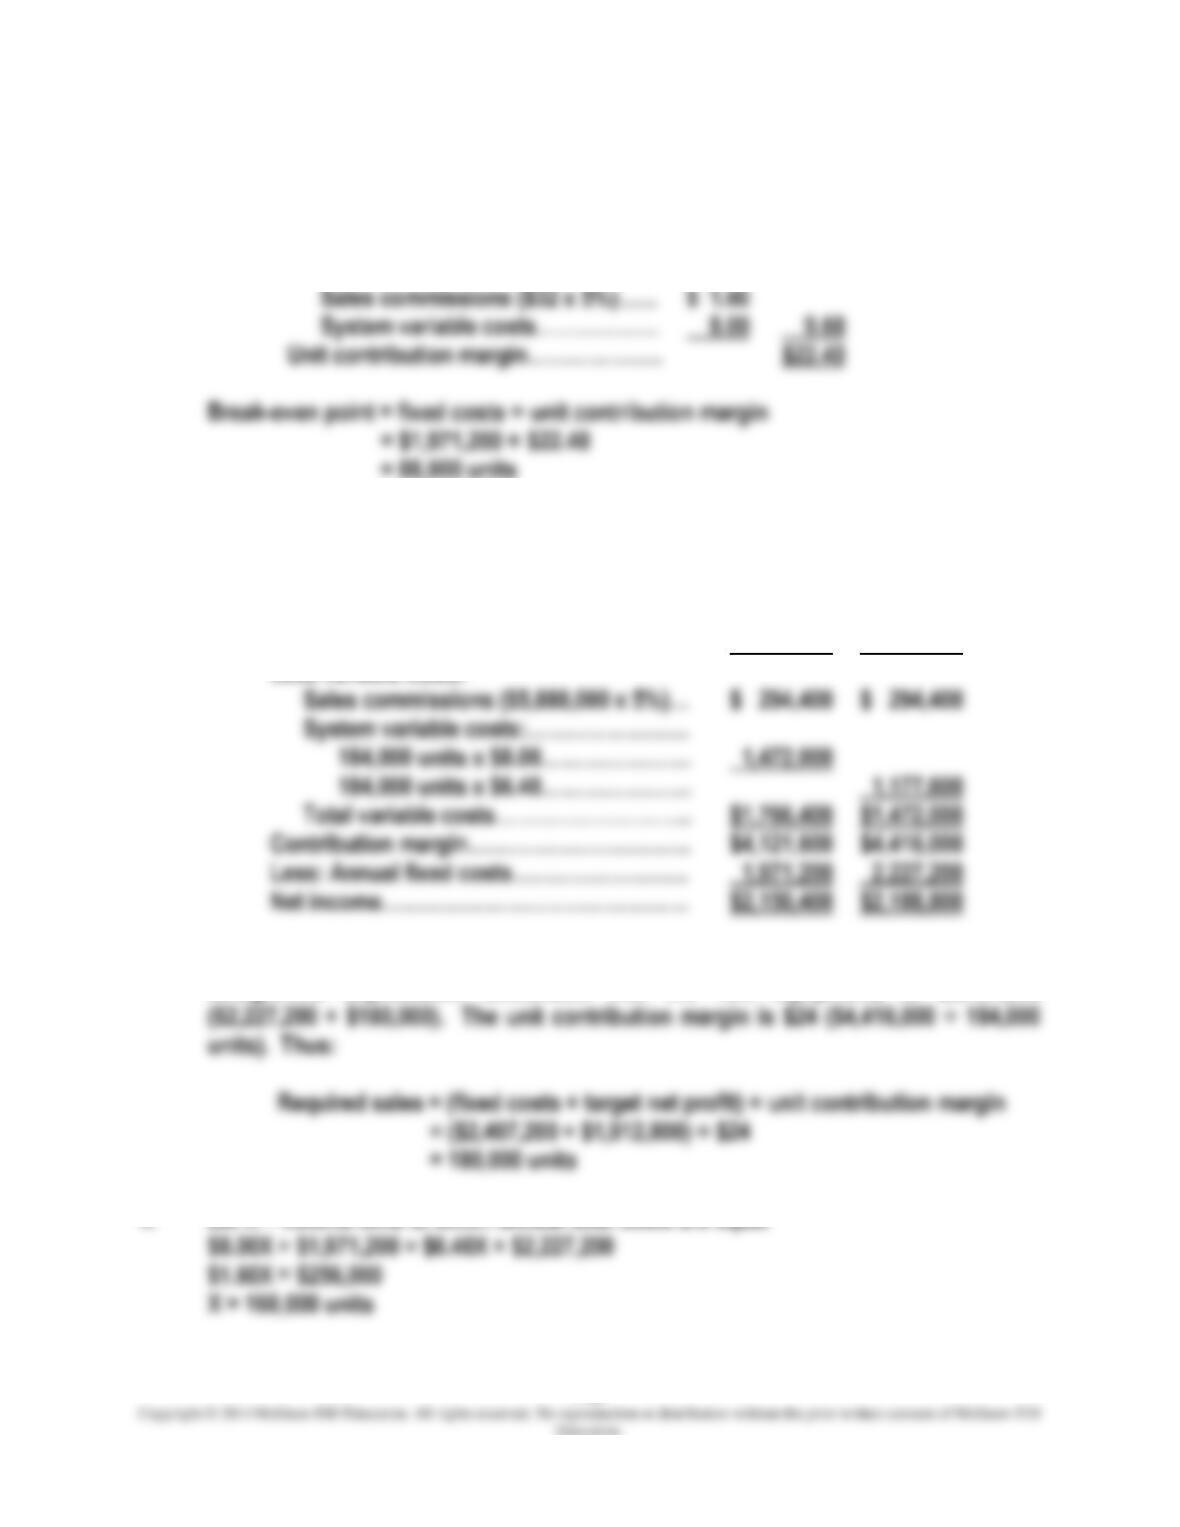
1. Unit contribution margin:
Sales price…………………………………
$32.00
Less variable costs:
$ 1.60
8.00
9.60
Unit contribution margin………………..
$22.40
2. Model B is more profitable when sales and production average 184,000 units.
Model A
Model B
Sales revenue (184,000 units x $32.00)………
$5,888,000
$5,888,000
Less variable costs:
$ 294,400
$ 294,400
$1,766,400
$1,472,000
Contribution margin……………………………
$4,121,600
$4,416,000
Less: Annual fixed costs……………………..
Net income………………………………………
$2,150,400
$2,188,800
3. Annual fixed costs will increase by $180,000 ($900,000 ÷ 5 years) because of
straight-line depreciation associated with the new equipment, to $2,407,200
4. Let X = volume level at which annual total costs are equal
Chapter 07 – Cost-Volume-Profit Analysis
7-24
PROBLEM 7-38 (25 MINUTES)
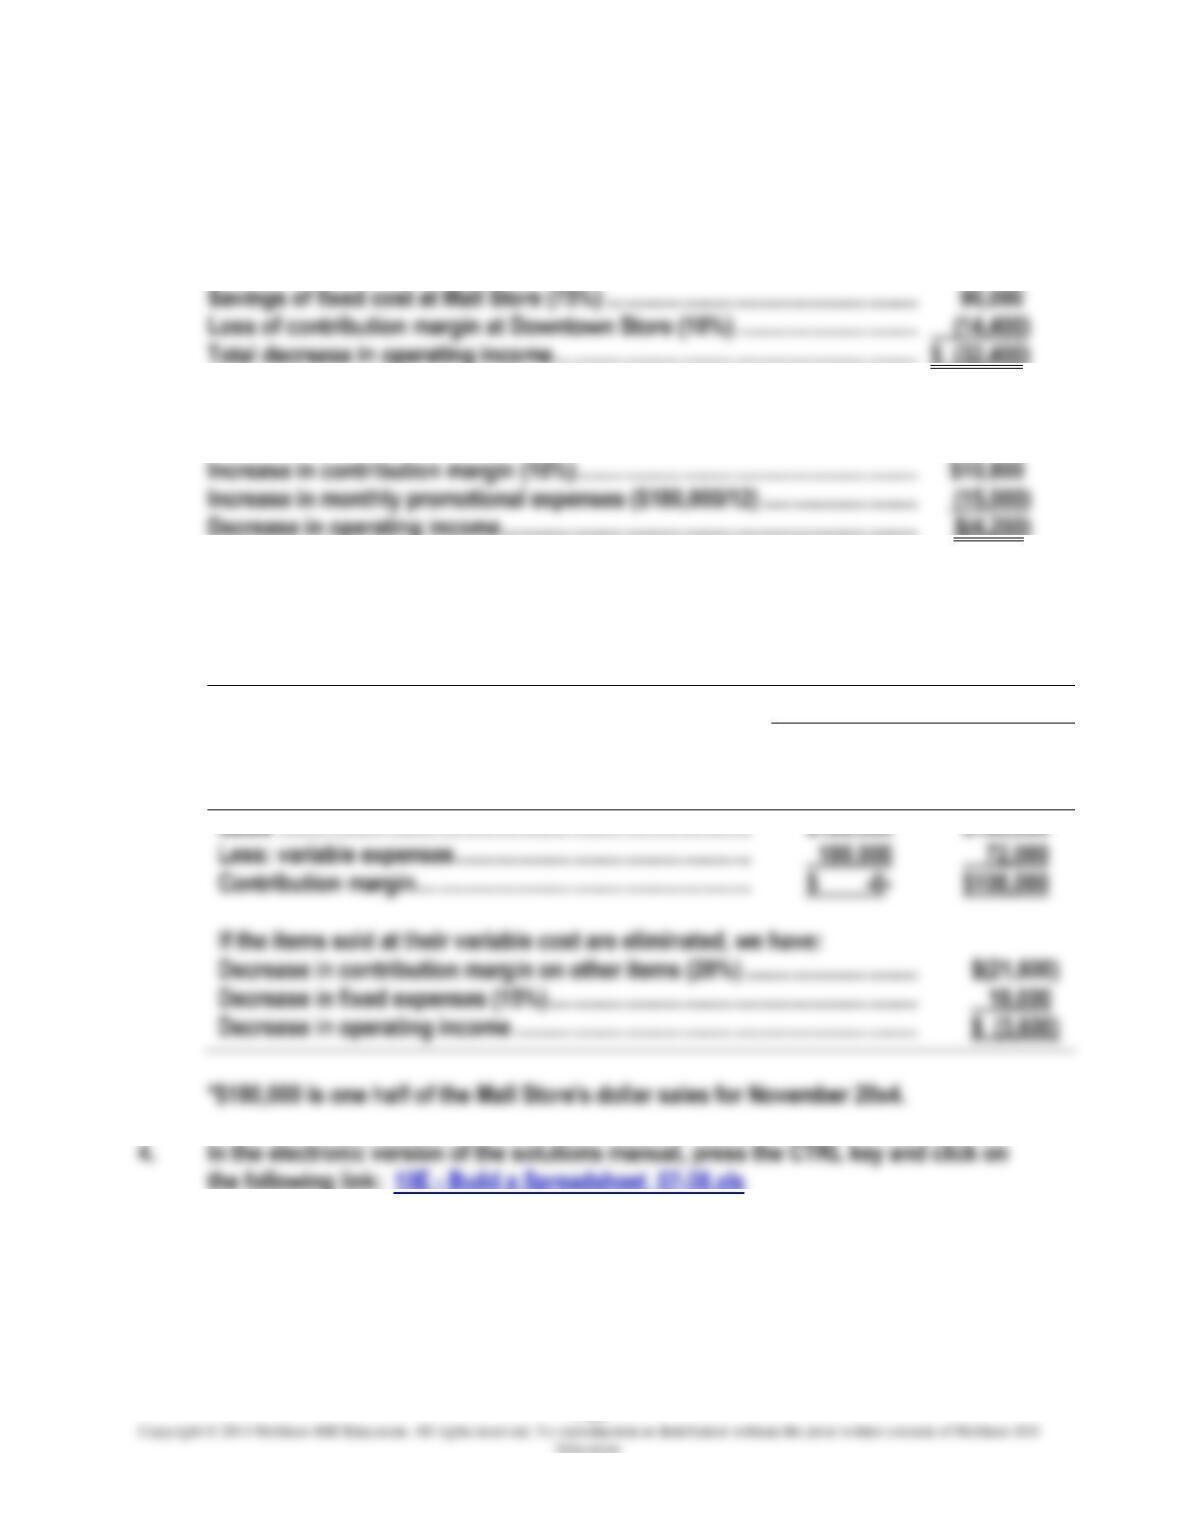
1. Closing of Mall store:
Loss of contribution margin at Mall Store …………………………………………….. $(108,000)
2. Promotional campaign:
3. Elimination of items sold at their variable cost:
We can restate the November 20×4 data for the Mall Store as follows:
Mall Store
Items Sold at
Their
Variable Cost
Other Items

7-25
PROBLEM 7-39 (40 MINUTES)
1. Sales mix refers to the relative proportion of each product sold when a company
7-26
PROBLEM 7-39 (CONTINUED)
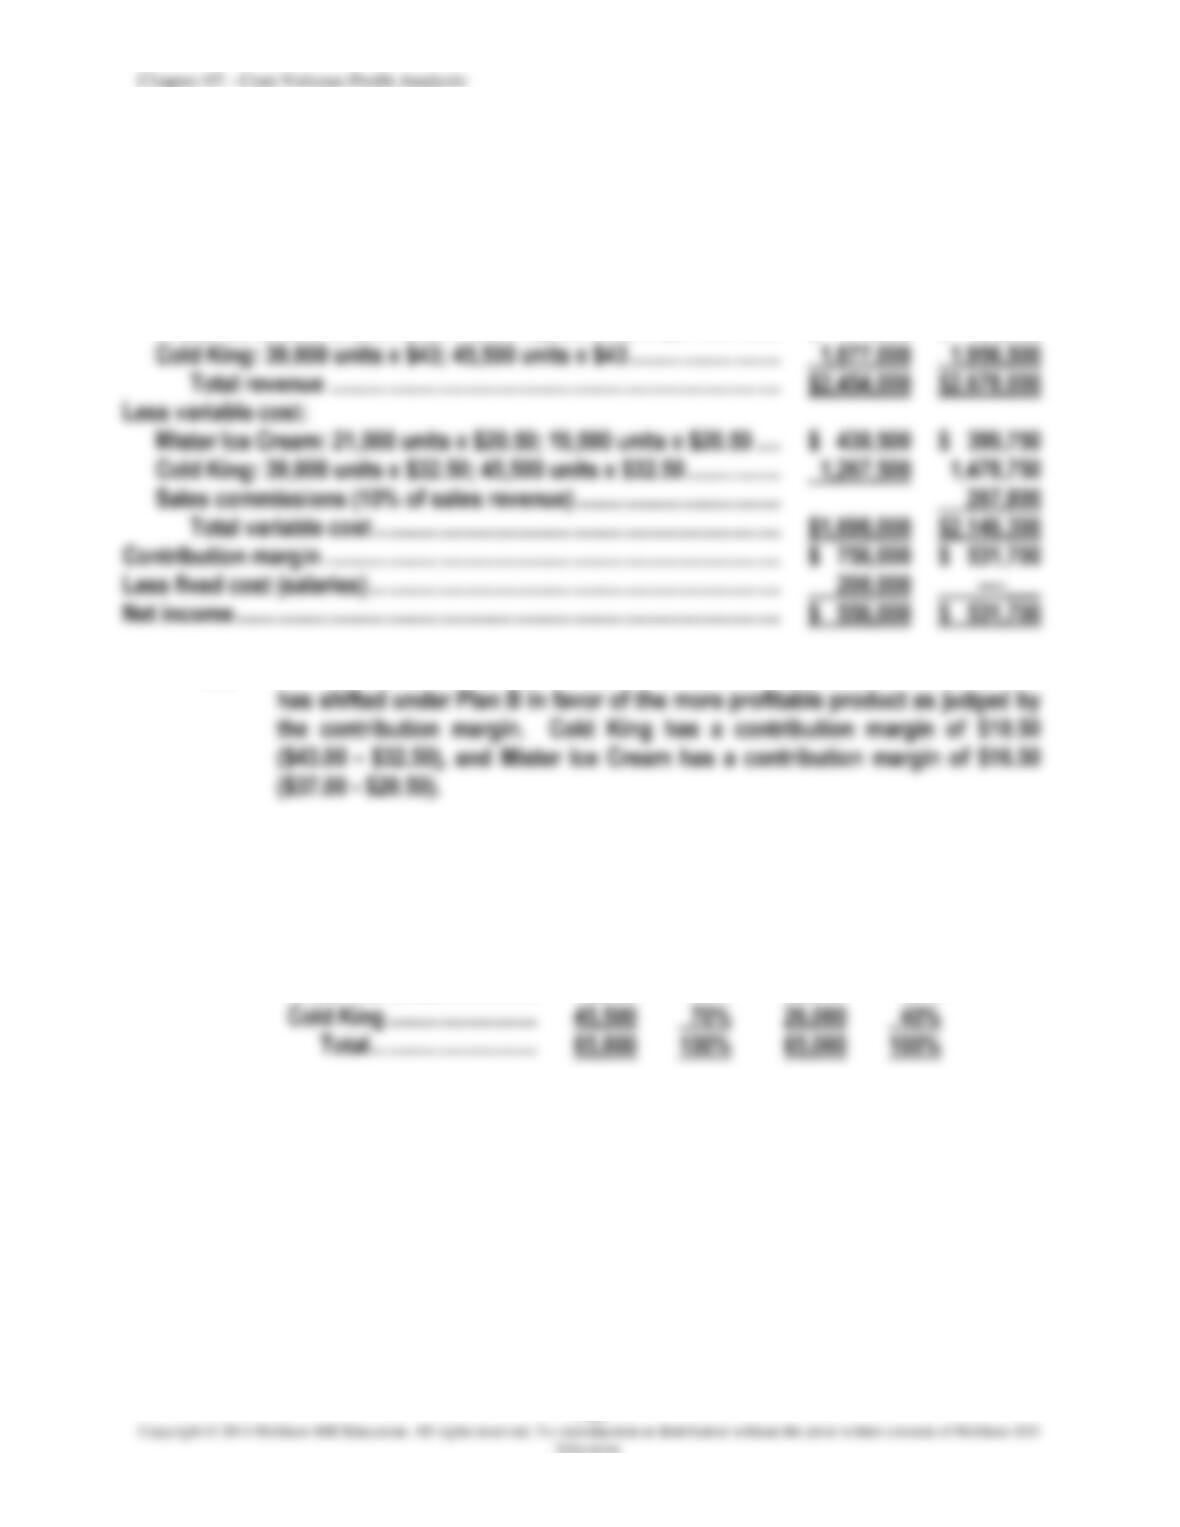
(d) No. The company would be less profitable under the new plan.
Current
Plan A
Sales revenue:
Mister Ice Cream: 21,000 units x $37; 19,500 units x $37 …………..
$ 777,000
$ 721,500
Cold King: 39,000 units x $43; 45,500 units x $43 ……………………..
1,677,000
1,956,500
$2,454,000
$2,678,000
Less variable cost:
Mister Ice Cream: 21,000 units x $20.50; 19,500 units x $20.50 ….
$ 430,500
$ 399,750
Cold King: 39,000 units x $32.50; 45,500 units x $32.50 …………….
1,267,500
1,478,750
Sales commissions (10% of sales revenue) ……………………………..
267,800
$1,698,000
$2,146,300
Contribution margin …………………………………………………………………….
$ 756,000
$ 531,700
Less fixed cost (salaries) ……………………………………………………………..
200,000
—-___
Net income ………………………………………………………………………………….
$ 556,000
$ 531,700
3. (a) The total units sold under both plans are the same; however, the sales mix
Plan A
Plan B
Units
Sales
Mix
Units
Sales
Mix
Mister Ice Cream …………..
19,500
30%
39,000
60%
Cold King ……………………..
45,500
70%
26,000
40%
Total ………………………..
65,000
65,000
7-27
PROBLEM 7-39 (CONTINUED)
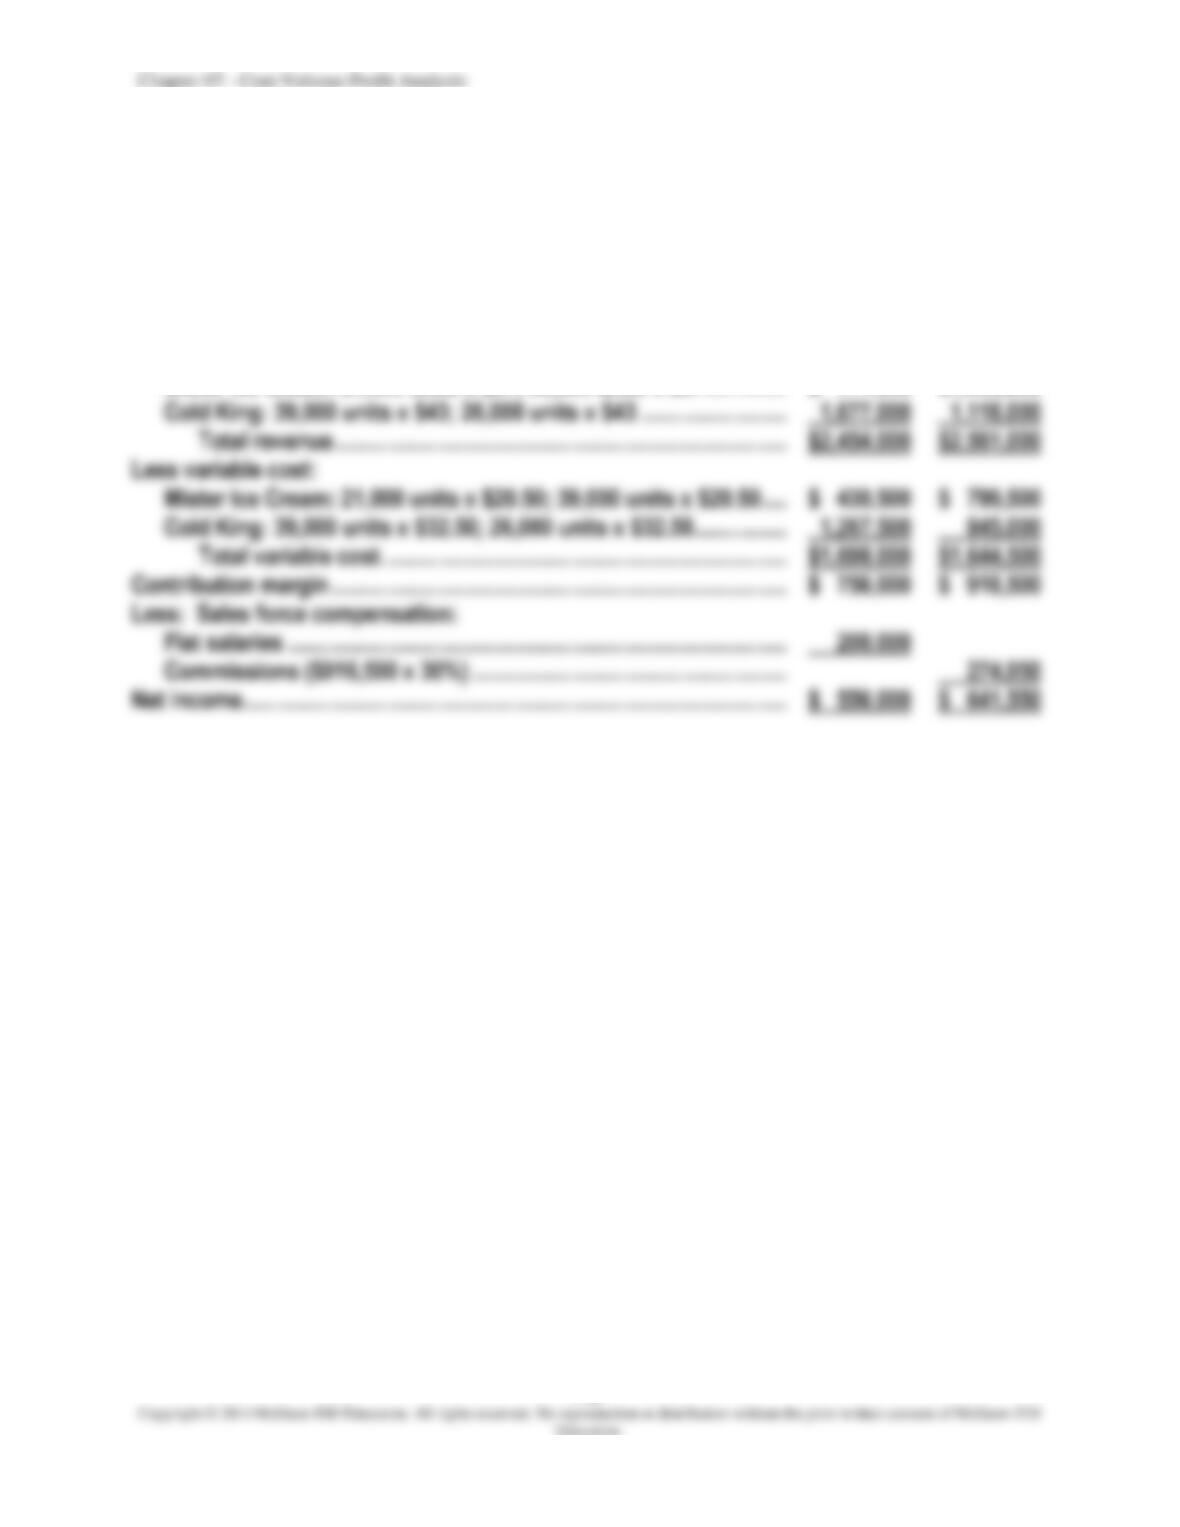
(b) Plan B is more attractive both to the sales force and to the company.
Salespeople earn more money under this arrangement ($274,950 vs.
$200,000), and the company is more profitable ($641,550 vs. $556,000).
Current
Plan B
Sales revenue:
Mister Ice Cream: 21,000 units x $37; 39,000 units x $37 …………..
$ 777,000
$1,443,000
Cold King: 39,000 units x $43; 26,000 units x $43 …………………….
$2,454,000
$2,561,000
Less variable cost:
Mister Ice Cream: 21,000 units x $20.50; 39,000 units x $20.50 ….
$ 430,500
$ 799,500
Cold King: 39,000 units x $32.50; 26,000 units x $32.50 …………….
845,000
$1,698,000
$1,644,500
Contribution margin …………………………………………………………………….
$ 756,000
$ 916,500
Less: Sales force compensation:
Flat salaries …………………………………………………………………………..
200,000
Commissions ($916,500 x 30%) ………………………………………………
274,950
Net income ………………………………………………………………………………….
$ 556,000
$ 641,550
Chapter 07 – Cost-Volume-Profit Analysis
7-28
PROBLEM 7-40 (35 MINUTES)
1. Current income:
Sales revenue………………………...
$4,032,000
Less: Variable costs…………………
$1,008,000
Net income…………………………….
$ 288,000
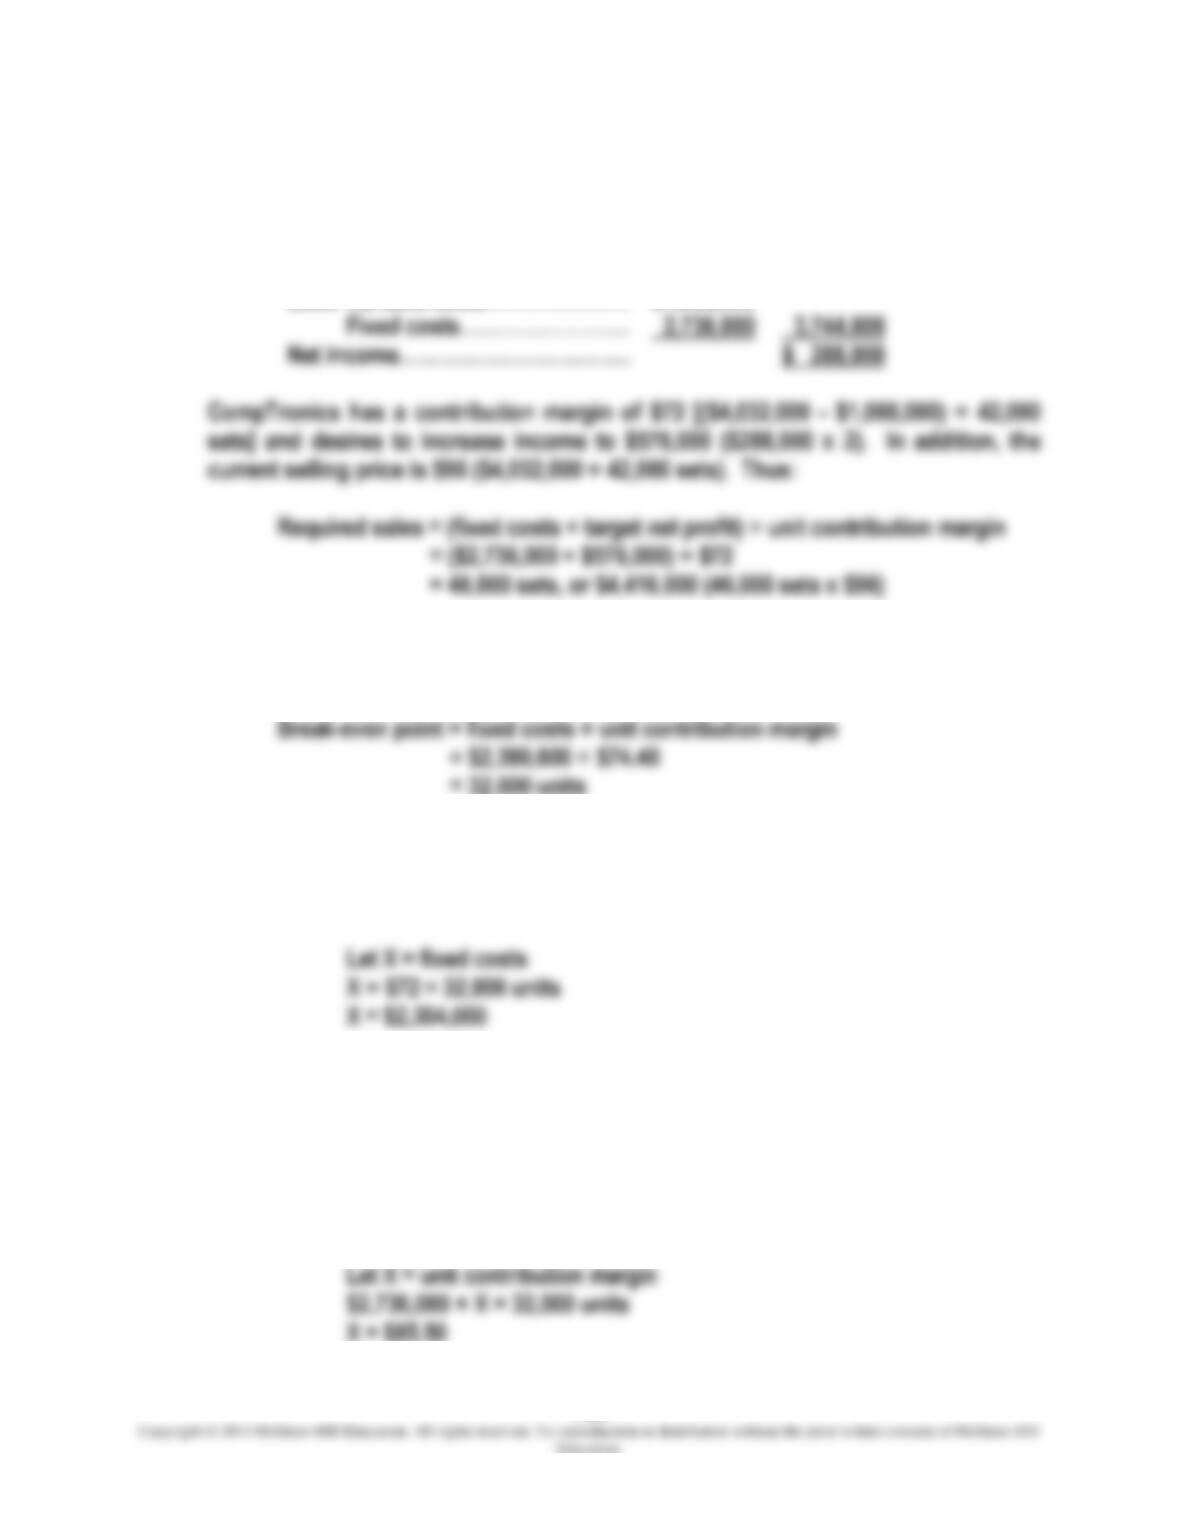
2. If operations are shifted to Mexico, the new unit contribution margin will be $74.40
($96.00 – $21.60). Thus:
3. (a) CompTronics desires to have a 32,000-unit break-even point with a $72 unit
contribution margin. Fixed costs must therefore drop by $432,000 ($2,736,000
– $2,304,000), as follows:
(b) As the following calculations show, CompTronics will have to generate a
contribution margin of $85.50 to produce a 32,000-unit break-even point.
Based on a $96.00 selling price, this means that the company can incur
variable costs of only $10.50 per unit. Given the current variable cost of
$24.00 ($96.00 – $72.00), a decrease of $13.50 per unit ($24.00 – $10.50) is
needed.
7-29
PROBLEM 7-40 (CONTINUED)
PROBLEM 7-41 (45 MINUTES)
1.
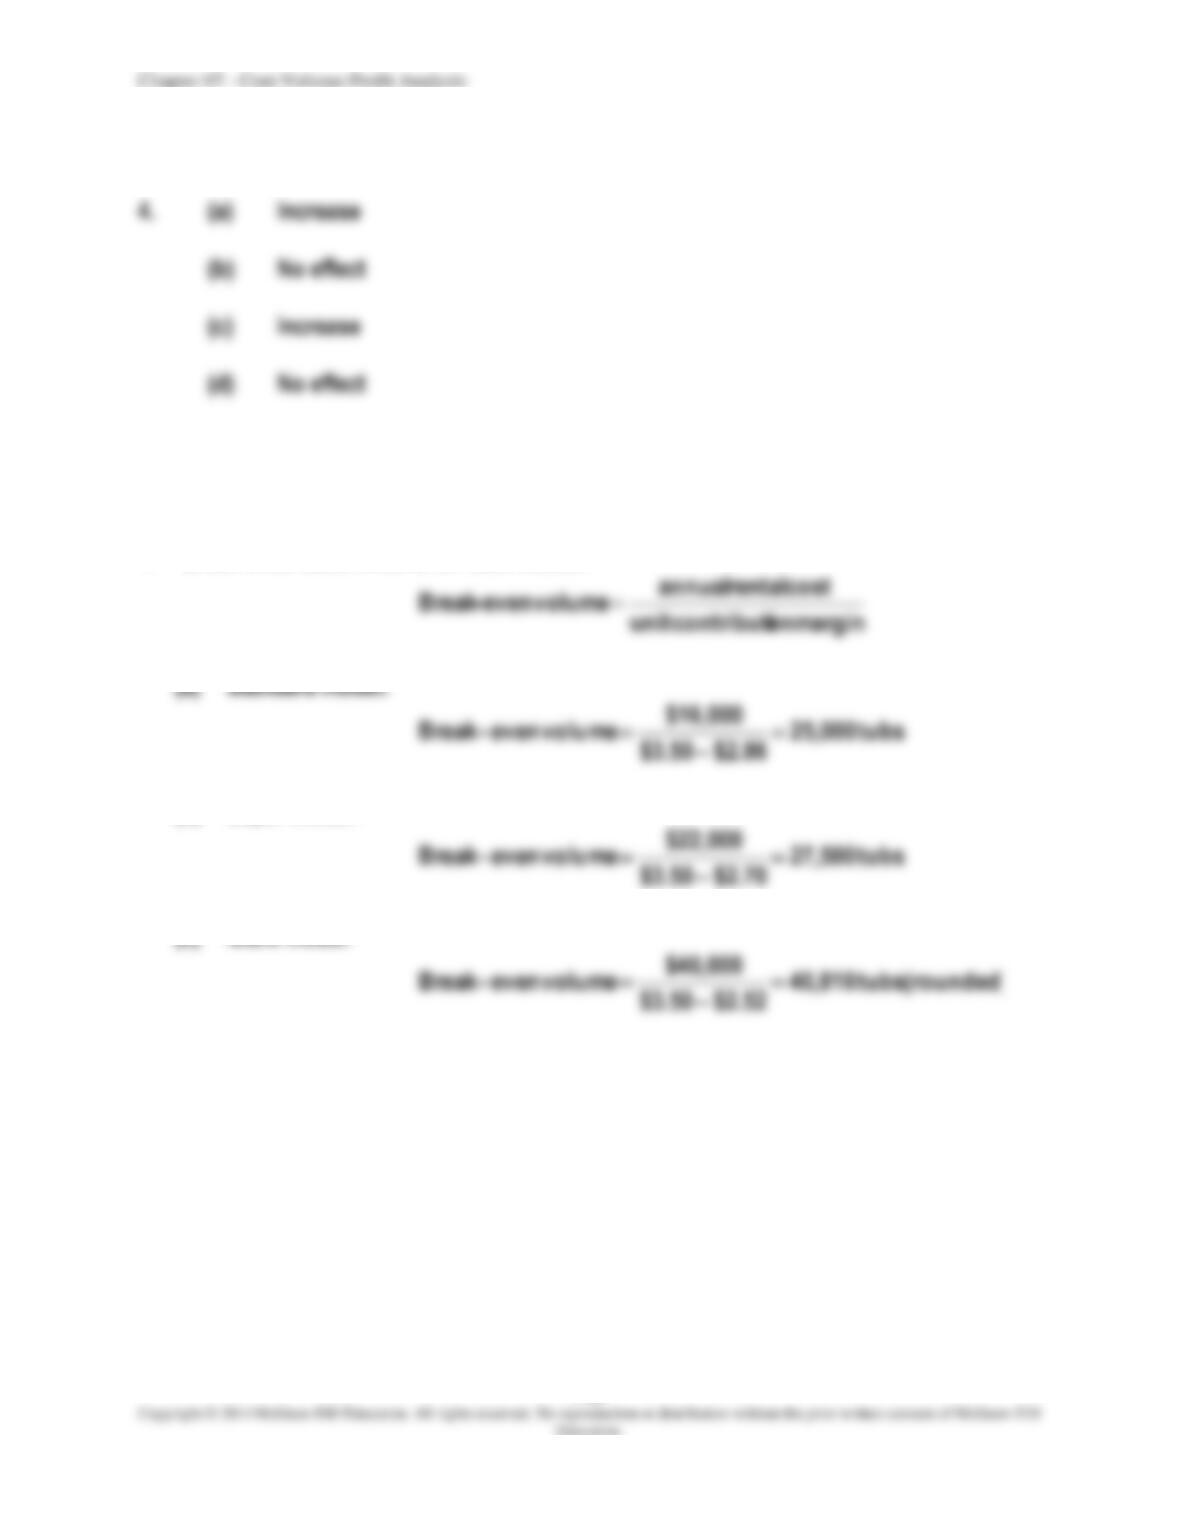
Break-even sales volume for each model:
(a)
Standard model:
(b)
Super model:
(c)
Giant model:
7-30
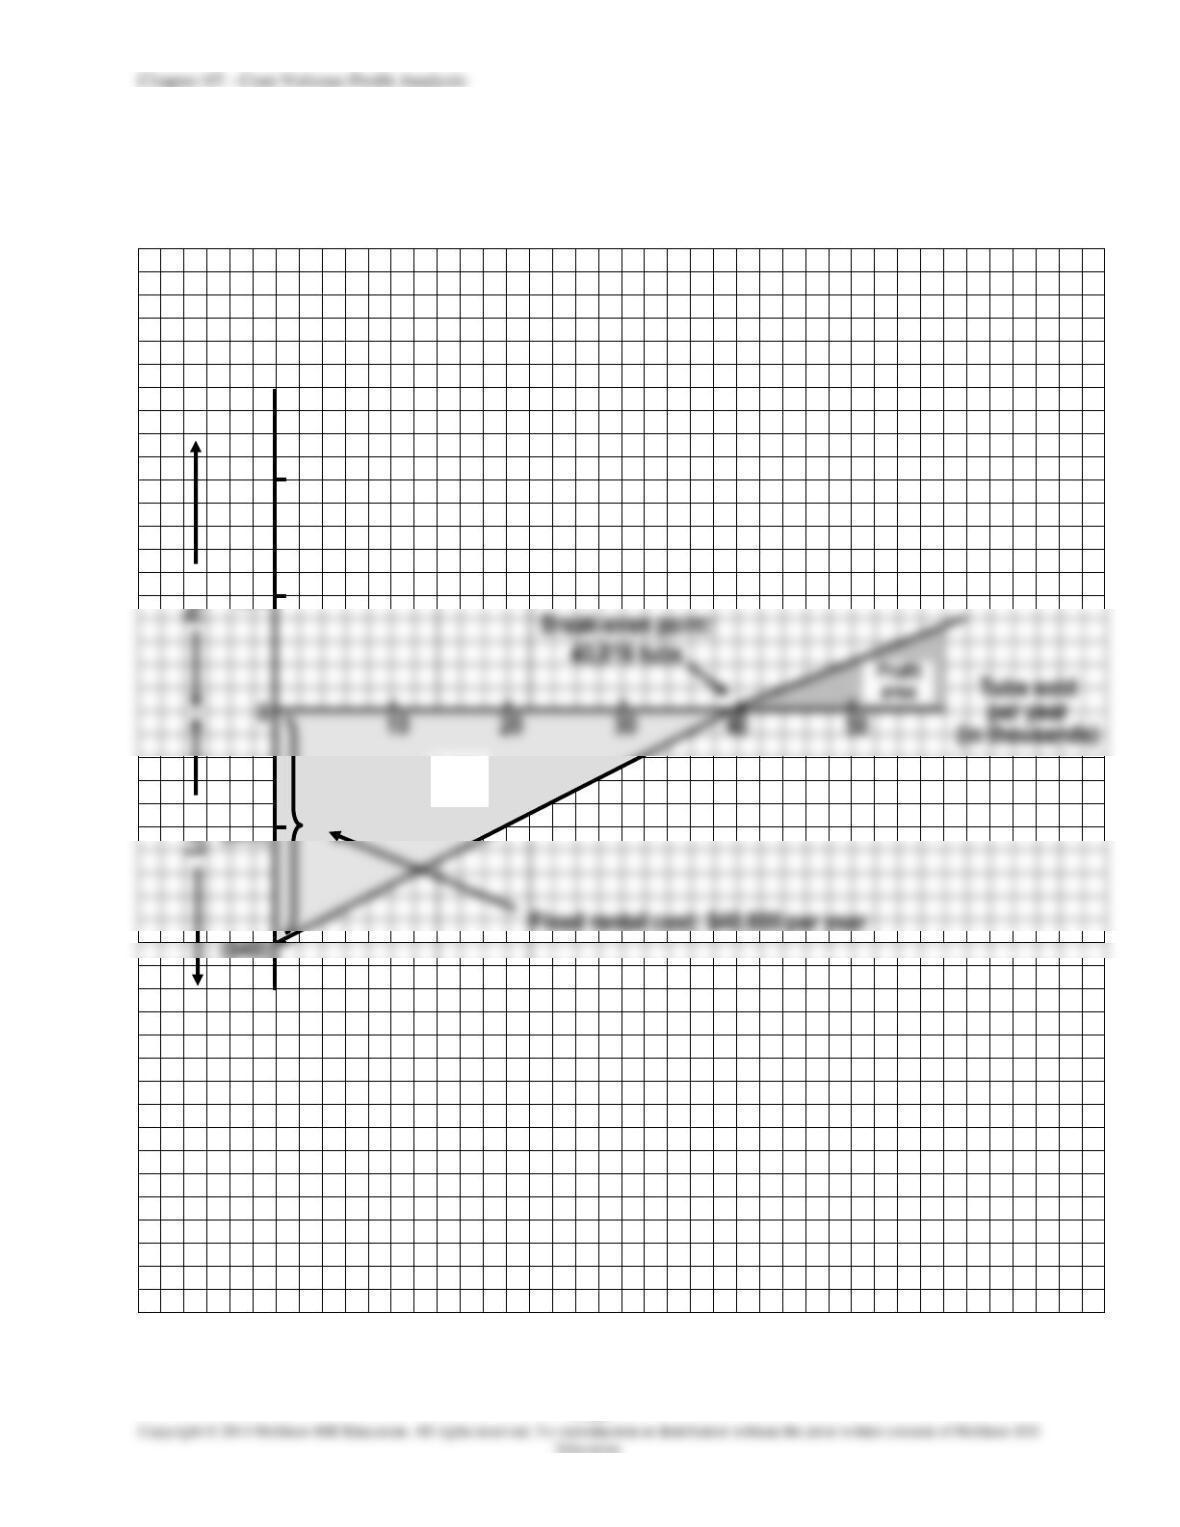
PROBLEM 7-41 (CONTINUED)
2. Profit-volume graph:
Dollars per year (in
thousands)
$40
$20
($20)
($40)
Loss
area
Chapter 07 – Cost-Volume-Profit Analysis
7-31
PROBLEM 7-41 (CONTINUED)
3. The sales price per tub is the same regardless of the type of machine selected.
Therefore, the same profit (or loss) will be achieved with the Standard and Super
models at the sales volume, X, where the total costs are the same.
Model
Variable Cost
per Tub
Total
Fixed Cost
Standard …………………………………………….
$2.86
$16,000
Super ………………………………………………….
2.70
22,000
Or, stated slightly differently:
Volume at which both machines
produce the same profit
aldifferenticost variable
aldifferenticost fixed
=
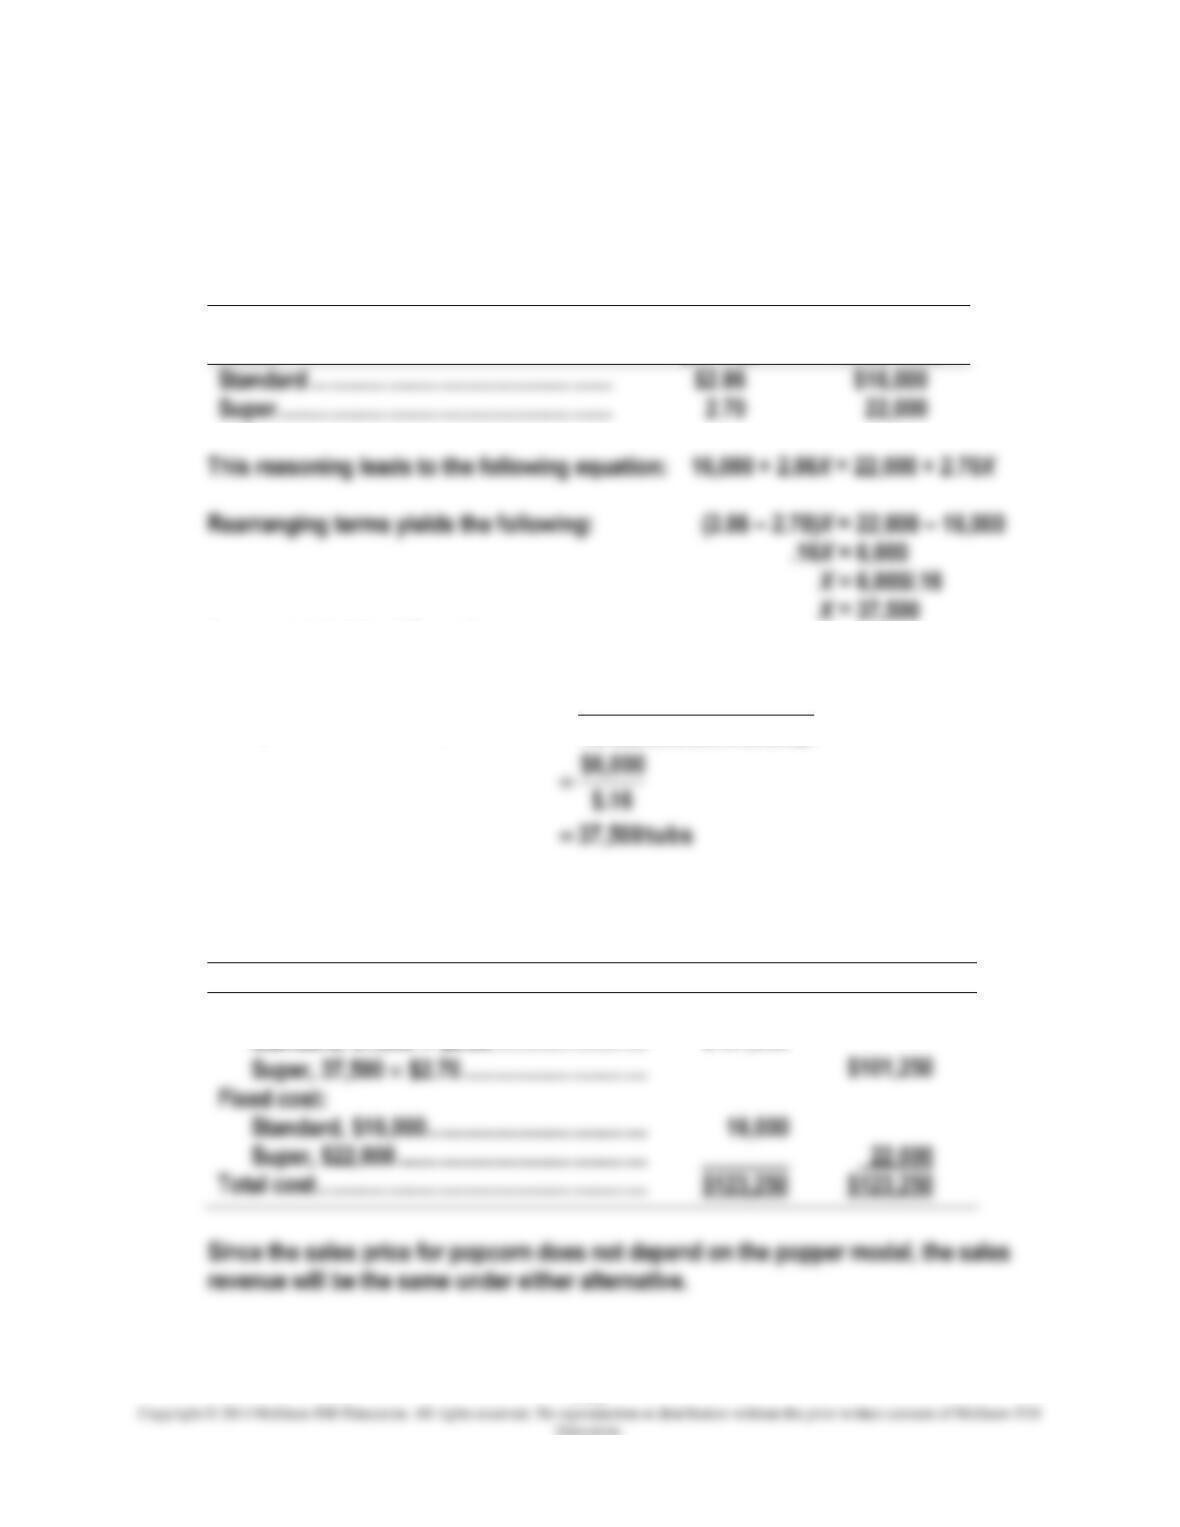
Check: the total cost is the same with either model if 37,500 tubs are sold.
Standard
Super
Variable cost:
Standard, 37,500 $2.86………………………
$107,250
$101,250
Fixed cost:
Standard, $16,000 ………………………………..
16,000
Super, $22,000 …………………………………….
Chapter 07 – Cost-Volume-Profit Analysis
7-32
PROBLEM 7-42 (40 MINUTES)
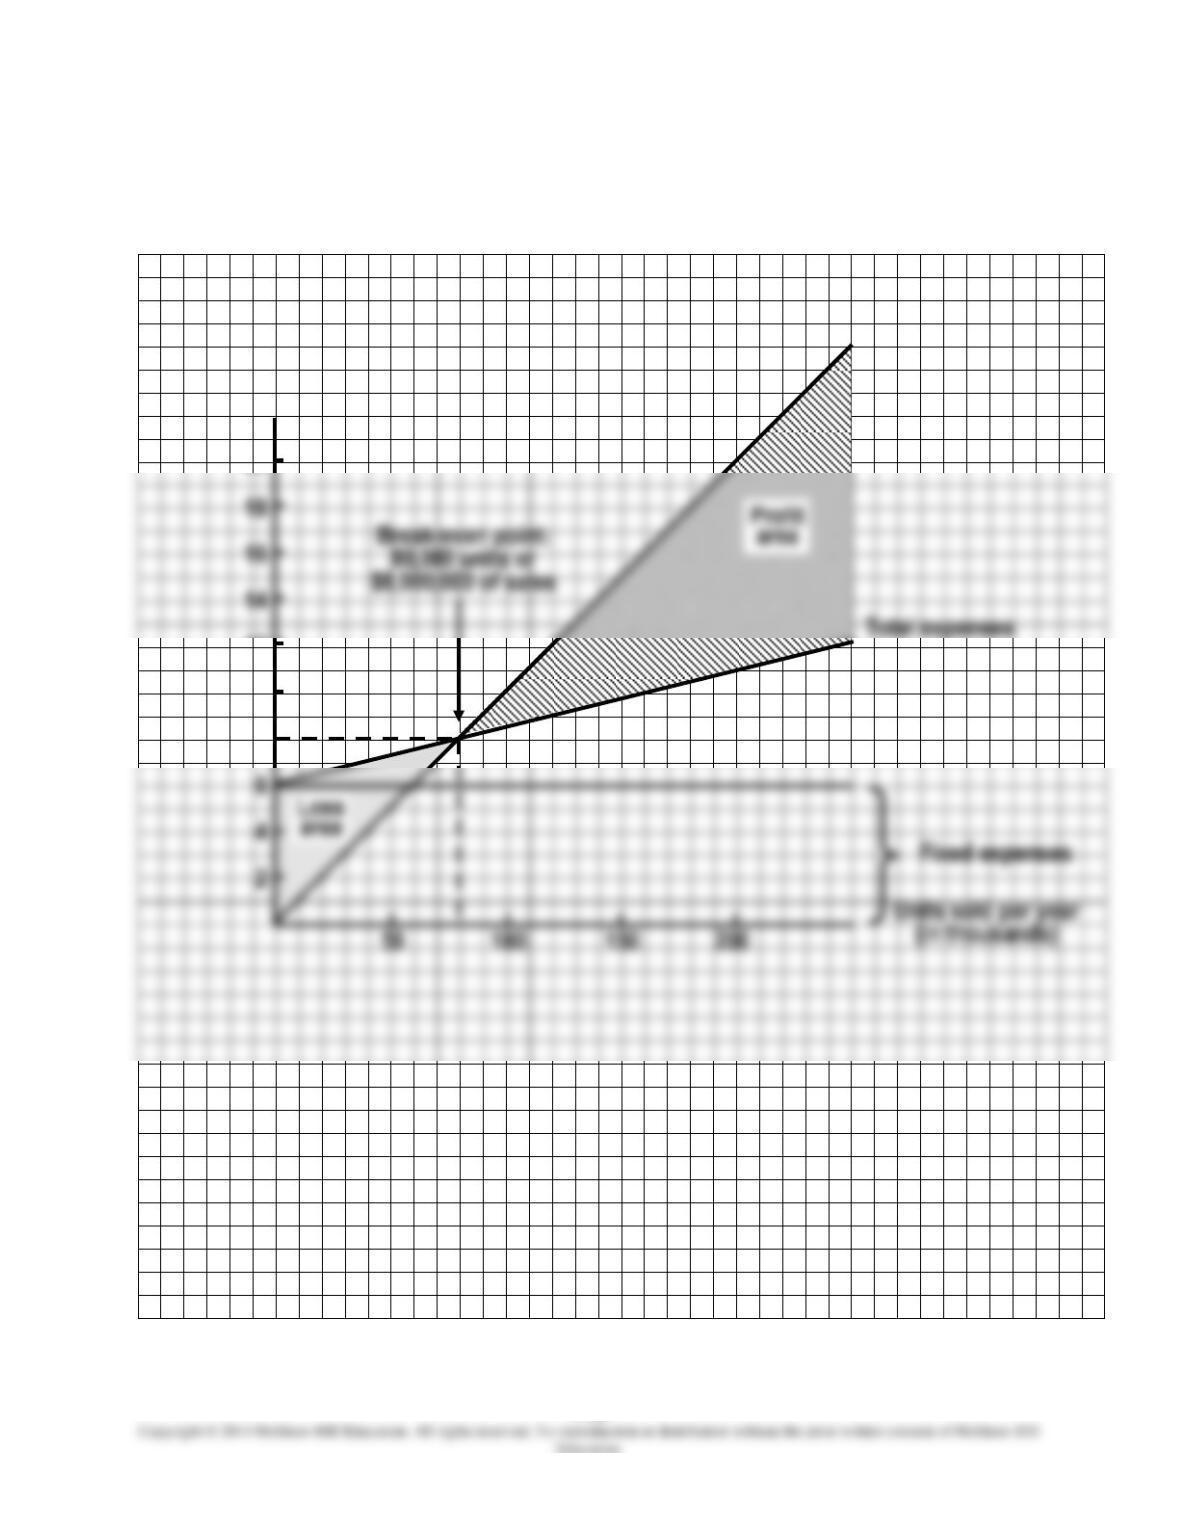
1. CVP graph:
Total expenses
Total revenue
Fixed expenses
Units sold per year
Dollars per year
(in millions)
20
12
10
8
Chapter 07 – Cost-Volume-Profit Analysis
7-33
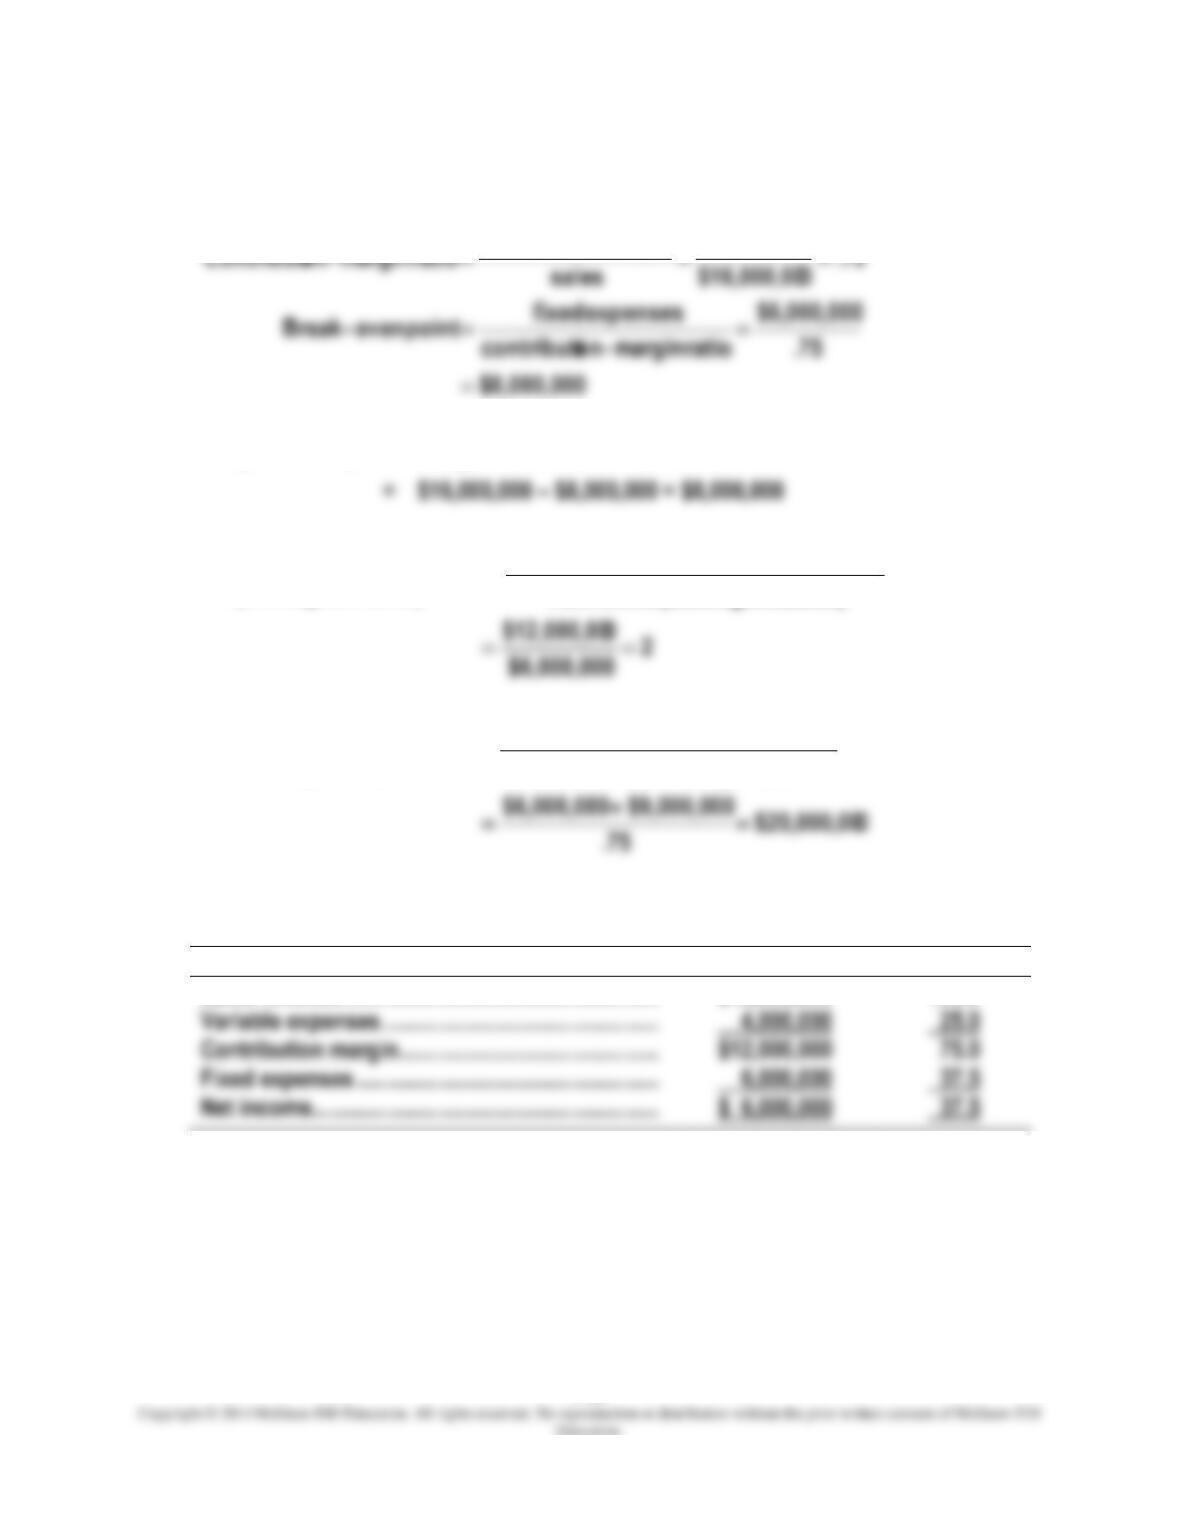
PROBLEM 7-42 (CONTINUED)
2.
Break-even point:
0$12,000,00
margin oncontributi
3.
Margin of safety
=
budgeted sales revenue – break-even sales revenue
=
$16,000,000 – $8,000,000 = $8,000,000
4.
Operating leverage factor
(at budgeted sales)
sales) budgeted(at incomenet
sales) budgeted(at margin oncontributi
=
5.
Dollar sales required to
earn target net profit
ratio margin–oncontributi
profitnet target expenses fixed
+
=
6.
Cost structure:
Amount
Percent
Sales revenue ……………………………………………….
$16,000,000
100.0
Variable expenses …………………………………………
4,000,000
Contribution margin ………………………………………
$12,000,000
Fixed expenses …………………………………………….
6,000,000
Chapter 07 – Cost-Volume-Profit Analysis
7-34
PROBLEM 7-43 (35 MINUTES)
1. Plan A break-even point = fixed costs ÷ unit contribution margin
Plan B break-even point = fixed costs ÷ unit contribution margin
Chapter 07 – Cost-Volume-Profit Analysis
7-35
PROBLEM 7-43 (CONTINUED)
3. Calculation of contribution margin and profit at 6,000 units of sales:
Plan A
Plan B
Sales revenue: 6,000 units x $120……………….
$720,000
$720,000
Less variable costs:
72,000
—-__
$522,000
$450,000
Contribution margin………………………………
$198,000
$270,000
Fixed costs………………………………………….
33,000
99,000
Net income………………………………………….
$165,000
$171,000
Operating leverage factor = contribution margin ÷ net income
4 & 5. Calculation of profit at 5,000 units:
Plan A
Plan B
Sales revenue: 5,000 units x $120……………….
$600,000
Less variable costs:
60,000
—- __
$435,000
$375,000
Contribution margin………………………………
$165,000
$225,000
Fixed costs…………………………………………
33,000
99,000
Net income………………………………………….
$132,000
$126,000
Cost of purchasing product:
Chapter 07 – Cost-Volume-Profit Analysis
7-36
PROBLEM 7-43 (CONTINUED)
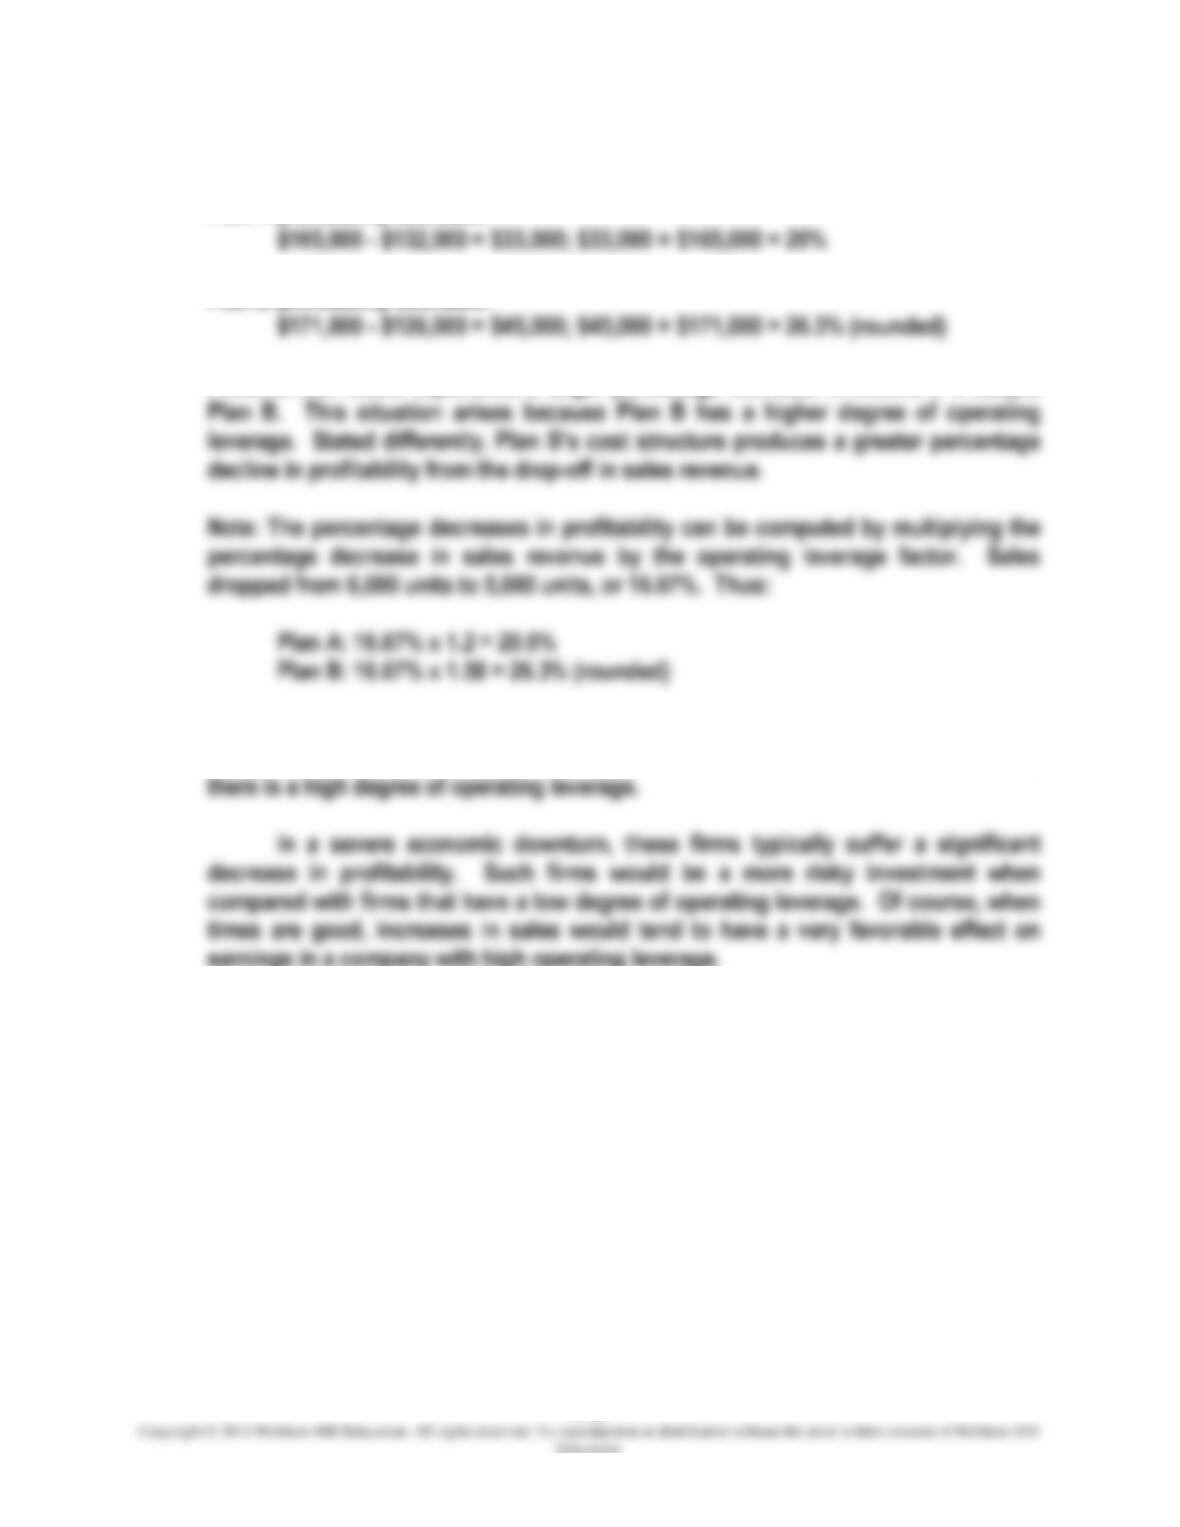
Plan A profitability decrease:
Plan B profitability decrease:
PneumoTech would experience a larger percentage decrease in income if it adopts
6. Heavily automated manufacturers have sizable investments in plant and equipment,
along with a high percentage of fixed costs in their cost structures. As a result,
7-37
PROBLEM 7-44 (45 MINUTES)
1.
Break-even point in units:
margin oncontributiunit
costs fixed
point even–Break =
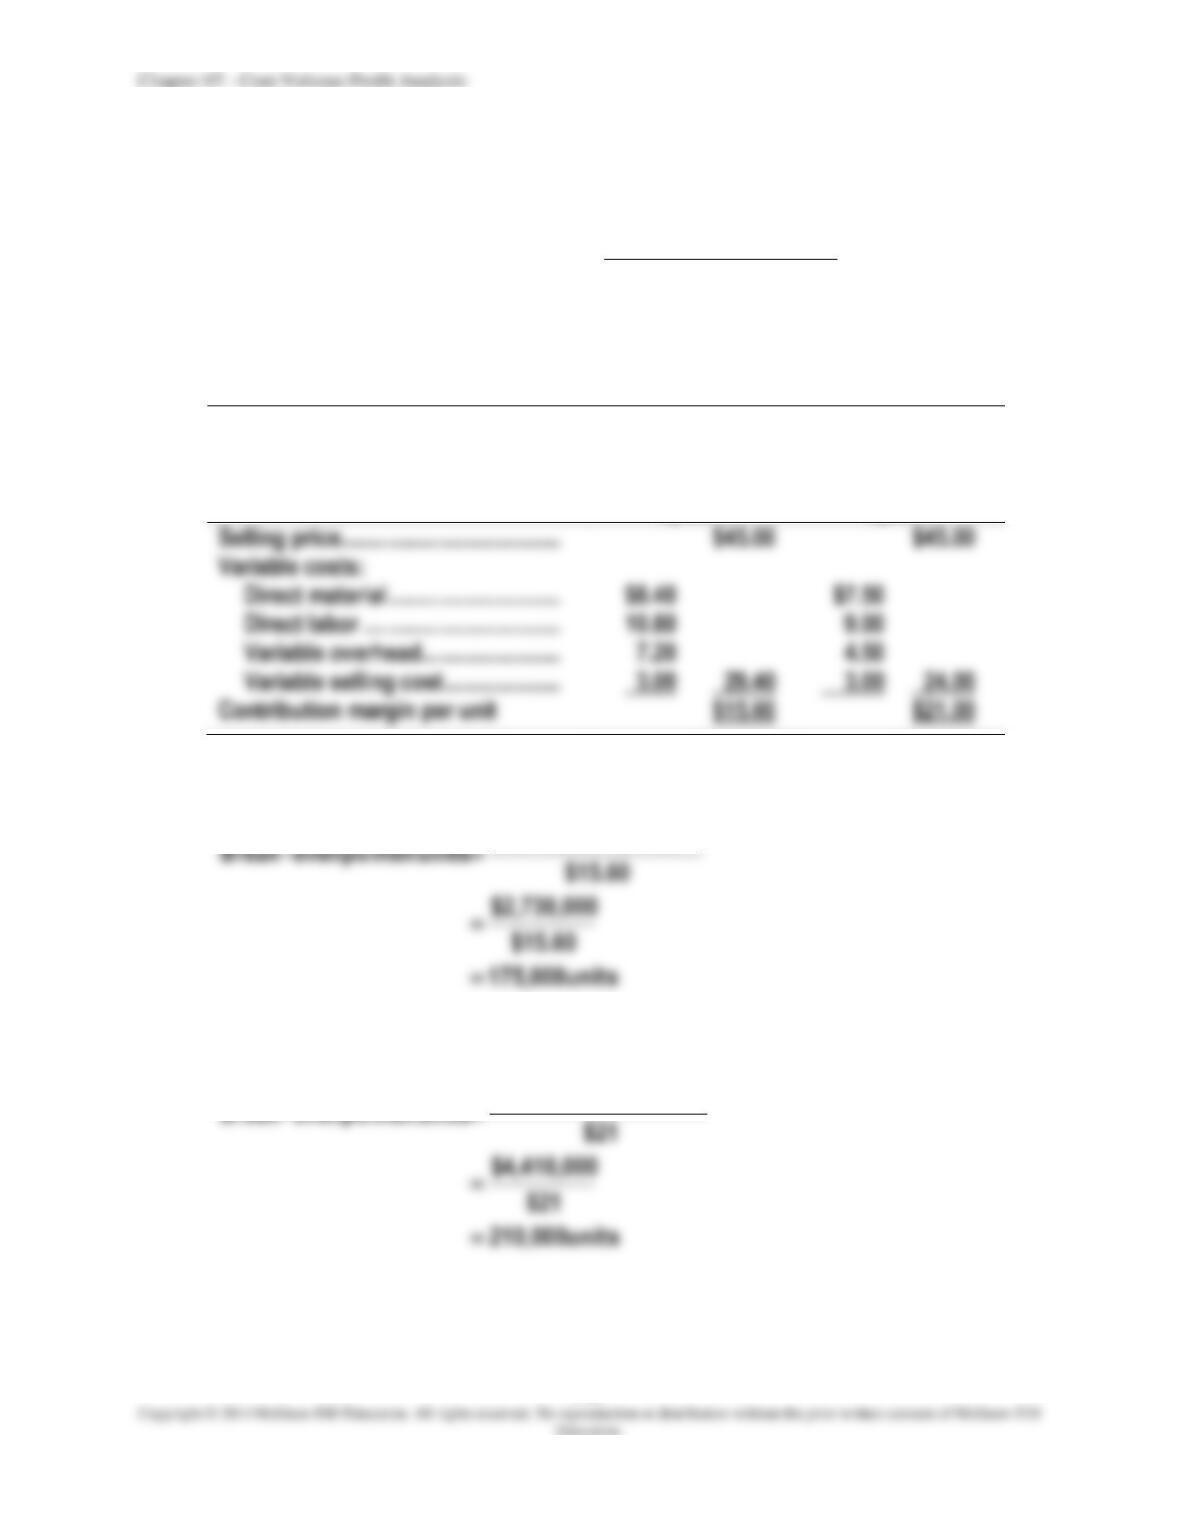
Calculation of contribution margins:
Labor-
Intensive
Production
System
Computer-
Assisted
Manufacturing
System
Selling price ………………………………..
$45.00
$45.00
Variable costs:
Direct material…………………………
$8.40
$7.50
Direct labor …………………………….
10.80
9.00
Variable overhead ……………………
7.20
4.50
Variable selling cost ………………..
3.00
(a)
Labor-intensive production system:
$750,000 $1,980,000
+
(b)
Computer-assisted manufacturing system:
$750,000 $3,660,000
+
Chapter 07 – Cost-Volume-Profit Analysis
7-38
PROBLEM 7-44 (CONTINUED)
2.
Zodiac’s management would be indifferent between the two manufacturing methods
at the volume (X) where total costs are equal.
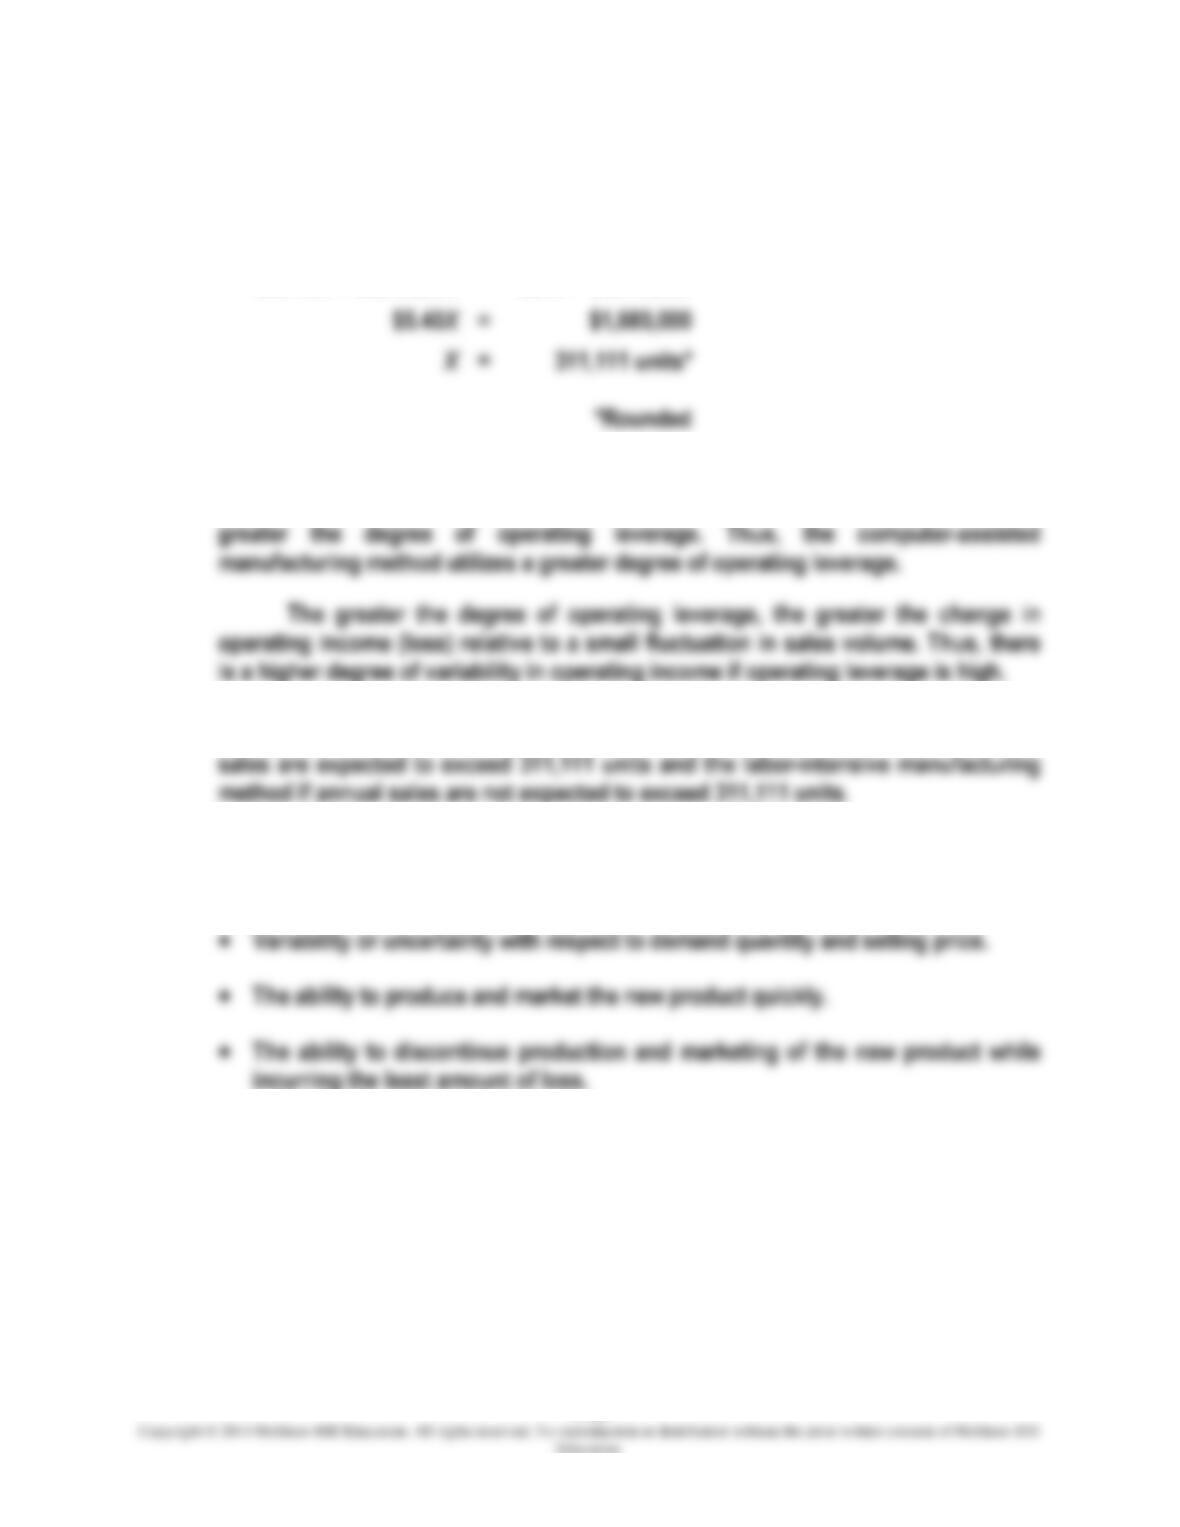
$29.40X + $2,730,000
=
$24X + $4,410,000
=
3.
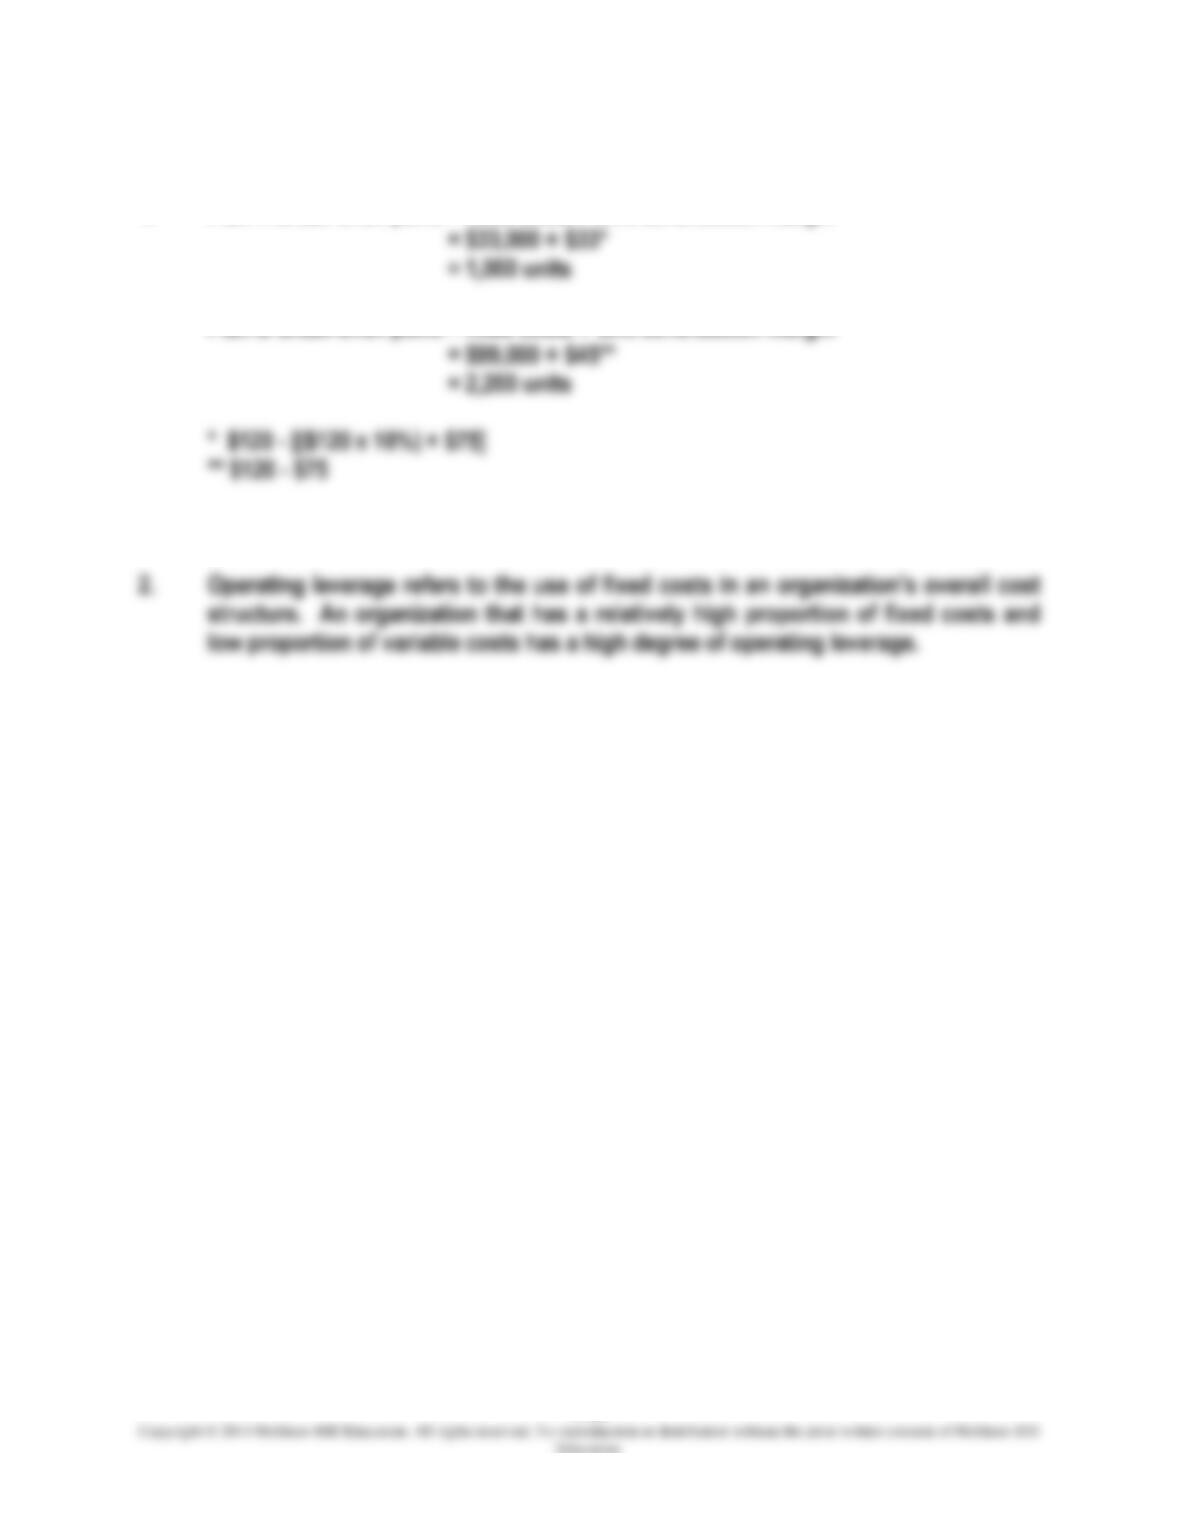
Operating leverage is the extent to which a firm’s operations employ fixed operating
costs. The greater the proportion of fixed costs used to produce a product, the
4.
Management should employ the computer-assisted manufacturing method if annual
5.
Zodiac’s management should consider many other business factors other than
operating leverage before selecting a manufacturing method. Among these are:
Chapter 07 – Cost-Volume-Profit Analysis
7-39
PROBLEM 7-45 (40 MINUTES)
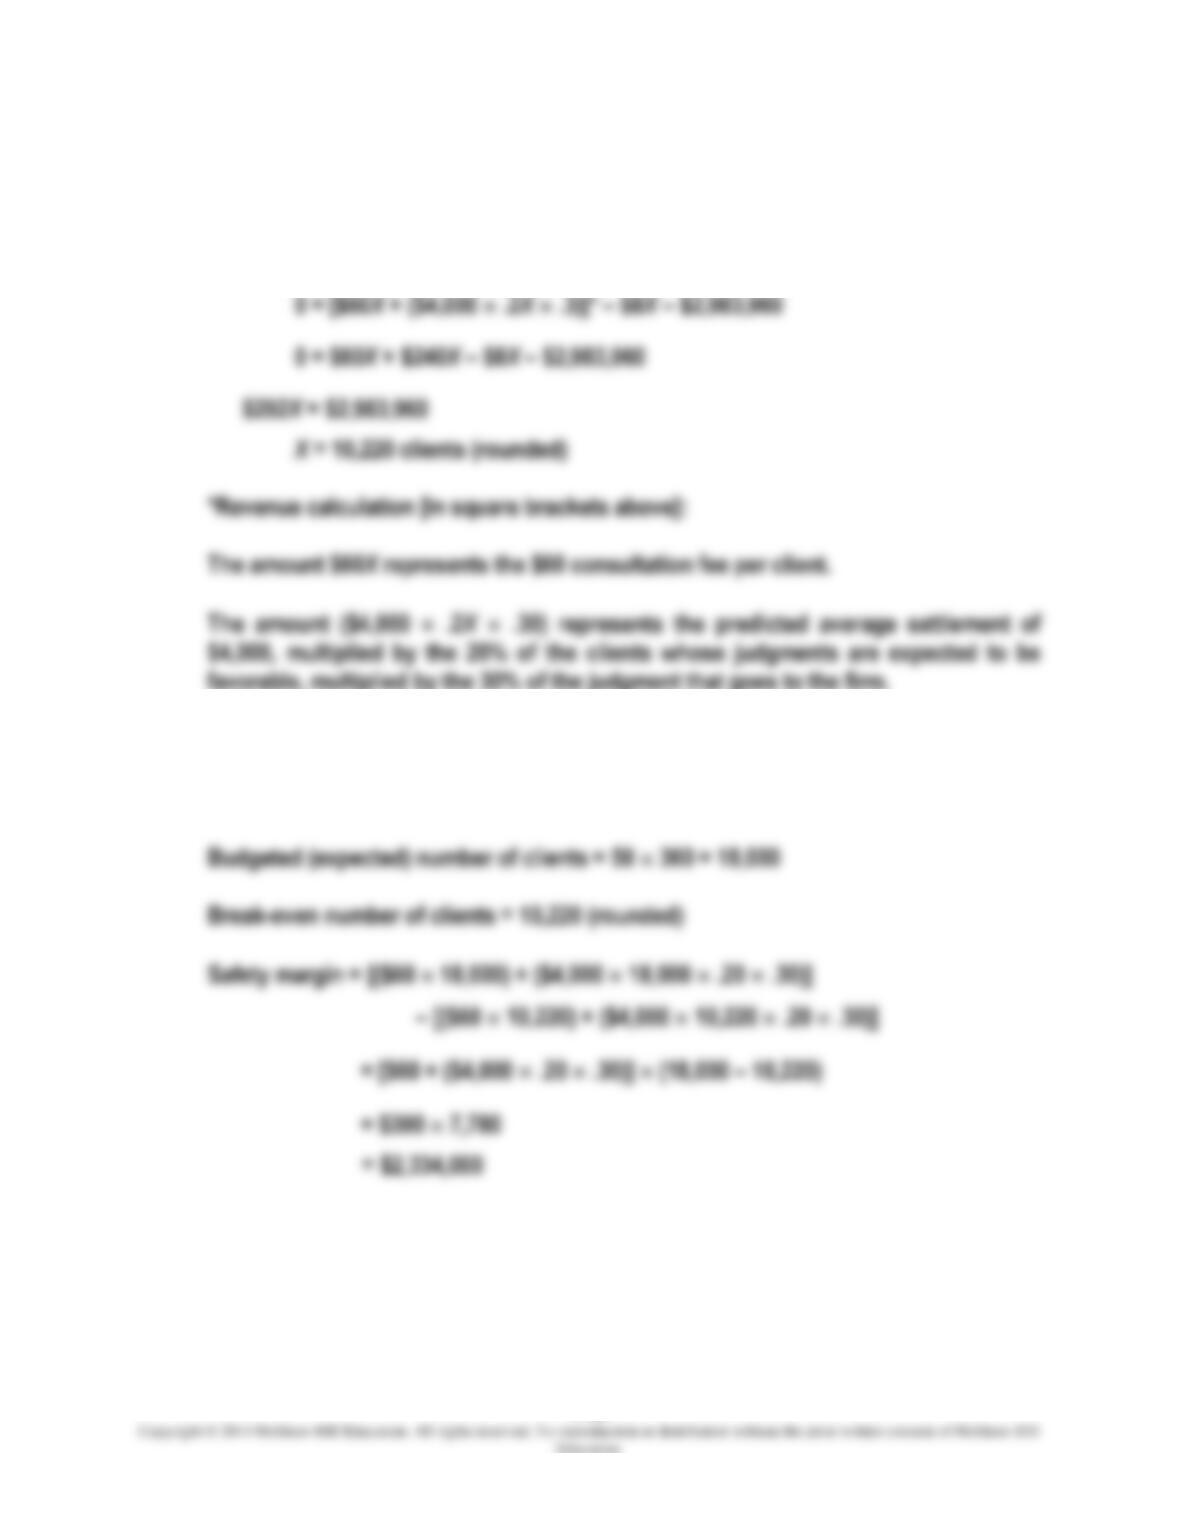
1. In order to break even, during the first year of operations, 10,220 clients must visit the
law office being considered by Steven Clark and his colleagues, as the following
calculations show.
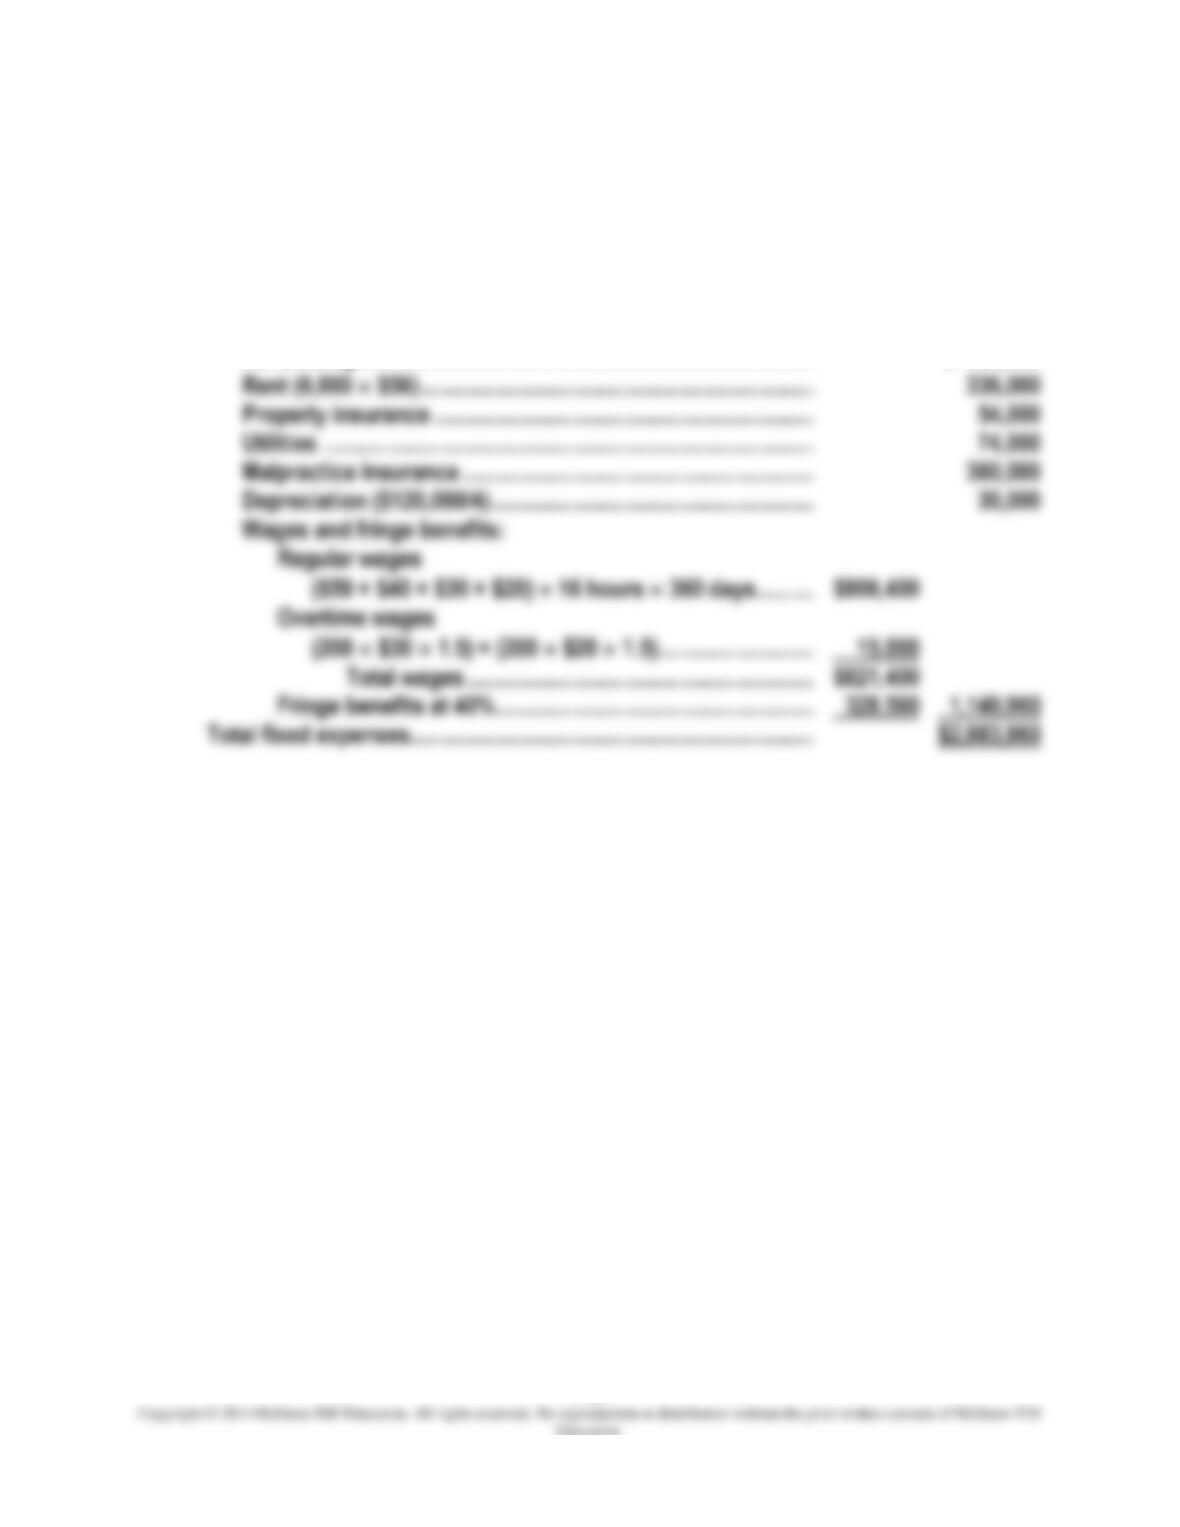
Fixed expenses:
Advertising ……………………………………………………………………. $ 980,000
Chapter 07 – Cost-Volume-Profit Analysis
7-40
PROBLEM 7-45 (CONTINUED)
Break-even point:
0 = revenue – variable cost – fixed cost
2. Safety margin:
Safety margin = budgeted sales revenue − break-even sales revenue